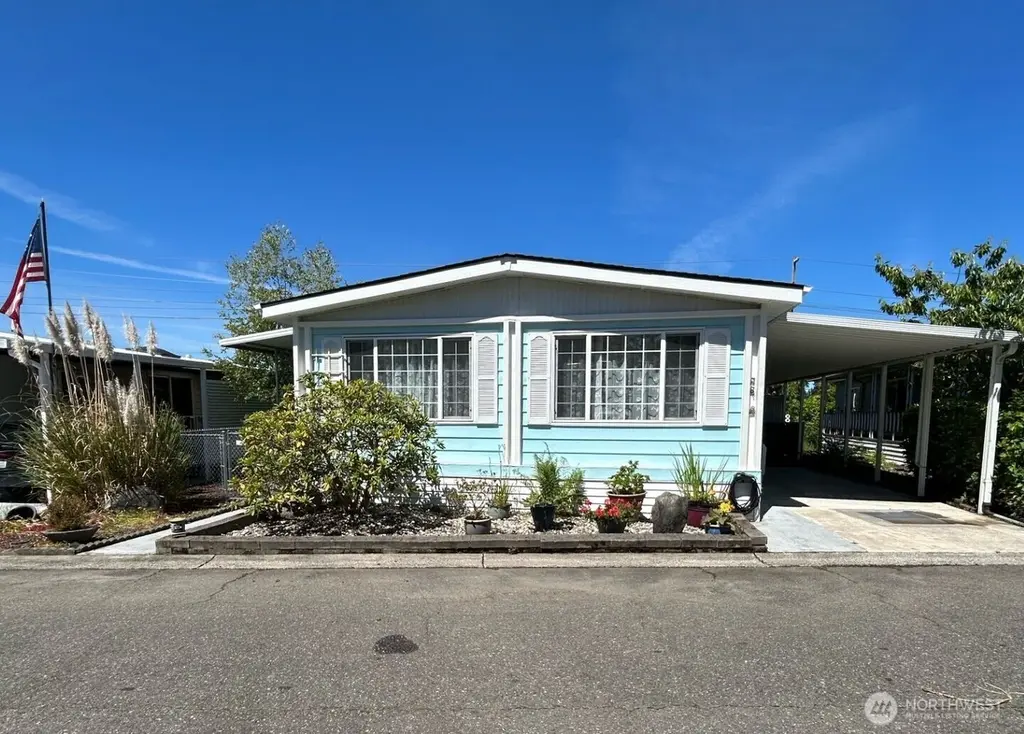
1415 84th St SE #181 · Everett, WA
Flood risk No data
- FEMA flood zone
- —
- Chance of flooding over 30 yrs
- —
- Est. flood insurance / yr
- —
Fire risk No data
- Est. fire insurance / yr
- —
Heat risk No data
- Hot days now (above threshold)
- —
- Hot days in 30 yrs
- —
Wind risk No data
- Chance of severe wind over 30 yrs
- —
Air-quality risk No data
- Unhealthy air days now
- —
- Unhealthy air days in 30 yrs
- —
Risk factors via First Street. Map © Google.
Why this score? — see what drove the B+ grade
The composite is a weighted blend of 9 inputs, each scored 0–100. Each bar is that input's sub-score; the figure is the points it added to the 100-point composite (weight × sub-score).
- Cash flow +30.0/30.0
- ARV discount +15.0/15.0
- 1% rule +10.0/10.0
- DSCR +10.0/10.0
- Schools +5.9/10.0
- Livability +3.7/5.0
- Condition / age +2.5/5.0
- Rent growth +1.7/5.0
- Appreciation +0.0/10.0
$85,000
🖨 Deal sheet 📄 Offer letter ✓ Due diligence
Listing remarks
Move right in and enjoy the peace of mind that comes with a beautifully maintained home where the major updates have already been taken care of! Featuring upgraded heating, plumbing, electrical, an updated electrical panel, central heat and A/C, plus approximately 15 years remaining on the 25-year composite roof. This light and bright 2-bedroom, 2-bath home offers 1,339 sq ft of comfortable living with fresh interior paint, two skylights that fill the home with natural light, and a welcoming layout designed for easy everyday living. Step outside and relax on your private deck—perfect for morning coffee, entertaining, or simply enjoying the peaceful greenbelt setting. The fully fenced
Key facts
- Upgraded plumbing
- Upgraded electrical
- Upgraded heating
Tags
Property features AI
Finance
- Other: Mobile home remains; Has view
- Financial info: Land lease required; Listing terms: Cash, Conventional
- HOA & community: Located in Mobile Country Club Park (senior community); Park amenities: clubhouse, common area, exercise room, laundry, pool, recreational area, trails
Exterior
- Parking: Carport; RV parking (park amenity)
- Utilities: Electric power; PUD power company; Water paid by park; Sewer paid by park; Comcast cable connected; Xfinity internet connected
- Home design: Manufactured double-wide home; One level; North-facing
- Construction: Metal/vinyl construction materials; Composition roof; Pillar/post/pier foundation; Manufactured house (double wide)
- Exterior features: Metal/vinyl exterior; Patio/porch/deck; Landscaped; Paved lot
Interior
- Kitchen: Dishwasher; Refrigerator; Stove/Range
- Bedrooms: 2 bedrooms
- Flooring: Vinyl plank
- Bathrooms: 1 full bath; 1 three-quarter bath; 1 bathtub; 2 showers
- Heating & cooling: Ductless heating; Central air conditioning
- Interior features: Dining room; Entry; Family room; Kitchen with eating space; Living room; Skylights; Drapes; Walk-in closet; Bath off primary
- Laundry & utility: Washer; Dryer
Neighborhood map
What this means for you Summary
Snapshot
- This is a 3-bed/2.0-bath manufactured listed at $85k.
Deal economics
- At list price, monthly cash flow is $1k ($16k/yr) — positive.
- The deal already cash-flows at list — no discount required.
- Meets the 1% rule at list price ($2k rent vs $85k).
- Cap rate 25.5% vs local median 2.5% in Everett — top-decile yield for the area; either an underpriced asset or a hidden risk that comps aren't pricing in. Stress-test before assuming the spread holds.
Location & tenants
- Location reads 73/100 on livability (#199 in WA) — a middle-class / working-renter tenant base. Strengths: commute A+, housing A, health & safety A; Watch: schools C-, crime D+, amenities F.
- Everett School District (urban): math 60% / reading 72% proficiency, ranked #26 of 291 in WA (top 9%) — acceptable for families but not a draw, mixed tenant base, ~2y average lease.
- Market conditions: Rents falling (-3.2%/yr); 275 active listings in the ZIP; 28 comparable units currently listed for rent nearby; rentals leasing fast (median 10d on market — plan ~1-2 weeks tenant-placement turnaround); solid renter incomes; 3,982 units permitted in Snohomish County in 2024 (1,492 in 5+ unit buildings).
Forward outlook
- Local home prices are declining (-3.0%/yr); year-one equity from $588 of loan paydown is wiped out by about $3k of value loss. Plan a longer hold.
- Snohomish County population projected at +30% by 2050 — long-run rental-demand tailwind backs the buy-and-hold thesis.
- At projected returns (-3.0% appreciation + 0.0% rent growth), your $24k cash investment doubles in ~2 years — after that, you're playing with house money.
Negotiation context
- Only 5 days on market — expect competitive offers; lowballing is unlikely to land.
Questions for the listing agent
- Built in 1977 — when were the roof, HVAC, electrical panel, plumbing, and water heater last replaced?
- Is there a deadline driving the sale (1031 exchange, divorce, estate, relocation)? That informs how much negotiation room exists.
- Crime grade is D in this area — have there been break-ins, vandalism, or insurance claims at this property in the last 3 years? What carrier currently insures it and at what premium?
- What's the average days-on-market for RENTAL listings here right now (not sales)? A rising rental-DOM trend means longer vacancies and softer asking-rent achievability than the comps imply.
- What's the recent tenant-quality profile in this submarket — average credit score on applications, eviction rate, late-payment / NSF rate, and stable-employment percentage? A property-management company in the area should have these aggregated.
- How much new for-sale + rental construction is in the pipeline within 1–3 miles? Heavy new supply typically softens prices + rents 12–24 months out; constrained supply supports both.
Investment metrics
- 1% rule
- 2.88% ✓
- Cap rate
- 25.55%
- Cash-on-cash
- 68.77%
- DSCR
- 4.06
- GRM
- 2.9
CMA / ARV
- ARV (on-the-fly)
- $149,968
- Comps found
- 12
Show comp detail 12 sales within ~0.75 mi
| Address | Dist | Beds/Ba | Sqft | Sold | Price | $/sf | Match |
|---|---|---|---|---|---|---|---|
| 1415 84th St SE #192 | 0.00mi | 2/2.0 (-1) | 1,340 (+0%) | 9mo | $150,000 | $112 | 87 |
| 1415 84th St SE #63 | 0.00mi | 2/2.0 (-1) | 1,344 (+0%) | 13mo | $130,000 | $97 | 83 |
| 1415 84th St SE #205 | 0.00mi | 2/2.0 (-1) | 1,426 (+6%) | 2mo | $128,000 | $90 | 82 |
| 1415 84th St SE #104 | 0.00mi | 2/2.0 (-1) | 1,242 (-7%) | 1mo | $75,000 | $60 | 82 |
| 1415 84th St SE #172 | 0.00mi | 2/2.0 (-1) | 1,424 (+6%) | 3mo | $80,000 | $56 | 82 |
| 1415 84th St SE #17 | 0.00mi | 2/2.0 (-1) | 1,368 (+2%) | 13mo | $197,950 | $145 | 81 |
| 1415 84th St SE #45 | 0.00mi | 2/2.0 (-1) | 1,240 (-7%) | 10mo | $65,000 | $52 | 75 |
| 1415 84th St SE #197 | 0.00mi | 2/2.0 (-1) | 1,440 (+8%) | 12mo | $115,000 | $80 | 72 |
| 1415 84th St SE #176 | 0.00mi | 2/2.0 (-1) | 1,436 (+7%) | 13mo | $186,000 | $130 | 72 |
| 1415 84th St SE #11 | 0.00mi | 2/2.0 (-1) | 1,200 (-10%) | 8mo | $145,000 | $121 | 71 |
| 1415 84th St SE #80 | 0.00mi | 2/2.0 (-1) | 1,194 (-11%) | 7mo | $140,000 | $117 | 71 |
| 1415 84th St SE #36 | 0.00mi | 2/2.0 (-1) | 1,152 (-14%) | 2mo | $150,000 | $130 | 70 |
Match score weights: distance 35% · size 25% · config 20% · recency 20%. Top-matched comps best support the ARV.
Projected returns pro-forma
-3.0% appreciation · 0.0% rent growth · sell at horizon
- IRR
- 64.8%
- Equity multiple
- 3.77×
- Total profit
- $65,952
- Equity at exit
- $12,674
- IRR
- 68.2%
- Equity multiple
- 6.95×
- Total profit
- $141,690
- Equity at exit
- $7,349
Cash invested: $23,800 (down + closing). Projections, not guarantees.
Landlord ↔ Tenant lean methodology
- Overall (STATE)
- 28 Tenant-Leaning
- State Washington
- 28 Tenant-Leaning · D+8
- County
- — inherits STATE
- City
- — inherits STATE
ZIP-level market 98208
- Rents YoY
- -3.2%
- Active inventory
- 275
- Price-to-rent
- 2.9×
Monthly cashflow live
- Estimated rent
- $2,445 high interval (Pro) →
- Mortgage (P&I)
- −$446
- Tax from tax record
- −$87 /mo · $1,042/yr
- Insurance
- −$35
- HOA
- −$0
- Vacancy / Maint / Mgmt
- −$514
- Net cashflow
- $1,364
Break-even live
UW: 25.0% down · 7.5% · 30yr · 1.5% tax · 5.0% vac · 8.0% maint · 8.0% mgmt
Financing live
Cash to close
- Down payment
- $21,250
- Closing costs
- $2,550
- Reserves months
- —
- Total cash needed
- —
Loan-product check · same deal, 3 products live
Conventional
25% down · 7.5% · 30yr
- Down + closing
- —
- Monthly P&I
- —
- Monthly cashflow
- —
- DSCR
- —
- Eligible?
- —
Personal DTI + credit; lowest rate.
DSCR
20% down · 8.5% · 30yr
- Down + closing
- —
- Monthly P&I
- —
- Monthly cashflow
- —
- DSCR
- —
- Eligible?
- —
No personal income docs; deal must DSCR.
Hard money
10% down · 12.0% · 12mo
- Down + closing
- —
- Monthly P&I
- —
- Monthly cashflow
- —
- DSCR
- —
- Eligible?
- —
Short-term bridge; refi at stabilization.
Rent comps 28 comps
| Address | Beds | Baths | Sqft | Rent | $/sqft | DOM | Units | Dist |
|---|---|---|---|---|---|---|---|---|
| 1224 Kossuth Ave Everett, WA | 2.0 | 1.0 | 1375 | $2,700 | $1.96 | 19d | 1 | 0.44mi |
| 9618 19th Ave SE Unit C Everett, WA | 3.0 | 3.0 | 1637 | $3,200 | $1.95 | 10d | 1 | 0.68mi |
| 233 Dorn Ave Unit 1 Everett, WA | 2.0 | 1.0 | 944 | $1,950 | $2.07 | 10d | 1 | 0.74mi |
| 8102 Evergreen Way Everett, WA | 1.0–5.0 | 1.0–2.0 | 1390 | $2,628 | $1.89 | 1d | 17 | 0.75mi |
| 115 Dorn Ave Everett, WA | 2.0 | 1.0–2.0 | 946 | $1,738 | $1.84 | 16d | 1 | 0.80mi |
| 618 75th St SE Everett, WA | 3.0 | 2.0 | 1232 | $2,400 | $1.95 | 10d | 1 | 0.86mi |
| 1915 75th St SE Unit 1H Everett, WA | 3.0 | 1.5 | 1300 | $2,500 | $1.92 | 24d | 1 | 0.89mi |
| 10101 7th Ave SE Everett, WA | 1.0–3.0 | 1.0–2.0 | 1073 | $2,805 | $2.61 | 1d | 16 | 0.90mi |
| 701 75th St SE Everett, WA | 1.0–3.0 | 1.0 | 820 | $2,075 | $2.53 | 4d | 5 | 0.92mi |
| 120 W Casino Rd Everett, WA | 1.0–2.0 | 1.0–1.5 | 818 | $1,993 | $2.43 | 2d | 13 | 1.00mi |
| 2319 75th St SE Everett, WA | 3.0 | 2.0 | 1112 | $2,745 | $2.47 | 24d | 1 | 1.00mi |
| 1304 Bruskrud Rd Everett, WA | 2.0 | 1.5–2.0 | 900 | $2,076 | $2.31 | 4d | 5 | 1.03mi |
| 120 SE Everett Mall Way Everett, WA | 1.0–2.0 | 1.0–2.0 | 813 | $2,172 | $2.67 | 1d | 43 | 1.13mi |
| 6911 Rainier Dr Unit 11-07 Everett, WA | 2.0 | 1.5 | 1008 | $2,095 | $2.08 | 4d | 1 | 1.13mi |
| 6911 Rainier Dr Unit 11-03 Everett, WA | 2.0 | 1.5 | 1008 | $1,695 | $1.68 | 24d | 1 | 1.13mi |
| 222 W Marilyn Ave Everett, WA | 3.0 | 1.0 | 1000 | $2,400 | $2.40 | 16d | 1 | 1.25mi |
| 8710 5th Ave W Everett, WA | 2.0 | 2.0 | 950 | $2,050 | $2.16 | 2d | 11 | 1.28mi |
| 8530 5th Ave W Everett, WA | 1.0–2.0 | 1.0 | 808 | $1,595 | $1.97 | 4d | 2 | 1.28mi |
| 9515 Holly Dr Unit 1 Everett, WA | 3.0 | 2.5 | 1600 | $3,000 | $1.88 | 43d | 1 | 1.32mi |
| 6801 Lombard Ave Unit B Everett, WA | 4.0 | 2.0 | 1460 | $3,200 | $2.19 | 2d | 1 | 1.33mi |
| 6609 Cady Rd Unit 2 Everett, WA | 2.0 | 1.5 | 1386 | $2,225 | $1.61 | 24d | 1 | 1.34mi |
| 702 W Casino Rd Everett, WA | 1.0–2.0 | 1.0–1.5 | 850 | $1,749 | $2.06 | 4d | 21 | 1.36mi |
| 9925 4th Ave W Apt 6 Everett, WA | 2.0 | 2.0 | 1000 | $1,445 | $1.45 | 1d | 1 | 1.39mi |
| 2505 Madison St Unit A Everett, WA | 3.0 | 1.0 | 1040 | $2,800 | $2.69 | 24d | 1 | 1.39mi |
| 2601 106th Pl SE Everett, WA | 3.0 | 2.0 | 1221 | $3,245 | $2.66 | 12d | 1 | 1.45mi |
| 2517 Howard Ave Everett, WA | 2.0–3.0 | 1.0 | 900 | $1,995 | $2.22 | 20d | 2 | 1.48mi |
| 10011 33rd Ave SE Unit B Everett, WA | 3.0 | 2.5 | 1650 | $2,850 | $1.73 | 3d | 1 | 1.49mi |
| 10011 33rd Ave SE Unit A & Everett, WA | 3.0 | 2.5 | 1625 | $2,850 | $1.75 | 3d | 1 | 1.49mi |
Listing history 6 events
-
2026-06-18days on market $85,000 Active 5 DOM
-
2026-06-17days on market $85,000 Active 4 DOM
-
2026-06-16days on market $85,000 Active 3 DOM
-
2026-06-15days on market $85,000 Active 2 DOM
-
2026-06-13remarks 693-char remark
-
2026-06-13$85,000 Active 1 DOM
ⓘ Source: listings_history table (triggers on properties + properties_extension) + one-shot
backfill from property_details.listing_events for pre-trigger history.
Tax reassessment forecast WA · Resets to sale price
- Current annual tax
- $1,042 · $87/mo
- Projected year-2 tax
- $1,042 · $87/mo
- Expected delta
- $0/yr ($0/mo · 0.0%)
ⓘ Screening estimate from a state-policy table — verify with the county assessor before closing.
Nearby sold comps map
Loading sold comps map…
Walkable amenities ~0.75 mi
Loading nearby amenities…
Taxation est. · year 1
- Rental income
- $29,345
- − Mortgage interest
- −$4,761
- − Property taxes
- −$1,042
- − Insurance
- −$425
- − Repairs & maintenance
- −$2,348
- − Management
- −$2,348
- − Depreciation
- −$2,473
- Taxable income
- $15,949
- Est. tax owed @ 24.0%
- −$3,828
- After-tax cash flow
- $12,539/yr
For passive investors: Depreciation is non-cash, so a rental often shows a tax loss while cash-flowing — sheltering income. Rental losses are passive: they offset passive income freely, and up to $25,000/yr can offset ordinary (W-2) income if you actively participate and your MAGI is under $100k (phasing out to $0 by $150k); unused losses carry forward. On sale, claimed depreciation is recaptured at up to 25%, and gains may owe capital-gains tax (a 1031 exchange can defer both). Figures are a year-1 estimate at your 24.0% rate — not tax advice; consult a CPA.
Schools (NCES district)
- District
- Everett School District
- NCES district ID
- 5302670
- Math proficiency
- 60% ▲ 1.00%
- Reading proficiency
- 72% ▲ 1.00%
- Median HH income
- $66,815
- Composite
- 59.0/100
- National rank
- #1964
- State rank
- #26 of 291 in WA
Livability — Everett
- Score
- 73/100
- State rank
- #199
- US rank
- #5489
Category grades
Schools grade is shown separately in the Schools card above.
Census & demographics
- Census place
- Everett, WA
- County
- Snohomish County · 786,756 people
- City population
- 173,457
- Metro
- Seattle-Tacoma-Bellevue, WA
- Population (ZIP)
- 60,915
- Household income
- $103,705
- Rent vs Own
- Severe rent burden
- 1617.0
Population outlook (Snohomish County) Hauer SSP2
- Today (2025)
- 899,800 people
- By 2030
- 960,975 · +6.8%
- By 2040
- 1,074,447 · +19.4%
- By 2050
- 1,171,954 · +30.2%
- By 2075
- 1,384,849 · +53.9%
- By 2100
- 1,497,296 · +66.4%
Race, ethnicity, and origin ACS 2023
- Neighborhood character
- Diverse neighborhood (Simpson 0.65)
- Race & ethnicity
- White 55% Asian 17% Hispanic / Latino 14% Two or more races 13% Black 5%
- Hispanic origin (detail)
- Mexican 10%
- Common ancestry
- Portuguese 5% Italian 3% Slovak 2%
- Foreign-born
- 27% · Canada, Vietnam, South Korea
- Languages at home
- 66% English-only · Spanish 9% Vietnamese 4% Other Asian/Pacific 4%
Political lean MEDSL · Snohomish
- 2024 margin
- D (+19.0) · D 57.8% · R 38.9% · Other 3.3%
- 2008→2024 swing
- +0.1pp no change · 2008: 18.9pp · 2024: 19.0pp
- All cycles
- 2024: D+19.0 2020: D+20.6 2016: D+16.6 2012: D+16.2 2008: D+18.9
Not yet ingested
- Civics
- —
Market trends
- HPI YoY
- ▼ -884.74%
- Current HPI
- 337.856
- Rent YoY
- ▼ -3.16%
- Metro
- Seattle-Tacoma-Bellevue, WA
- State GDP YoY
- ▲ 4.65%
- F500 in state
- 22
Industry mix (Fortune 500 HQ in WA)
| Industry | F500 HQs | Revenue |
|---|---|---|
| Retail | 2 | $269B |
|
||
| Technology / Retail | 1 | $638B |
|
||
| Technology | 1 | $245B |
|
||
| Telecommunications | 1 | $38B |
|
||
| Food / Beverage | 1 | $36B |
|
||
| Automotive / Trucks | 1 | $34B |
|
||
Price history
1 event — show timeline
- 2026-06-13 Listed $85,000 NWMLS as Distributed by MLS Grid
Property tax history
+3.4%/yrLatest (2026): $1,042 · +2.2% YoY. Source: county tax records.
Cash-flow waterfall
monthlySold comps — $/sqft
last 12 mo · ≤1 miLoading sold comps…