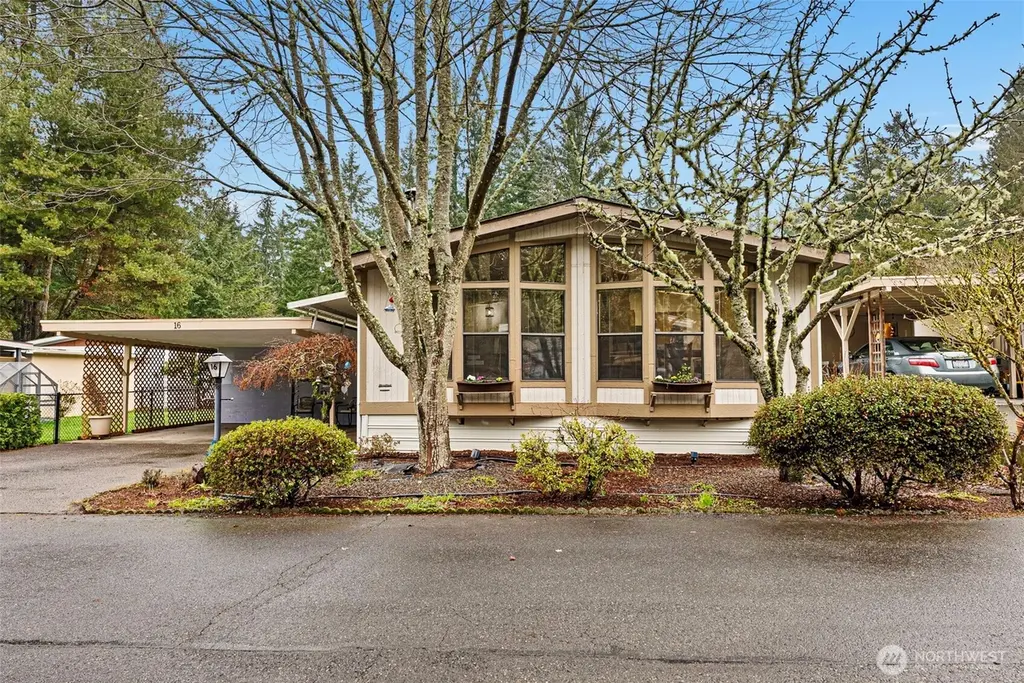
10414 Peacock Hill Ave #16 · Gig Harbor, WA
Flood risk 1/10 · Minimal
- FEMA flood zone
- X (unshaded)
- Chance of flooding over 30 yrs
- 0.0%
- Est. flood insurance / yr
- $507 – $1,088
Fire risk 1/10 · Minimal
- Est. fire insurance / yr
- $604 – $1,122
Heat risk 3/10 · Minor
- Hot days now (above 87°F)
- 7 days/yr
- Hot days in 30 yrs
- 14 days/yr
Wind risk 1/10 · Minimal
- Chance of severe wind over 30 yrs
- —
Air-quality risk 6/10 · Moderate
- Unhealthy air days now
- 8 days/yr
- Unhealthy air days in 30 yrs
- 8 days/yr
Risk factors via First Street. Map © Google.
Why this score? — see what drove the B+ grade
The composite is a weighted blend of 9 inputs, each scored 0–100. Each bar is that input's sub-score; the figure is the points it added to the 100-point composite (weight × sub-score).
- Cash flow +30.0/30.0
- ARV discount +15.0/15.0
- DSCR +10.0/10.0
- 1% rule +8.7/10.0
- Schools +6.0/10.0
- Livability +3.7/5.0
- Rent growth +2.5/5.0
- Condition / age +2.5/5.0
- Appreciation +0.0/10.0
$149,000
🖨 Deal sheet (PDF) 📄 Offer letter ✓ Due diligence
Listing remarks
Minutes from downtown Gig Harbor, this home is located in Hillcrest Manufactured Home Park, a 55+ community. This two-bedroom home offers 1,148 sq ft of living space. The entry opens into the living room featuring a cozy wood stove. Beyond that is a dining area connected to the open and bright kitchen. The primary bedroom features a large ensuite bath with a soaking tub. Lots of storage in the double closets. A second bedroom and a ¾ bath provide comfortable accommodations for guests. A dedicated laundry room opens to a pet run in the side yard. A heat pump provides AC for hot summer days. Space rent covers water, garbage, and septic. Very close to the popular shopping corridor - Tar
Key facts
- Wood stove
- Pet run
- Soaking tub
Tags
Neighborhood map
What this means for you Summary
Snapshot
- This is a 2-bed/2.0-bath manufactured listed at $149k.
Deal economics
- At list price, monthly cash flow is $728 ($9k/yr) — positive.
- The deal already cash-flows at list — no discount required.
- Meets the 1% rule at list price ($2k rent vs $149k).
- Recommended offer: $131k (12.0% below list) — sets the bar for market timing.
- Cap rate 12.2% vs local median 1.9% in Gig Harbor — top-decile yield for the area; either an underpriced asset or a hidden risk that comps aren't pricing in. Stress-test before assuming the spread holds.
Location & tenants
- Location reads 74/100 on livability (#177 in WA, #4,581 nationally) — a middle-class / working-renter tenant base. Strengths: commute A+, employment A+, housing A-; Watch: health & safety C-, amenities F, cost of living F.
- Peninsula School District (suburban): math 61% / reading 72% proficiency, ranked #21 of 291 in WA (top 7%) — acceptable for families but not a draw, mixed tenant base, ~2y average lease; only 19% free/reduced lunch — higher-income household profile.
- Zoned schools: Purdy Elementary School (484 students, 22% FRL); Harbor Ridge Middle School (596 students, 19% FRL); Peninsula High School (1,372 students, 28% FRL) — zoned schools at 23% FRL track the district average.
- Market conditions: 215 active listings in the ZIP; 3 comparable units currently listed for rent nearby; rentals lingering (median 46d on market — plan ~5-8 weeks vacancy on turnover, expect pricing pressure); 67% of comp listings sitting > 30 days — soft ceiling on asking rent; high-income renter base; 3,209 units permitted in Pierce County in 2024 (1,269 in 5+ unit buildings).
Forward outlook
- Local home prices are declining (-3.0%/yr); year-one equity from $1k of loan paydown is wiped out by about $4k of value loss. Plan a longer hold.
- Pierce County population projected at +26% by 2050 — long-run rental-demand tailwind backs the buy-and-hold thesis.
- At projected returns (-3.0% appreciation + 3.0% rent growth), your $42k cash investment doubles in ~6 years — after that, you're playing with house money.
Negotiation context
- It's been on market 139 days — a 12% lower offer ($131k) is reasonable based on typical stale-listing flexibility.
- 3 sale attempts since 26y ago with the ask held roughly flat each time — persistent listings suggest the price (not the market) is what's stuck; bring a comps-based counter.
Questions for the listing agent
- It's been on market 139 days. Have you received any prior offers? Is the seller open to a 12% concession, seller financing, or rate buy-down credit?
- Why hasn't it sold? Are there any deal-killer items the seller is aware of (foundation, flood, title, zoning, code violations)?
- Is there a deadline driving the sale (1031 exchange, divorce, estate, relocation)? That informs how much negotiation room exists.
- Schools are A-rated — typically a magnet for longer-tenancy family renters. What's the average tenant stay here, and is there a school-zone premium baked into asking?
- What's the average days-on-market for RENTAL listings here right now (not sales)? A rising rental-DOM trend means longer vacancies and softer asking-rent achievability than the comps imply.
- What's the recent tenant-quality profile in this submarket — average credit score on applications, eviction rate, late-payment / NSF rate, and stable-employment percentage? A property-management company in the area should have these aggregated.
- How much new for-sale + rental construction is in the pipeline within 1–3 miles? Heavy new supply typically softens prices + rents 12–24 months out; constrained supply supports both.
Investment metrics
- 1% rule
- 1.37% ✓
- Cap rate
- 12.16%
- Cash-on-cash
- 20.95%
- DSCR
- 1.93
- GRM
- 6.1
CMA / ARV
- ARV (median comp)
- $250,968
- List price
- $149,000
- Delta
- -40.63%
- Verdict
- UNDERPRICED
- Comps
- 1 within 2.0 mi
Projected returns pro-forma
-3.0% appreciation · 3.0% rent growth · sell at horizon
- IRR
- 13.3%
- Equity multiple
- 1.53×
- Total profit
- $22,177
- Equity at exit
- $22,216
- IRR
- 22.2%
- Equity multiple
- 2.89×
- Total profit
- $78,796
- Equity at exit
- $12,883
Cash invested: $41,720 (down + closing). Projections, not guarantees.
Landlord ↔ Tenant lean methodology
- Overall (STATE)
- 28 Tenant-Leaning
- State Washington
- 28 Tenant-Leaning · D+8
- County
- — inherits STATE
- City
- — inherits STATE
ZIP-level market 98332
- Active inventory
- 215
- Price-to-rent
- 6.1×
Monthly cashflow live
- Estimated rent
- $2,042 medium interval (Pro) →
- Mortgage (P&I)
- −$781
- Tax from tax record
- −$41 /mo · $497/yr
- Insurance
- −$62
- HOA
- −$0
- Vacancy / Maint / Mgmt
- −$429
- Net cashflow
- $728
Break-even live
Sensitivity live
| Price | -10% $813 | -5% $770 | +0% $728 | +5% $686 | +10% $644 |
|---|---|---|---|---|---|
| Rent | -10% $567 | -5% $648 | +0% $728 | +5% $809 | +10% $890 |
| Rate | -1.0pp $803 | -0.5pp $766 | base $728 | +0.5pp $690 | +1.0pp $650 |
UW: 25.0% down · 7.5% · 30yr · 1.5% tax · 5.0% vac · 8.0% maint · 8.0% mgmt
Financing live
Cash to close
- Down payment
- $37,250
- Closing costs
- $4,470
- Reserves months
- —
- Total cash needed
- —
Loan-product check · same deal, 3 products live
Conventional
25% down · 7.5% · 30yr
- Down + closing
- —
- Monthly P&I
- —
- Monthly cashflow
- —
- DSCR
- —
- Eligible?
- —
Personal DTI + credit; lowest rate.
DSCR
20% down · 8.5% · 30yr
- Down + closing
- —
- Monthly P&I
- —
- Monthly cashflow
- —
- DSCR
- —
- Eligible?
- —
No personal income docs; deal must DSCR.
Hard money
10% down · 12.0% · 12mo
- Down + closing
- —
- Monthly P&I
- —
- Monthly cashflow
- —
- DSCR
- —
- Eligible?
- —
Short-term bridge; refi at stabilization.
Rent comps 3 comps
| Address | Beds | Baths | Sqft | Rent | $/sqft | DOM | Units | Dist |
|---|---|---|---|---|---|---|---|---|
| 3616 105th St NW Unit A Gig Harbor, WA | 2.0 | 1.0 | 800 | $1,800 | $2.25 | 19d | 1 | 0.12mi |
| 9216 Randall Dr NW Gig Harbor, WA | 1.0 | 1.0 | 775 | $1,645 | $2.12 | 45d | 1 | 0.81mi |
| 11315 17th Avenue Ct NW Gig Harbor, WA | 3.0 | 2.0 | 1338 | $2,700 | $2.02 | 45d | 1 | 1.48mi |
Listing history 21 events
-
2026-06-21days on market $149,000 Active 139 DOM
-
2026-06-18days on market $149,000 Active 136 DOM
-
2026-06-17days on market $149,000 Active 135 DOM
-
2026-06-16days on market $149,000 Active 134 DOM
-
2026-06-15days on market $149,000 Active 133 DOM
-
2026-06-13days on market $149,000 Active 131 DOM
-
2026-06-09days on market $149,000 Active 127 DOM
-
2026-06-08days on market $149,000 Active 126 DOM
-
2026-06-07days on market $149,000 Active 125 DOM
-
2026-06-04days on market $149,000 Active 122 DOM
-
2026-06-03days on market $149,000 Active 121 DOM
-
2026-06-02days on market $149,000 Active 120 DOM
-
2026-06-01days on market $149,000 Active 119 DOM
-
2026-05-31days on market $149,000 Active 118 DOM
-
2026-05-01price $149,000
-
2026-02-02$155,000 Active
-
2024-01-16soldstatus $132,000 Closed
-
2023-12-15status Pending
-
2023-12-08$135,000 Active
-
2001-04-05soldstatus $30,000
-
2000-12-03$32,000
ⓘ Source: listings_history table (triggers on properties + properties_extension) + one-shot
backfill from property_details.listing_events for pre-trigger history.
Tax reassessment forecast WA · Resets to sale price
- Current annual tax
- $497 · $41/mo
- Projected year-2 tax
- $1,460 · $122/mo
- Expected delta
- +$963/yr (+$80/mo · 193.8%)
ⓘ Screening estimate from a state-policy table — verify with the county assessor before closing.
Climate risk First Street
- Flood 1/10 Low FEMA zone X (unshaded) · 0% chance over 30 yrs
- Wildfire 1/10 Low
- Heat 3/10 Moderate 7 d/yr ≥87°F today · 14 d/yr by 30 yrs out
- Wind 1/10 Low
- Air quality 6/10 Major 8 unhealthy d/yr today · 8 by 30 yrs out
Nearby sold comps map
Loading sold comps map…
Walkable amenities ~0.75 mi
Loading nearby amenities…
Taxation est. · year 1
- Rental income
- $24,502
- − Mortgage interest
- −$8,346
- − Property taxes
- −$497
- − Insurance
- −$745
- − Repairs & maintenance
- −$1,960
- − Management
- −$1,960
- − Depreciation
- −$4,335
- Taxable income
- $6,659
- Est. tax owed @ 24.0%
- −$1,598
- After-tax cash flow
- $7,140/yr
For passive investors: Depreciation is non-cash, so a rental often shows a tax loss while cash-flowing — sheltering income. Rental losses are passive: they offset passive income freely, and up to $25,000/yr can offset ordinary (W-2) income if you actively participate and your MAGI is under $100k (phasing out to $0 by $150k); unused losses carry forward. On sale, claimed depreciation is recaptured at up to 25%, and gains may owe capital-gains tax (a 1031 exchange can defer both). Figures are a year-1 estimate at your 24.0% rate — not tax advice; consult a CPA.
Schools (NCES district)
- District
- Peninsula School District
- NCES district ID
- 5306690
- Math proficiency
- 61% ▲ 1.00%
- Reading proficiency
- 72% ▼ -1.00%
- Median HH income
- $76,796
- Composite
- 60.35/100
- National rank
- #1718
- State rank
- #21 of 291 in WA
Livability — Gig Harbor
- Score
- 74/100
- State rank
- #177
- US rank
- #4581
Category grades
Schools grade is shown separately in the Schools card above.
Census & demographics
- Census place
- Gig Harbor, WA
- County
- Pierce County · 788,257 people
- City population
- 47,845
- Metro
- Seattle-Tacoma-Bellevue, WA
- Population (ZIP)
- 20,072
- Household income
- $135,330
- Rent vs Own
- Severe rent burden
- 218.0
Population outlook (Pierce County) Hauer SSP2
- Today (2025)
- 956,648 people
- By 2030
- 1,010,862 · +5.7%
- By 2040
- 1,113,170 · +16.4%
- By 2050
- 1,206,524 · +26.1%
- By 2075
- 1,436,425 · +50.2%
- By 2100
- 1,563,654 · +63.5%
Race, ethnicity, and origin ACS 2023
- Neighborhood character
- Predominantly White (82%)
- Race & ethnicity
- White 82% Two or more races 10% Hispanic / Latino 4% Asian 4% Black 1%
- Common ancestry
- Italian 6% Lithuanian 5% Portuguese 4%
- Foreign-born
- 6% · Canada, South Korea
- Languages at home
- 94% English-only · Spanish 2% Russian/Polish/Slavic 1% Other Asian/Pacific 1%
Political lean MEDSL · Pierce
- 2024 margin
- D (+10.8) · D 53.9% · R 43.1% · Other 3.0%
- 2008→2024 swing
- -1.4pp toward R · 2008: 12.2pp · 2024: 10.8pp
- All cycles
- 2024: D+10.8 2020: D+11.2 2016: D+7.5 2012: D+11.0 2008: D+12.2
Not yet ingested
- Civics
- —
Market trends
- HPI YoY
- ▼ -638.13%
- Current HPI
- 335.5178
- Rent YoY
- —
- Metro
- Seattle-Tacoma-Bellevue, WA
- State GDP YoY
- ▲ 4.65%
- F500 in state
- 22
Industry mix (Fortune 500 HQ in WA)
| Industry | F500 HQs | Revenue |
|---|---|---|
| Retail | 2 | $269B |
|
||
| Technology / Retail | 1 | $638B |
|
||
| Technology | 1 | $245B |
|
||
| Telecommunications | 1 | $38B |
|
||
| Food / Beverage | 1 | $36B |
|
||
| Automotive / Trucks | 1 | $34B |
|
||
Price history
+365.6% since first listed7 events — show timeline
- 2026-05-01 Price Changed $149,000 NWMLS as Distributed by MLS Grid
- 2026-02-02 Listed $155,000 NWMLS as Distributed by MLS Grid
- 2024-01-16 Sold (MLS) $132,000 NWMLS as Distributed by MLS Grid
- 2023-12-15 Pending — NWMLS as Distributed by MLS Grid
- 2023-12-08 Listed $135,000 NWMLS as Distributed by MLS Grid
- 2001-04-05 Sold (MLS) $30,000 NWMLS as Distributed by MLS Grid
- 2000-12-03 Listed $32,000 NWMLS as Distributed by MLS Grid
Property tax history
+42.4%/yrLatest (2026): $497 · -58.1% YoY. Source: county tax records.
Cash-flow waterfall
monthlySold comps — $/sqft
last 12 mo · ≤1 miLoading sold comps…