 Duplex
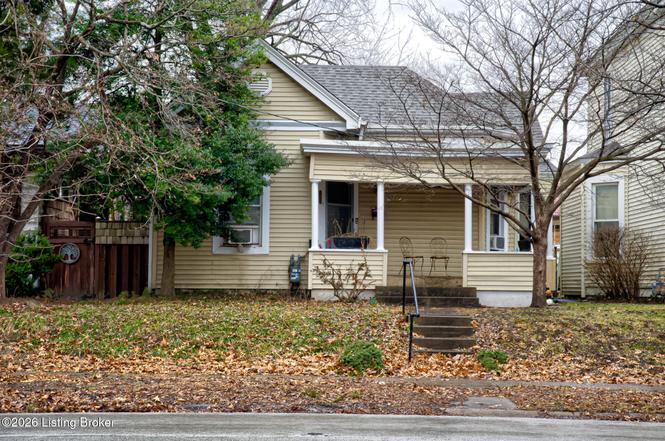
1821 Eastern Pkwy · Louisville, KY
Flood risk 1/10 · Minimal
- FEMA flood zone
- X (unshaded)
- Chance of flooding over 30 yrs
- 0.0%
- Est. flood insurance / yr
- $473 – $860
Fire risk 1/10 · Minimal
- Est. fire insurance / yr
- $839 – $1,559
Heat risk 5/10 · Moderate
- Hot days now (above 104°F)
- 7 days/yr
- Hot days in 30 yrs
- 20 days/yr
Wind risk 2/10 · Minimal
- Chance of severe wind over 30 yrs
- 2.0%
Air-quality risk 3/10 · Minor
- Unhealthy air days now
- 3 days/yr
- Unhealthy air days in 30 yrs
- 5 days/yr
Risk factors via First Street. Map © Google.
Why this score? — see what drove the C- grade
The composite is a weighted blend of 9 inputs, each scored 0–100. Each bar is that input's sub-score; the figure is the points it added to the 100-point composite (weight × sub-score).
- Cash flow +20.7/30.0
- ARV discount +7.5/15.0
- DSCR +6.6/10.0
- 1% rule +5.3/10.0
- Rent growth +3.9/5.0
- Livability +3.2/5.0
- Condition / age +2.5/5.0
- Schools +2.3/10.0
- Appreciation +0.0/10.0
$220,000
🖨 Deal sheet 📄 Offer letter ✓ Due diligence
Multi-family units
County records classify this as Multi-Family (2-4 Unit). Listing-text estimate: 2 units. confirmed
Listing remarks MLS
Home currently Duplex. Currently rented with signed one year lease. Owner occupies Unit 1. Property being sold as is. Has been owned by same owner for 28 years and rented most of those.
Key facts
- Ranges
- Off street parking
- Refrigerators
Tags
Neighborhood map
What this means for you Summary
Snapshot
- This is a 2 × 1-bed/1.0-bath units multifamily listed at $220k.
Deal economics
- At list price, monthly cash flow is $298 ($4k/yr) — positive. Per door: $149/mo.
- The deal already cash-flows at list — no discount required.
- Meets the 1% rule at list price ($2k rent vs $220k).
- Recommended offer: $207k (6.0% below list) — sets the bar for market timing.
- Cap rate 7.9% vs local median 5.0% in Louisville — top-decile yield for the area; either an underpriced asset or a hidden risk that comps aren't pricing in. Stress-test before assuming the spread holds.
Location & tenants
- Location reads 63/100 on livability (#333 in KY) — a middle-class / working-renter tenant base. Strengths: cost of living A+, housing A+; Watch: employment C-, health & safety D+, schools D-.
- Jefferson County (urban): math 19% / reading 35% proficiency, ranked #121 of 165 in KY (top 73%) — low school quality limits family demand, transient renter base, plan for 1-2y turnover.
- Market conditions: Rents rising fast (+5.8%/yr); 99 active listings in the ZIP; 6 comparable units currently listed for rent nearby; rentals at typical pace (median 16d on market — plan ~3-4 weeks tenant-placement turnaround); 2,836 units permitted in Jefferson County in 2024 (1,558 in 5+ unit buildings).
- This rent runs 38% of the median local income ($71k/yr) — at the standard rent-burdened threshold; future hikes will face affordability resistance.
Forward outlook
- Local home prices are declining (-3.0%/yr); year-one equity from $2k of loan paydown is wiped out by about $7k of value loss. Plan a longer hold.
- Jefferson County population projected at +13% by 2050 — modest demand growth; plan on rents tracking national, not racing it.
Negotiation context
- It's been on market 69 days — a 6% lower offer ($207k) is reasonable based on typical stale-listing flexibility.
- 3 sale attempts since 7y ago; this cycle's ask has dropped $30k (12%) from the opening price — seller is motivated, your offer sets the floor, not the list.
Risks & watch-outs
- Watch-outs: built in 1905 — expect roof / HVAC / electrical / plumbing capex.
- Climate carrying-cost: extreme-heat days projected 7→20/yr by 2055 (HVAC capex compounding) — expect insurance premiums to compound above CPI over the hold.
Questions for the listing agent
- It's been on market 69 days. Have you received any prior offers? Is the seller open to a 6% concession, seller financing, or rate buy-down credit?
- Can we see the unit-by-unit rent roll, current vacancy, and any below-market leases? What's the average tenancy length?
- What capital expenditures (roof, boiler, parking lot, exteriors) have been made in the last 5 years, and what's planned in the next 2?
- Built in 1905 — when were the roof, HVAC, electrical panel, plumbing, and water heater last replaced?
- Why hasn't it sold? Are there any deal-killer items the seller is aware of (foundation, flood, title, zoning, code violations)?
- Is there a deadline driving the sale (1031 exchange, divorce, estate, relocation)? That informs how much negotiation room exists.
- Schools are D-rated, which usually means shorter tenancies and higher turnover. Who's the typical renter profile here, and what's been the actual vacancy rate?
- Crime grade is F in this area — have there been break-ins, vandalism, or insurance claims at this property in the last 3 years? What carrier currently insures it and at what premium?
- What's the average days-on-market for RENTAL listings here right now (not sales)? A rising rental-DOM trend means longer vacancies and softer asking-rent achievability than the comps imply.
- What's the recent tenant-quality profile in this submarket — average credit score on applications, eviction rate, late-payment / NSF rate, and stable-employment percentage? A property-management company in the area should have these aggregated.
- How much new apartment / multifamily construction is in the pipeline within 1–3 miles? Heavy new supply (>2% of stock underway) typically softens rents 12–24 months out; light construction supports rent growth.
Investment metrics
- 1% rule
- 1.03% ✓
- Cap rate
- 7.92%
- Cash-on-cash
- 5.81%
- DSCR
- 1.26
- GRM
- 8.1
CMA / ARV
No comps found within radius.
Projected returns pro-forma
-3.0% appreciation · 5.76% rent growth · sell at horizon
- IRR
- -4.3%
- Equity multiple
- 0.84×
- Total profit
- $-10,157
- Equity at exit
- $32,803
- IRR
- 8.3%
- Equity multiple
- 1.71×
- Total profit
- $43,812
- Equity at exit
- $19,022
Cash invested: $61,600 (down + closing). Projections, not guarantees.
Landlord ↔ Tenant lean methodology
- Overall (STATE)
- 83 Strongly Landlord-Friendly
- State Kentucky
- 83 Strongly Landlord-Friendly · R+16
- County
- — inherits STATE
- City
- — inherits STATE
ZIP-level market 40204
- Rents YoY
- 5.8%
- Active inventory
- 99
- Price-to-rent
- 16.2×
Monthly cashflow live
- Estimated rent
- $2,269 high interval (Pro) →
- Mortgage (P&I)
- −$1,154
- Tax from tax record
- −$249 /mo · $2,986/yr
- Insurance
- −$92
- HOA
- −$0
- Vacancy / Maint / Mgmt
- −$476
- Net cashflow
- $298
Break-even live
2-unit breakdown (identical units grouped — click to expand)
| Units | Beds | Baths | Est. rent |
|---|---|---|---|
| 2× units | 1 | 1 | $2,270 |
| #1 | 1 | 1 | $1,135 |
| #2 | 1 | 1 | $1,135 |
| Total (2 units) | $2,269 | ||
UW: 25.0% down · 7.5% · 30yr · 1.5% tax · 5.0% vac · 8.0% maint · 8.0% mgmt
Financing live
Cash to close
- Down payment
- $55,000
- Closing costs
- $6,600
- Reserves months
- —
- Total cash needed
- —
Loan-product check · same deal, 3 products live
Conventional
25% down · 7.5% · 30yr
- Down + closing
- —
- Monthly P&I
- —
- Monthly cashflow
- —
- DSCR
- —
- Eligible?
- —
Personal DTI + credit; lowest rate.
DSCR
20% down · 8.5% · 30yr
- Down + closing
- —
- Monthly P&I
- —
- Monthly cashflow
- —
- DSCR
- —
- Eligible?
- —
No personal income docs; deal must DSCR.
Hard money
10% down · 12.0% · 12mo
- Down + closing
- —
- Monthly P&I
- —
- Monthly cashflow
- —
- DSCR
- —
- Eligible?
- —
Short-term bridge; refi at stabilization.
Rent comps 6 comps
| Address | Beds | Baths | Sqft | Rent | $/sqft | DOM | Units | Dist |
|---|---|---|---|---|---|---|---|---|
| 1667 Richmond Dr Louisville, KY | 3.0 | 1.5 | 1462 | $2,600 | $1.78 | 14d | 1 | 0.64mi |
| 1061 Cherokee Rd Unit 1061-2 Louisville, KY | 3.0 | 2.0 | 1700 | $1,995 | $1.17 | 24d | 1 | 0.79mi |
| 1916 Yale Dr Louisville, KY | 3.0 | 1.0 | 1400 | $2,395 | $1.71 | 24d | 1 | 1.12mi |
| 1046 Charles St Louisville, KY | 3.0 | 1.0 | 1400 | $2,200 | $1.57 | 16d | 1 | 1.26mi |
| 2103 Wrocklage Ave Louisville, KY | 3.0 | 2.0 | 1798 | $3,100 | $1.72 | 16d | 1 | 1.30mi |
| 1014 Goss Ave Louisville, KY | 3.0 | 2.0 | 1534 | $1,650 | $1.08 | 3d | 1 | 1.39mi |
Listing history 10 events
-
2026-04-16status Pending
-
2026-03-24status Active
-
2026-03-16historical Active Under Contract
-
2026-03-14price $220,000
-
2026-02-06$249,900 Active
-
2019-09-10soldstatus $200,000
-
2019-08-30soldstatus $200,000 Closed 189-char remark
Show marketing remark (189 chars)
Home currently Duplex. Currently rented with signed one year lease. Owner occupies Unit 1. Property being sold as is. Has been owned by same owner for 28 years and rented most of those.
-
2019-06-24historical Active Under Contract 189-char remark
Show marketing remark (189 chars)
Home currently Duplex. Currently rented with signed one year lease. Owner occupies Unit 1. Property being sold as is. Has been owned by same owner for 28 years and rented most of those.
-
2019-05-31price $209,777 189-char remark
Show marketing remark (189 chars)
Home currently Duplex. Currently rented with signed one year lease. Owner occupies Unit 1. Property being sold as is. Has been owned by same owner for 28 years and rented most of those.
-
2019-05-29$225,000 Active 189-char remark
Show marketing remark (189 chars)
Home currently Duplex. Currently rented with signed one year lease. Owner occupies Unit 1. Property being sold as is. Has been owned by same owner for 28 years and rented most of those.
ⓘ Source: listings_history table (triggers on properties + properties_extension) + one-shot
backfill from property_details.listing_events for pre-trigger history.
Tax reassessment forecast KY · Resets to sale price
- Current annual tax
- $2,986 · $249/mo
- Projected year-2 tax
- $2,986 · $249/mo
- Expected delta
- $0/yr ($0/mo · 0.0%)
ⓘ Screening estimate from a state-policy table — verify with the county assessor before closing.
Climate risk First Street
- Flood 1/10 Low FEMA zone X (unshaded) · 0% chance over 30 yrs
- Wildfire 1/10 Low
- Heat 5/10 Major 7 d/yr ≥104°F today · 20 d/yr by 30 yrs out
- Wind 2/10 Low 2% chance of damaging wind over 30 yrs
- Air quality 3/10 Moderate 3 unhealthy d/yr today · 5 by 30 yrs out
Nearby sold comps map
Loading sold comps map…
Walkable amenities ~0.75 mi
Loading nearby amenities…
Taxation est. · year 1
- Rental income
- $27,228
- − Mortgage interest
- −$12,323
- − Property taxes
- −$2,986
- − Insurance
- −$1,100
- − Repairs & maintenance
- −$2,178
- − Management
- −$2,178
- − Depreciation
- −$6,400
- Taxable income
- $62
- Est. tax owed @ 24.0%
- −$15
- After-tax cash flow
- $3,565/yr
For passive investors: Depreciation is non-cash, so a rental often shows a tax loss while cash-flowing — sheltering income. Rental losses are passive: they offset passive income freely, and up to $25,000/yr can offset ordinary (W-2) income if you actively participate and your MAGI is under $100k (phasing out to $0 by $150k); unused losses carry forward. On sale, claimed depreciation is recaptured at up to 25%, and gains may owe capital-gains tax (a 1031 exchange can defer both). Figures are a year-1 estimate at your 24.0% rate — not tax advice; consult a CPA.
Schools (NCES district)
- District
- Jefferson County
- NCES district ID
- 2102990
- Math proficiency
- 19% ▼ -17.00%
- Reading proficiency
- 35% ▼ -11.00%
- Median HH income
- $47,885
- Composite
- 23.45/100
- National rank
- #7884
- State rank
- #121 of 165 in KY
Livability — Louisville
- Score
- 63/100
- State rank
- #333
- US rank
- #15887
Category grades
Schools grade is shown separately in the Schools card above.
Census & demographics
- Census place
- Louisville, KY
- County
- Jefferson County · 790,184 people
- City population
- 769,292
- Metro
- Louisville/Jefferson County, KY-IN
- Population (ZIP)
- 14,034
- Household income
- $71,116
- Rent vs Own
- Severe rent burden
- 761.0
Population outlook (Jefferson County) Hauer SSP2
- Today (2025)
- 823,112 people
- By 2030
- 849,343 · +3.2%
- By 2040
- 895,696 · +8.8%
- By 2050
- 933,630 · +13.4%
- By 2075
- 1,028,262 · +24.9%
- By 2100
- 1,072,675 · +30.3%
Race, ethnicity, and origin ACS 2023
- Neighborhood character
- Predominantly White (84%)
- Race & ethnicity
- White 84% Black 6% Two or more races 5% Hispanic / Latino 4% Asian 2%
- Common ancestry
- Slovak 3% Serbian 3% Romanian 3%
- Foreign-born
- 4% · Canada, South Korea, China
- Languages at home
- 95% English-only · Spanish 2% Korean 1% Chinese 1%
Political lean MEDSL · Jefferson
- 2024 margin
- D (+16.6) · D 57.4% · R 40.9% · Other 1.7%
- 2008→2024 swing
- +4.5pp toward D · 2008: 12.0pp · 2024: 16.6pp
- All cycles
- 2024: D+16.6 2020: D+20.1 2016: D+13.3 2012: D+11.1 2008: D+12.0
Not yet ingested
- Civics
- —
Market trends
- HPI YoY
- ▼ -475.25%
- Current HPI
- 246.3191
- Rent YoY
- ▲ 5.76%
- Metro
- Louisville/Jefferson County, KY-IN
- State GDP YoY
- ▲ 1.81%
- F500 in state
- 4
Industry mix (Fortune 500 HQ in KY)
| Industry | F500 HQs | Revenue |
|---|---|---|
| Healthcare | 1 | $118B |
|
||
| Food / Beverage | 1 | $7B |
|
||
Price history
-2.2% since first listed10 events — show timeline
- 2026-04-16 Pending — Metro Search MLS
- 2026-03-24 Relisted — Metro Search MLS
- 2026-03-16 Contingent — Metro Search MLS
- 2026-03-14 Price Changed $220,000 Metro Search MLS
- 2026-02-06 Listed $249,900 Metro Search MLS
- 2019-09-10 Sold (Public Records) $200,000 Public Records
- 2019-08-30 Sold (MLS) $200,000 Metro Search MLS
- 2019-06-24 Contingent — Metro Search MLS
- 2019-05-31 Price Changed $209,777 Metro Search MLS
- 2019-05-29 Listed $225,000 Metro Search MLS
Property tax history
+5.1%/yrLatest (2025): $2,986 · -1.9% YoY. Source: county tax records.
Cash-flow waterfall
monthlySold comps — $/sqft
last 12 mo · ≤1 miLoading sold comps…