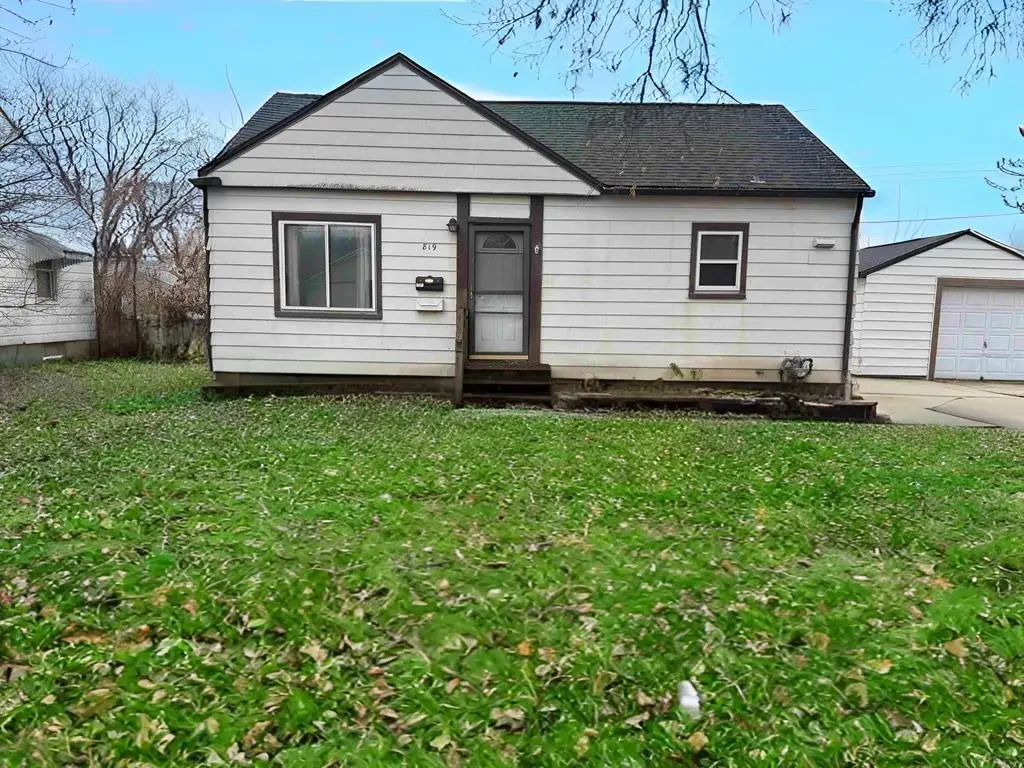
819 Hanna Blvd · Waterloo, IA
Flood risk 1/10 · Minimal
- FEMA flood zone
- X (unshaded)
- Chance of flooding over 30 yrs
- 0.0%
- Est. flood insurance / yr
- $473 – $860
Fire risk 2/10 · Minimal
- Est. fire insurance / yr
- $902 – $1,676
Heat risk 3/10 · Minor
- Hot days now (above 101°F)
- 7 days/yr
- Hot days in 30 yrs
- 15 days/yr
Wind risk 2/10 · Minimal
- Chance of severe wind over 30 yrs
- —
Air-quality risk 1/10 · Minimal
- Unhealthy air days now
- 0 days/yr
- Unhealthy air days in 30 yrs
- 0 days/yr
Risk factors via First Street. Map © Google.
Why this score? — see what drove the C- grade
The composite is a weighted blend of 9 inputs, each scored 0–100. Each bar is that input's sub-score; the figure is the points it added to the 100-point composite (weight × sub-score).
- Cash flow +16.3/30.0
- ARV discount +14.3/15.0
- DSCR +5.0/10.0
- 1% rule +4.8/10.0
- Schools +4.4/10.0
- Livability +4.0/5.0
- Rent growth +3.5/5.0
- Condition / age +2.5/5.0
- Appreciation +0.0/10.0
$136,900
🖨 Deal sheet 📄 Offer letter ✓ Due diligence
Listing remarks MLS
Welcome to 819 Hanna Blvd in Waterloo! This charming 1,164 sq ft ranch offers 3 bedrooms on the main level with an additional bedroom in the lower level, providing great flexibility for guests, an office, or extra living space. The home features a comfortable layout, a bright living area, and plenty of room to make it your own. With an attached 1-stall garage and a convenient location, this property is a great affordable option for many buyers!
Key facts
- 7,770 sq ft lot
- Garage
- Built 1947
Neighborhood map
What this means for you Summary
Snapshot
- This is a 4-bed/1.0-bath single-family listed at $137k.
Deal economics
- At list price, monthly cash flow is $75 ($894/yr) — positive.
- The deal already cash-flows at list — no discount required.
- To meet the 1% rule (rent ≥ 1% of price), the offer needs to be $134k (1.9% below list).
- Recommended offer: $134k (1.9% below list) — sets the bar for 1% rule.
- Cap rate 6.9% vs local median 4.2% in Waterloo — top-decile yield for the area; either an underpriced asset or a hidden risk that comps aren't pricing in. Stress-test before assuming the spread holds.
Location & tenants
- Location reads 81/100 on livability (#74 in IA, #1,589 nationally) — a professional / high-income tenant draw. Strengths: commute A+, cost of living A+, housing A+; Watch: schools C-, crime F, employment D-.
- Waterloo Community School District (urban): math 50% / reading 54% proficiency, ranked #276 of 289 in IA (top 96%) — acceptable for families but not a draw, mixed tenant base, ~2y average lease.
- Market conditions: Rents rising (+3.8%/yr); 282 active listings in the ZIP; 5 comparable units currently listed for rent nearby; rentals lingering (median 44d on market — plan ~5-8 weeks vacancy on turnover, expect pricing pressure); 60% of comp listings sitting > 30 days — soft ceiling on asking rent; 287 units permitted in Black Hawk County in 2024 (67 in 5+ unit buildings).
Forward outlook
- Local home prices are declining (-3.0%/yr); year-one equity from $946 of loan paydown is wiped out by about $4k of value loss. Plan a longer hold.
- Black Hawk County population projected at +10% by 2050 — modest demand growth; plan on rents tracking national, not racing it.
Negotiation context
- It's been on market 18 days — a 2% lower offer ($135k) is reasonable based on typical stale-listing flexibility.
Risks & watch-outs
- Watch-outs: built in 1947 — expect roof / HVAC / electrical / plumbing capex.
Questions for the listing agent
- Built in 1947 — when were the roof, HVAC, electrical panel, plumbing, and water heater last replaced?
- Is there a deadline driving the sale (1031 exchange, divorce, estate, relocation)? That informs how much negotiation room exists.
- Crime grade is F in this area — have there been break-ins, vandalism, or insurance claims at this property in the last 3 years? What carrier currently insures it and at what premium?
- What's the average days-on-market for RENTAL listings here right now (not sales)? A rising rental-DOM trend means longer vacancies and softer asking-rent achievability than the comps imply.
- What's the recent tenant-quality profile in this submarket — average credit score on applications, eviction rate, late-payment / NSF rate, and stable-employment percentage? A property-management company in the area should have these aggregated.
- How much new for-sale + rental construction is in the pipeline within 1–3 miles? Heavy new supply typically softens prices + rents 12–24 months out; constrained supply supports both.
Investment metrics
- 1% rule
- 0.98% ✗
- Cap rate
- 6.95%
- Cash-on-cash
- 2.33%
- DSCR
- 1.10
- GRM
- 8.5
CMA / ARV
- ARV (median comp)
- $161,186
- List price
- $136,900
- Delta
- -15.07%
- Verdict
- UNDERPRICED
- Comps
- 20 within 1.0 mi
Show comp detail 12 sales within ~0.75 mi
| Address | Dist | Beds/Ba | Sqft | Sold | Price | $/sf | Match |
|---|---|---|---|---|---|---|---|
| 640 Maxwell St | 0.18mi | 4/1.0 | 1,168 (+5%) | 7mo | $152,000 | $130 | 78 |
| 1742 Sager Ave | 0.37mi | 3/1.0 (-1) | 1,114 (0%) | 4mo | $195,000 | $175 | 74 |
| 520 Hanna Blvd | 0.29mi | 3/1.0 (-1) | 1,088 (-2%) | 5mo | $180,000 | $165 | 74 |
| 1266 Doreen Ave | 0.41mi | 4/2.0 | 1,140 (+2%) | 1mo | $191,000 | $168 | 72 |
| 401 Ardmore St | 0.44mi | 3/1.0 (-1) | 1,050 (-6%) | 12mo | $109,900 | $105 | 55 |
| 725 Harwood Ave | 0.43mi | 3/2.0 (-1) | 1,183 (+6%) | 7mo | $187,000 | $158 | 55 |
| 1316 Garden Ave | 0.56mi | 3/1.0 (-1) | 1,040 (-7%) | 10mo | $80,000 | $77 | 50 |
| 514 Woodbridge St | 0.32mi | 3/1.0 (-1) | 1,268 (+14%) | 9mo | $186,000 | $147 | 50 |
| 724 Kirkwood Ave | 0.47mi | 3/1.0 (-1) | 972 (-13%) | 6mo | $170,250 | $175 | 47 |
| 2123 Downing Ave | 0.72mi | 3/1.0 (-1) | 1,162 (+4%) | 11mo | $181,900 | $157 | 45 |
| 432 Auburn St | 0.36mi | 3/2.0 (-1) | 1,271 (+14%) | 8mo | $160,000 | $126 | 44 |
| 634 Englewood Ave | 0.73mi | 3/1.5 (-1) | 1,016 (-9%) | 12mo | $60,000 | $59 | 35 |
Match score weights: distance 35% · size 25% · config 20% · recency 20%. Top-matched comps best support the ARV.
Projected returns pro-forma
-3.0% appreciation · 3.8% rent growth · sell at horizon
- IRR
- -11.6%
- Equity multiple
- 0.57×
- Total profit
- $-16,304
- Equity at exit
- $20,412
- IRR
- -1.2%
- Equity multiple
- 0.91×
- Total profit
- $-3,361
- Equity at exit
- $11,837
Cash invested: $38,332 (down + closing). Projections, not guarantees.
Landlord ↔ Tenant lean methodology
- Overall (STATE)
- 83 Strongly Landlord-Friendly
- State Iowa
- 83 Strongly Landlord-Friendly · R+6
- County
- — inherits STATE
- City
- — inherits STATE
ZIP-level market 50701
- Rents YoY
- 3.8%
- Active inventory
- 282
- Price-to-rent
- 8.5×
Monthly cashflow live
- Estimated rent
- $1,342 high interval (Pro) →
- Mortgage (P&I)
- −$718
- Tax from tax record
- −$211 /mo · $2,532/yr
- Insurance
- −$57
- HOA
- −$0
- Vacancy / Maint / Mgmt
- −$282
- Net cashflow
- $75
Break-even live
UW: 25.0% down · 7.5% · 30yr · 1.5% tax · 5.0% vac · 8.0% maint · 8.0% mgmt
Financing live
Cash to close
- Down payment
- $34,225
- Closing costs
- $4,107
- Reserves months
- —
- Total cash needed
- —
Loan-product check · same deal, 3 products live
Conventional
25% down · 7.5% · 30yr
- Down + closing
- —
- Monthly P&I
- —
- Monthly cashflow
- —
- DSCR
- —
- Eligible?
- —
Personal DTI + credit; lowest rate.
DSCR
20% down · 8.5% · 30yr
- Down + closing
- —
- Monthly P&I
- —
- Monthly cashflow
- —
- DSCR
- —
- Eligible?
- —
No personal income docs; deal must DSCR.
Hard money
10% down · 12.0% · 12mo
- Down + closing
- —
- Monthly P&I
- —
- Monthly cashflow
- —
- DSCR
- —
- Eligible?
- —
Short-term bridge; refi at stabilization.
Rent comps 5 comps
| Address | Beds | Baths | Sqft | Rent | $/sqft | DOM | Units | Dist |
|---|---|---|---|---|---|---|---|---|
| 1115 Doreen Ave Unit 1120-3 Waterloo, IA | 3.0 | 1.0 | 865 | $890 | $1.03 | 44d | 1 | 0.24mi |
| 425 Auburn St Waterloo, IA | 3.0 | 1.0 | 983 | $1,450 | $1.48 | 44d | 1 | 0.36mi |
| 1247 Doreen Ave Waterloo, IA | 4.0 | 1.0 | 1288 | $1,500 | $1.16 | 21d | 1 | 0.38mi |
| 2215 Falls Ave Waterloo, IA | 3.0 | 1.0 | 1290 | $1,400 | $1.09 | 44d | 1 | 0.49mi |
| 2539 W 3rd St Waterloo, IA | 3.0 | 2.5 | 1200 | $1,695 | $1.41 | 21d | 1 | 1.16mi |
Listing history 18 events
-
2026-06-19days on market $136,900 Active 18 DOM
-
2026-06-18days on market $136,900 Active 17 DOM
-
2026-06-17days on market $136,900 Active 16 DOM
-
2026-06-16days on market $136,900 Active 15 DOM
-
2026-06-15days on market $136,900 Active 14 DOM
-
2026-06-14days on market $136,900 Active 12 DOM
-
2026-06-13days on market $136,900 Active 11 DOM
-
2026-06-10days on market $136,900 Active 9 DOM
-
2026-06-09days on market $136,900 Active 8 DOM
-
2026-06-08days on market $136,900 Active 7 DOM
-
2026-06-07days on market $136,900 Active 6 DOM
-
2026-06-05days on market $136,900 Active 3 DOM
-
2026-06-03days on market $136,900 Active 2 DOM
-
2026-06-02days on market $136,900 Active 1 DOM
-
2026-05-31days on market $136,900 Active 193 DOM
-
2026-05-30days on market $136,900 Active 192 DOM
-
2026-02-19price $136,900 448-char remark
Show marketing remark (448 chars)
Welcome to 819 Hanna Blvd in Waterloo! This charming 1,164 sq ft ranch offers 3 bedrooms on the main level with an additional bedroom in the lower level, providing great flexibility for guests, an office, or extra living space. The home features a comfortable layout, a bright living area, and plenty of room to make it your own. With an attached 1-stall garage and a convenient location, this property is a great affordable option for many buyers!
-
2025-11-19$139,900 Active 448-char remark
Show marketing remark (448 chars)
Welcome to 819 Hanna Blvd in Waterloo! This charming 1,164 sq ft ranch offers 3 bedrooms on the main level with an additional bedroom in the lower level, providing great flexibility for guests, an office, or extra living space. The home features a comfortable layout, a bright living area, and plenty of room to make it your own. With an attached 1-stall garage and a convenient location, this property is a great affordable option for many buyers!
ⓘ Source: listings_history table (triggers on properties + properties_extension) + one-shot
backfill from property_details.listing_events for pre-trigger history.
Tax reassessment forecast IA · Partial reset (capped growth)
- Current annual tax
- $2,532 · $211/mo
- Projected year-2 tax
- $2,532 · $211/mo
- Expected delta
- $0/yr ($0/mo · 0.0%)
ⓘ Screening estimate from a state-policy table — verify with the county assessor before closing.
Climate risk First Street
- Flood 1/10 Low FEMA zone X (unshaded) · 0% chance over 30 yrs
- Wildfire 2/10 Low
- Heat 3/10 Moderate 7 d/yr ≥101°F today · 15 d/yr by 30 yrs out
- Wind 2/10 Low
- Air quality 1/10 Low 0 unhealthy d/yr today · 0 by 30 yrs out
Nearby sold comps map
Loading sold comps map…
Walkable amenities ~0.75 mi
Loading nearby amenities…
Taxation est. · year 1
- Rental income
- $16,109
- − Mortgage interest
- −$7,669
- − Property taxes
- −$2,532
- − Insurance
- −$684
- − Repairs & maintenance
- −$1,289
- − Management
- −$1,289
- − Depreciation
- −$3,983
- Taxable loss
- −$1,336
- Est. tax savings @ 24.0%
- +$321
- After-tax cash flow
- $1,215/yr
For passive investors: Depreciation is non-cash, so a rental often shows a tax loss while cash-flowing — sheltering income. Rental losses are passive: they offset passive income freely, and up to $25,000/yr can offset ordinary (W-2) income if you actively participate and your MAGI is under $100k (phasing out to $0 by $150k); unused losses carry forward. On sale, claimed depreciation is recaptured at up to 25%, and gains may owe capital-gains tax (a 1031 exchange can defer both). Figures are a year-1 estimate at your 24.0% rate — not tax advice; consult a CPA.
Schools (NCES district)
- District
- Waterloo Community School District
- NCES district ID
- 1930480
- Math proficiency
- 50% ▼ -4.00%
- Reading proficiency
- 54% ▲ 1.00%
- Median HH income
- $42,545
- Composite
- 43.72/100
- National rank
- #2950
- State rank
- #276 of 289 in IA
Livability — Waterloo
- Score
- 81/100
- State rank
- #74
- US rank
- #1589
Category grades
Schools grade is shown separately in the Schools card above.
Census & demographics
- Census place
- Waterloo, IA
- County
- Black Hawk County · 112,933 people
- City population
- 69,066
- Metro
- Waterloo-Cedar Falls, IA
- Population (ZIP)
- 30,232
- Household income
- $61,475
- Rent vs Own
- Severe rent burden
- 1377.0
Population outlook (Black Hawk County) Hauer SSP2
- Today (2025)
- 139,716 people
- By 2030
- 142,853 · +2.2%
- By 2040
- 147,843 · +5.8%
- By 2050
- 153,247 · +9.7%
- By 2075
- 167,977 · +20.2%
- By 2100
- 177,320 · +26.9%
Race, ethnicity, and origin ACS 2023
- Neighborhood character
- Predominantly White (78%)
- Race & ethnicity
- White 78% Black 11% Two or more races 5% Hispanic / Latino 3% Asian 3%
- Common ancestry
- Portuguese 3% Italian 3% American 2%
- Foreign-born
- 7% · Canada, South Korea, Vietnam
- Languages at home
- 92% English-only · Russian/Polish/Slavic 2% Spanish 2% French/Haitian/Cajun 2%
Political lean MEDSL · Black Hawk
- 2024 margin
- Toss-up / Even · D 50.0% · R 48.8% · Other 1.2%
- 2008→2024 swing
- -21.3pp toward R · 2008: 22.4pp · 2024: 1.2pp
- All cycles
- 2024: D+1.2 2020: D+9.0 2016: D+7.3 2012: D+20.0 2008: D+22.4
Not yet ingested
- Civics
- —
Market trends
- HPI YoY
- ▼ -107.19%
- Current HPI
- 162.8951
- Rent YoY
- ▲ 3.80%
- Metro
- Waterloo-Cedar Falls, IA
- State GDP YoY
- ▲ 2.48%
- F500 in state
- 4
Industry mix (Fortune 500 HQ in IA)
| Industry | F500 HQs | Revenue |
|---|---|---|
| Financial Services | 1 | $16B |
|
||
| Retail / Convenience | 1 | $15B |
|
||
Price history
-2.1% since first listed2 events — show timeline
- 2026-02-19 Price Changed $136,900 NEIRBR as distributed by MLS GRID
- 2025-11-19 Listed $139,900 NEIRBR as distributed by MLS GRID
Property tax history
+2.2%/yrLatest (2025): $2,532 · +8.6% YoY. Source: county tax records.
Cash-flow waterfall
monthlySold comps — $/sqft
last 12 mo · ≤1 miLoading sold comps…