1824 W Madison St · Brownsville, TX
Flood risk 7/10 · Major
- FEMA flood zone
- AH
- Chance of flooding over 30 yrs
- 0.99%
- Est. flood insurance / yr
- $1,142 – $2,507
Fire risk 1/10 · Minimal
- Est. fire insurance / yr
- $1,222 – $2,270
Heat risk 9/10 · Severe
- Hot days now (above 111°F)
- 7 days/yr
- Hot days in 30 yrs
- 26 days/yr
Wind risk 9/10 · Severe
- Chance of severe wind over 30 yrs
- 99.0%
Air-quality risk 3/10 · Minor
- Unhealthy air days now
- 2 days/yr
- Unhealthy air days in 30 yrs
- 3 days/yr
Risk factors via First Street. Map © Google.
Why this score? — see what drove the C grade
The composite is a weighted blend of 9 inputs, each scored 0–100. Each bar is that input's sub-score; the figure is the points it added to the 100-point composite (weight × sub-score).
- Cash flow +28.5/30.0
- DSCR +10.0/10.0
- 1% rule +7.1/10.0
- Rent growth +5.0/5.0
- Livability +4.0/5.0
- Condition / age +2.5/5.0
- Schools +2.2/10.0
- ARV discount +0.0/15.0
- Appreciation +0.0/10.0
$150,000
🖨 Deal sheet 📄 Offer letter ✓ Due diligence
Listing remarks MLS
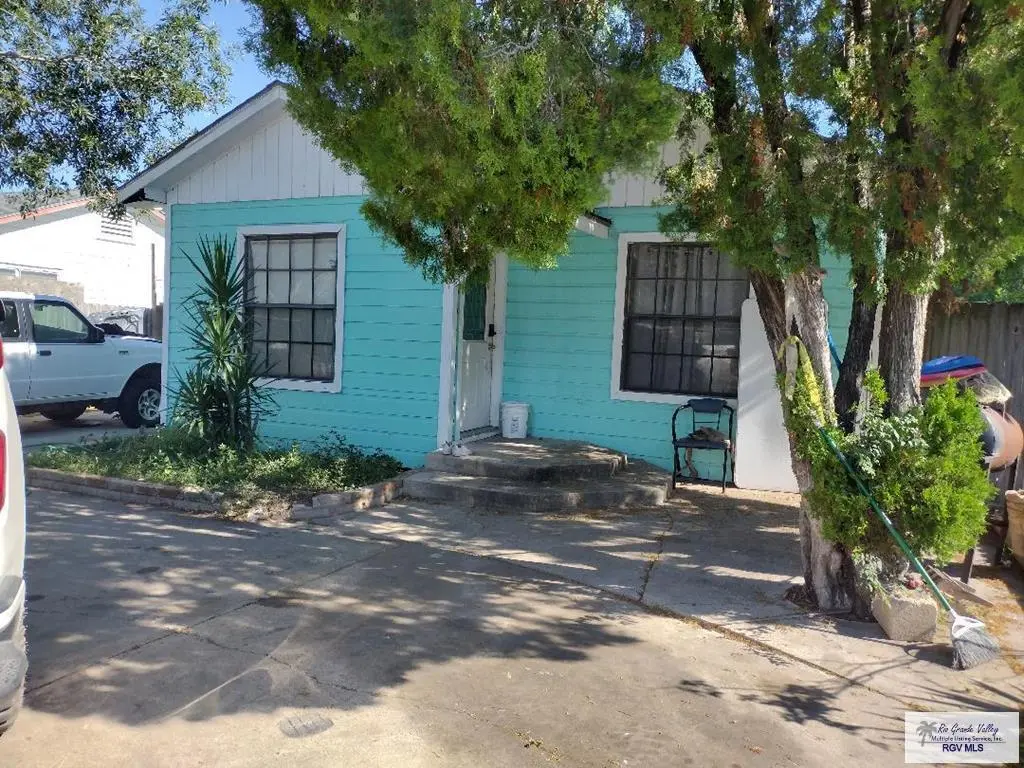
COSY BUT CUTE. HOME FEATURES 3BD/1BATH WITH AN ENCLOSED CARPORT THAT HAS PARTIAL PREPARATION FOR A 4 BD AND BATHROOM WITH 2 WALKIN CLOSETS, THAT NEEDS TO BE FINISHED OUT. PROPERTY HAS CIRCULAR DRIVEWAY WITH HURRICANE FENCE. BACKYARD IS SPACIOUS AND HAS A STORAGE SHED. HOME DOES NEED SMALL TLC.
Key facts
- 6,000 sq ft lot
- Built 1960
- Listed 43 days
Property features AI
Exterior
- Utilities: Public water; Public sewer
- Home design: Single family residence; One story
- Exterior features: Composition roof
Interior
- Flooring: Laminate flooring; Tile flooring
- Bathrooms: 2 full bathrooms
- Heating & cooling: Central heating; Electric heating; Central air conditioning
- Interior features: Electric water heater
Neighborhood map
What this means for you Summary
Snapshot
- This is a 4-bed/2.0-bath single-family listed at $150k.
Deal economics
- At list price, monthly cash flow is $339 ($4k/yr) — positive.
- The deal already cash-flows at list — no discount required.
- Meets the 1% rule at list price ($2k rent vs $150k).
- Recommended offer: $146k (3.0% below list) — sets the bar for market timing.
- Cap rate 10.2% vs local median 5.0% in Brownsville — top-decile yield for the area; either an underpriced asset or a hidden risk that comps aren't pricing in. Stress-test before assuming the spread holds.
Location & tenants
- Location reads 79/100 on livability (#62 in TX, #2,311 nationally) — a middle-class / working-renter tenant base. Strengths: commute A+, cost of living A+, housing A+; Watch: amenities D, crime D-, employment F.
- Brownsville ISD (urban): math 20% / reading 34% proficiency, ranked #710 of 826 in TX (top 86%) — low school quality limits family demand, transient renter base, plan for 1-2y turnover; 83% free/reduced lunch — lower-income household profile, screen leases tightly.
- Zoned schools: Skinner El (math 17% / reading 27%, grade F, #3,333 of 4,322 statewide, top 80%, 333 students, 99% FRL); Stell Middle (math 12% / reading 26%, grade F, #1,466 of 1,662 statewide, top 89%, 781 students, 96% FRL); Pace Early College H S (math 32% / reading 33%, grade F, #1,029 of 1,632 statewide, top 64%, 1,788 students, 92% FRL).
- Market conditions: Rents rising fast (+11.4%/yr); 346 active listings in the ZIP; 10 comparable units currently listed for rent nearby; rentals lingering (median 44d on market — plan ~5-8 weeks vacancy on turnover, expect pricing pressure); 50% of comp listings sitting > 30 days — soft ceiling on asking rent; 2,326 units permitted in Cameron County in 2024 (503 in 5+ unit buildings).
- This rent runs 43% of the median local income ($50k/yr) — at the standard rent-burdened threshold; future hikes will face affordability resistance.
Forward outlook
- Local home prices are declining (-3.0%/yr); year-one equity from $1k of loan paydown is wiped out by about $4k of value loss. Plan a longer hold.
- Cameron County population projected at +3% by 2050 — modest demand growth; plan on rents tracking national, not racing it.
- At projected returns (-3.0% appreciation + 8.0% rent growth), your $42k cash investment doubles in ~8 years — after that, you're playing with house money.
Negotiation context
- It's been on market 43 days — a 3% lower offer ($146k) is reasonable based on typical stale-listing flexibility.
- 3 sale attempts since 4y ago with the ask held roughly flat each time — persistent listings suggest the price (not the market) is what's stuck; bring a comps-based counter.
Risks & watch-outs
- Watch-outs: flood insurance adds $152/mo.
- Climate carrying-cost: in FEMA flood zone AH (mandatory federal flood insurance); severe wind risk, 99% chance of damaging wind over 30y; extreme-heat days projected 7→26/yr by 2055 (HVAC capex compounding) — expect insurance premiums to compound above CPI over the hold.
Questions for the listing agent
- It's been on market 43 days. Have you received any prior offers? Is the seller open to a 3% concession, seller financing, or rate buy-down credit?
- Built in 1960 — when were the roof, HVAC, electrical panel, plumbing, and water heater last replaced?
- What's the actual annual flood-insurance premium (NFIP or private), and is the property in a SFHA with mandatory coverage?
- Is there a deadline driving the sale (1031 exchange, divorce, estate, relocation)? That informs how much negotiation room exists.
- Crime grade is D in this area — have there been break-ins, vandalism, or insurance claims at this property in the last 3 years? What carrier currently insures it and at what premium?
- What's the average days-on-market for RENTAL listings here right now (not sales)? A rising rental-DOM trend means longer vacancies and softer asking-rent achievability than the comps imply.
- What's the recent tenant-quality profile in this submarket — average credit score on applications, eviction rate, late-payment / NSF rate, and stable-employment percentage? A property-management company in the area should have these aggregated.
- How much new for-sale + rental construction is in the pipeline within 1–3 miles? Heavy new supply typically softens prices + rents 12–24 months out; constrained supply supports both.
Investment metrics
- 1% rule
- 1.21% ✓
- Cap rate
- 10.22%
- Cash-on-cash
- 14.02%
- DSCR
- 1.62
- GRM
- 6.9
CMA / ARV
- ARV (median comp)
- $120,641
- List price
- $150,000
- Delta
- 24.34%
- Verdict
- OVERPRICED
- Comps
- 5 within 1.0 mi
Show comp detail 2 sales within ~0.75 mi
| Address | Dist | Beds/Ba | Sqft | Sold | Price | $/sf | Match |
|---|---|---|---|---|---|---|---|
| 344 Fairfax St | 0.30mi | 3/2.0 (-1) | 1,329 (+13%) | 21mo | $189,000 | $142 | 42 |
| 124 Calle Princesa St | 0.63mi | 3/2.0 (-1) | 1,125 (-5%) | 20mo | $125,000 | $111 | 41 |
Match score weights: distance 35% · size 25% · config 20% · recency 20%. Top-matched comps best support the ARV.
Projected returns pro-forma
-3.0% appreciation · 8.0% rent growth · sell at horizon
- IRR
- 4.0%
- Equity multiple
- 1.16×
- Total profit
- $6,910
- Equity at exit
- $22,365
- IRR
- 17.9%
- Equity multiple
- 2.85×
- Total profit
- $77,648
- Equity at exit
- $12,969
Cash invested: $42,000 (down + closing). Projections, not guarantees.
Landlord ↔ Tenant lean methodology
- Overall (STATE)
- 87 Strongly Landlord-Friendly
- State Texas
- 87 Strongly Landlord-Friendly · R+5
- County
- — inherits STATE
- City
- — inherits STATE
ZIP-level market 78520
- Home prices YoY
- -19.8%
- Rents YoY
- 11.4%
- Active inventory
- 346
- Price-to-rent
- 6.9×
Monthly cashflow live
- Estimated rent
- $1,813 high interval (Pro) →
- Mortgage (P&I)
- −$787
- Tax from tax record
- −$92 /mo · $1,104/yr
- Insurance
- −$62
- Flood insurance flood zone
- −$152 /mo · $1,824/yr
- HOA
- −$0
- Vacancy / Maint / Mgmt
- −$381
- Net cashflow
- $339
Break-even live
UW: 25.0% down · 7.5% · 30yr · 1.5% tax · 5.0% vac · 8.0% maint · 8.0% mgmt
Financing live
Cash to close
- Down payment
- $37,500
- Closing costs
- $4,500
- Reserves months
- —
- Total cash needed
- —
Loan-product check · same deal, 3 products live
Conventional
25% down · 7.5% · 30yr
- Down + closing
- —
- Monthly P&I
- —
- Monthly cashflow
- —
- DSCR
- —
- Eligible?
- —
Personal DTI + credit; lowest rate.
DSCR
20% down · 8.5% · 30yr
- Down + closing
- —
- Monthly P&I
- —
- Monthly cashflow
- —
- DSCR
- —
- Eligible?
- —
No personal income docs; deal must DSCR.
Hard money
10% down · 12.0% · 12mo
- Down + closing
- —
- Monthly P&I
- —
- Monthly cashflow
- —
- DSCR
- —
- Eligible?
- —
Short-term bridge; refi at stabilization.
Rent comps 10 comps
| Address | Beds | Baths | Sqft | Rent | $/sqft | DOM | Units | Dist |
|---|---|---|---|---|---|---|---|---|
| 34 W Hawthorne Ave Brownsville, TX | 3.0 | 2.0 | 940 | $1,400 | $1.49 | 43d | 1 | 0.21mi |
| 234 Emerald Ln Lot 4 Brownsville, TX | 3.0 | 2.0 | 1170 | $1,850 | $1.58 | 21d | 1 | 0.29mi |
| 234 Emerald Ln Lot 4 Brownsville, TX | 4.0 | 2.0 | 1170 | $1,850 | $1.58 | 13d | 1 | 0.29mi |
| 1904 Central Blvd Brownsville, TX | 1.0–3.0 | 1.0–2.0 | 1046 | $1,035 | $0.99 | 43d | 9 | 0.64mi |
| 15 Sunnyside Ln Brownsville, TX | 4.0 | 2.0 | 1436 | $2,000 | $1.39 | 13d | 1 | 0.89mi |
| 1405 Harvard Ave Brownsville, TX | 3.0 | 2.0 | 1426 | $1,700 | $1.19 | 43d | 1 | 1.10mi |
| 2425 Barnard Rd Unit ujnit 1-A Brownsville, TX | 3.0 | 1.5 | 1300 | $1,600 | $1.23 | 43d | 1 | 1.21mi |
| 1604 Yale Ave Brownsville, TX | 3.0 | 1.0 | 1316 | $1,800 | $1.37 | 21d | 1 | 1.28mi |
| 1618 E Los Ebanos Blvd Brownsville, TX | 3.0 | 2.0 | 1073 | $1,700 | $1.58 | 43d | 1 | 1.33mi |
| 1617 E Los Ebanos Blvd Brownsville, TX | 3.0 | 2.0 | 1179 | $1,900 | $1.61 | 21d | 1 | 1.34mi |
Listing history 23 events
-
2026-06-18days on market $150,000 Active 43 DOM
-
2026-06-17days on market $150,000 Active 42 DOM
-
2026-06-16days on market $150,000 Active 41 DOM
-
2026-06-15days on market $150,000 Active 40 DOM
-
2026-06-14days on market $150,000 Active 38 DOM
-
2026-06-13days on market $150,000 Active 37 DOM
-
2026-06-10days on market $150,000 Active 35 DOM
-
2026-06-09days on market $150,000 Active 34 DOM
-
2026-06-08days on market $150,000 Active 33 DOM
-
2026-06-07days on market $150,000 Active 32 DOM
-
2026-06-05days on market $150,000 Active 29 DOM
-
2026-06-03days on market $150,000 Active 28 DOM
-
2026-06-02days on market $150,000 Active 27 DOM
-
2026-06-01days on market $150,000 Active 26 DOM
-
2026-05-31days on market $150,000 Active 25 DOM
-
2026-05-30days on market $150,000 Active 24 DOM
-
2026-05-01$150,000 Active 188-char remark
-
2023-05-01soldstatus Closed 294-char remark
Show marketing remark (294 chars)
COSY BUT CUTE. HOME FEATURES 3BD/1BATH WITH AN ENCLOSED CARPORT THAT HAS PARTIAL PREPARATION FOR A 4 BD AND BATHROOM WITH 2 WALKIN CLOSETS, THAT NEEDS TO BE FINISHED OUT. PROPERTY HAS CIRCULAR DRIVEWAY WITH HURRICANE FENCE. BACKYARD IS SPACIOUS AND HAS A STORAGE SHED. HOME DOES NEED SMALL TLC.
-
2023-03-30status Pending 294-char remark
Show marketing remark (294 chars)
COSY BUT CUTE. HOME FEATURES 3BD/1BATH WITH AN ENCLOSED CARPORT THAT HAS PARTIAL PREPARATION FOR A 4 BD AND BATHROOM WITH 2 WALKIN CLOSETS, THAT NEEDS TO BE FINISHED OUT. PROPERTY HAS CIRCULAR DRIVEWAY WITH HURRICANE FENCE. BACKYARD IS SPACIOUS AND HAS A STORAGE SHED. HOME DOES NEED SMALL TLC.
-
2022-11-12status Active 294-char remark
Show marketing remark (294 chars)
COSY BUT CUTE. HOME FEATURES 3BD/1BATH WITH AN ENCLOSED CARPORT THAT HAS PARTIAL PREPARATION FOR A 4 BD AND BATHROOM WITH 2 WALKIN CLOSETS, THAT NEEDS TO BE FINISHED OUT. PROPERTY HAS CIRCULAR DRIVEWAY WITH HURRICANE FENCE. BACKYARD IS SPACIOUS AND HAS A STORAGE SHED. HOME DOES NEED SMALL TLC.
-
2022-10-20historical 294-char remark
Show marketing remark (294 chars)
COSY BUT CUTE. HOME FEATURES 3BD/1BATH WITH AN ENCLOSED CARPORT THAT HAS PARTIAL PREPARATION FOR A 4 BD AND BATHROOM WITH 2 WALKIN CLOSETS, THAT NEEDS TO BE FINISHED OUT. PROPERTY HAS CIRCULAR DRIVEWAY WITH HURRICANE FENCE. BACKYARD IS SPACIOUS AND HAS A STORAGE SHED. HOME DOES NEED SMALL TLC.
-
2022-10-19$110,000 Active 294-char remark
Show marketing remark (294 chars)
COSY BUT CUTE. HOME FEATURES 3BD/1BATH WITH AN ENCLOSED CARPORT THAT HAS PARTIAL PREPARATION FOR A 4 BD AND BATHROOM WITH 2 WALKIN CLOSETS, THAT NEEDS TO BE FINISHED OUT. PROPERTY HAS CIRCULAR DRIVEWAY WITH HURRICANE FENCE. BACKYARD IS SPACIOUS AND HAS A STORAGE SHED. HOME DOES NEED SMALL TLC.
-
2009-01-06soldstatus
ⓘ Source: listings_history table (triggers on properties + properties_extension) + one-shot
backfill from property_details.listing_events for pre-trigger history.
Tax reassessment forecast TX · Resets to sale price
- Current annual tax
- $1,104 · $92/mo
- Projected year-2 tax
- $2,745 · $229/mo
- Expected delta
- +$1,641/yr (+$137/mo · 148.6%)
ⓘ Screening estimate from a state-policy table — verify with the county assessor before closing.
Climate risk First Street
- Flood 7/10 Severe FEMA zone AH · 99% chance over 30 yrs
- Wildfire 1/10 Low
- Heat 9/10 Extreme 7 d/yr ≥111°F today · 26 d/yr by 30 yrs out
- Wind 9/10 Extreme 99% chance of damaging wind over 30 yrs
- Air quality 3/10 Moderate 2 unhealthy d/yr today · 3 by 30 yrs out
Nearby sold comps map
Loading sold comps map…
Walkable amenities ~0.75 mi
Loading nearby amenities…
Taxation est. · year 1
- Rental income
- $21,751
- − Mortgage interest
- −$8,402
- − Property taxes
- −$1,104
- − Insurance
- −$2,574
- − Repairs & maintenance
- −$1,740
- − Management
- −$1,740
- − Depreciation
- −$4,364
- Taxable income
- $1,826
- Est. tax owed @ 24.0%
- −$438
- After-tax cash flow
- $3,627/yr
For passive investors: Depreciation is non-cash, so a rental often shows a tax loss while cash-flowing — sheltering income. Rental losses are passive: they offset passive income freely, and up to $25,000/yr can offset ordinary (W-2) income if you actively participate and your MAGI is under $100k (phasing out to $0 by $150k); unused losses carry forward. On sale, claimed depreciation is recaptured at up to 25%, and gains may owe capital-gains tax (a 1031 exchange can defer both). Figures are a year-1 estimate at your 24.0% rate — not tax advice; consult a CPA.
Schools (NCES district)
- District
- Brownsville ISD
- NCES district ID
- 4811680
- Math proficiency
- 20% ▼ -36.00%
- Reading proficiency
- 34% ▼ -13.00%
- Median HH income
- $30,490
- Composite
- 21.8/100
- National rank
- #8249
- State rank
- #710 of 826 in TX
Livability — Brownsville
- Score
- 79/100
- State rank
- #62
- US rank
- #2311
Category grades
Schools grade is shown separately in the Schools card above.
Census & demographics
- Census place
- Brownsville, TX
- County
- Cameron County · 310,734 people
- City population
- 212,132
- Metro
- Brownsville-Harlingen, TX
- Population (ZIP)
- 64,740
- Household income
- $50,116
- Rent vs Own
- Severe rent burden
- 1800.0
Population outlook (Cameron County) Hauer SSP2
- Today (2025)
- 441,603 people
- By 2030
- 448,113 · +1.5%
- By 2040
- 456,385 · +3.3%
- By 2050
- 456,294 · +3.3%
- By 2075
- 423,851 · -4.0%
- By 2100
- 342,787 · -22.4%
Race, ethnicity, and origin ACS 2023
- Neighborhood character
- Predominantly Hispanic (93%)
- Race & ethnicity
- Hispanic / Latino 93% Two or more races 44% White 6%
- Hispanic origin (detail)
- Mexican 88%
- Foreign-born
- 26% · Canada
- Languages at home
- 18% English-only · Spanish 82%
Political lean MEDSL · Cameron
- 2024 margin
- Lean R (+5.8) · D 46.7% · R 52.5%
- 2008→2024 swing
- -34.6pp toward R · 2008: 28.8pp · 2024: -5.8pp
- All cycles
- 2024: R+5.8 2020: D+13.2 2016: D+32.5 2012: D+32.4 2008: D+28.8
Not yet ingested
- Civics
- —
Market trends
- HPI YoY
- ▼ -52.91%
- Current HPI
- 214.4335
- Rent YoY
- ▲ 11.41%
- Metro
- Brownsville-Harlingen, TX
- State GDP YoY
- ▲ 3.95%
- F500 in state
- 110
Industry mix (Fortune 500 HQ in TX)
| Industry | F500 HQs | Revenue |
|---|---|---|
| Energy | 16 | $1,198B |
|
||
| Technology | 5 | $198B |
|
||
| Engineering / Construction | 4 | $72B |
|
||
| Energy Services | 3 | $60B |
|
||
| Utilities | 3 | $41B |
|
||
| Healthcare | 2 | $330B |
|
||
Price history
+36.4% since first listed7 events — show timeline
- 2026-05-01 Listed $150,000 RGVMLS
- 2023-05-01 Sold (MLS) — RGVMLS
- 2023-03-30 Pending — RGVMLS
- 2022-11-12 Relisted — RGVMLS
- 2022-10-20 Delisted — RGVMLS
- 2022-10-19 Listed $110,000 RGVMLS
- 2009-01-06 Sold (Public Records) — Public Records
Property tax history
+6.1%/yrLatest (2025): $1,104 · -12.2% YoY. Source: county tax records.
Cash-flow waterfall
monthlySold comps — $/sqft
last 12 mo · ≤1 miLoading sold comps…