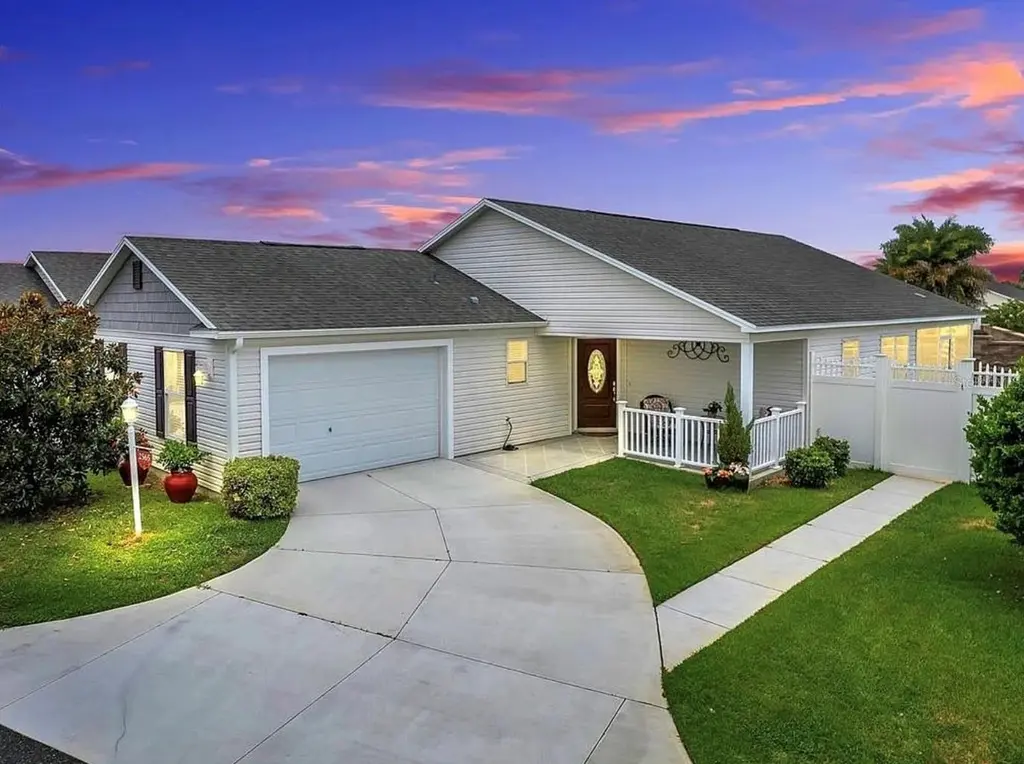
2565 Lindewood St · The Villages, FL
Flood risk 1/10 · Minimal
- FEMA flood zone
- X (unshaded)
- Chance of flooding over 30 yrs
- 0.0%
- Est. flood insurance / yr
- $507 – $1,088
Fire risk 3/10 · Minor
- Est. fire insurance / yr
- $947 – $1,759
Heat risk 9/10 · Severe
- Hot days now (above 108°F)
- 7 days/yr
- Hot days in 30 yrs
- 23 days/yr
Wind risk 9/10 · Severe
- Chance of severe wind over 30 yrs
- 99.0%
Air-quality risk 2/10 · Minimal
- Unhealthy air days now
- 1 days/yr
- Unhealthy air days in 30 yrs
- 2 days/yr
Risk factors via First Street. Map © Google.
Why this score? — see what drove the D+ grade
The composite is a weighted blend of 9 inputs, each scored 0–100. Each bar is that input's sub-score; the figure is the points it added to the 100-point composite (weight × sub-score).
- ARV discount +14.1/15.0
- Appreciation +10.0/10.0
- Cash flow +5.8/30.0
- Schools +5.2/10.0
- Livability +3.5/5.0
- Rent growth +2.5/5.0
- Condition / age +2.5/5.0
- 1% rule +1.6/10.0
- DSCR +0.2/10.0
$395,000
🖨 Deal sheet 📄 Offer letter ✓ Due diligence
Listing remarks MLS
This 3/2 Melrose ( Anna Maria ) courtyard villa is situated on a corner lot in the very desirable Village of Collier. Perry Villas is tucked away and quiet yet so close to Brownwood Paddock Square and Eisenhower Regional Rec Center. There are 3 community pools in the immediate vicinity as well as 3 Executive Golf Courses- all just a quick golf cart ride away. This home has been lovingly maintained by the seller. The spacious kitchen and open floor plan offers plenty of room for entertaining and socializing with your family and friends. There is no carpet in this home. There is ceramic tile in main living areas and primary bedroom. The 2 guest bedrooms with closets have laminate flooring. The screened lanai can be accessed through the dining or living room. Enjoy your very private outdoor space complete with a beautiful lemon tree. Room for swim ( cocktail ) spa. Now that's Florida living. There is very convenient neighborhood guest parking across the street. Home may be conveyed turnkey as separate package. Come see this home today! Call me for a private showing.
Key facts
- Premium corner lot
- En-suite bath
- Split-bedroom design
Tags
Property features AI
Finance
- Other: CDD present; Homestead status indicated; Property zoned R (residential)
- Financial info: Total annual HOA fees approximately $2,340
- HOA & community: Located in The Villages with required monthly association fee of $195; HOA amenities include clubhouse, fitness center, gated community, golf course access, park, playground, pool, recreation facilities, shuffleboard, tennis courts, and trails; Association fee includes 24-hour guard, common area taxes, pool, recreational facilities, and security
Exterior
- Parking: Attached 2-car garage with garage door opener; Golf cart parking
- Security: 24-hour guard and community security (provided through HOA)
- Utilities: Public water; Public sewer; Electricity connected; Water connected; Sewer connected; Cable connected; Sprinkler meter (reclaimed irrigation available)
- Home design: Single family residence; One story; Slab foundation; Vinyl siding; Shingle roof; Home faces west
- Construction: Vinyl siding construction; Shingle roof; Slab foundation
- Exterior features: Covered front and rear porches with screened patio; Patio and porch space; Masonry fencing; Rain gutters; Sprinkler meter; Gray water system; Irrigation equipment; Mature landscaping; Corner, landscaped, level and oversized lot; Near golf course, private setting on a paved dead-end street with sidewalk
Interior
- Kitchen: Dishwasher; Disposal; Microwave; Range; Refrigerator; Ice maker; Exhaust fan; Gas water heater
- Bedrooms: 3 bedrooms
- Flooring: Ceramic tile
- Bathrooms: 2 full bathrooms
- Heating & cooling: Central heating (heat pump); Central air conditioning
- Interior features: Cathedral ceilings; Tray and vaulted ceilings; High ceilings; Ceiling fans; Open floorplan with kitchen/family room combo; Living room/dining room combo; Eat-in kitchen; Solid wood cabinets; Stone counters; Thermostat; Walk-in closets; Window treatments
- Laundry & utility: Washer and dryer included; Laundry located in garage
Neighborhood map
What this means for you Summary
Snapshot
- This is a 3-bed/2.0-bath single-family listed at $395k.
Deal economics
- At list price, monthly cash flow is $-789 ($-9k/yr) — negative.
- To cash-flow at today's rent, offer at most $256k (35.3% below list).
- To meet the 1% rule (rent ≥ 1% of price), the offer needs to be $260k (34.2% below list).
- Recommended offer: $256k (35.3% below list) — sets the bar for cash-flow.
- Cap rate 3.9% vs local median 5.0% in The Villages — below-typical yield; the buyer is paying a premium for something (appreciation thesis, condition, location) that the cap rate doesn't capture.
Location & tenants
- Location reads 70/100 on livability (#431 in FL) — a middle-class / working-renter tenant base. Strengths: schools A+, crime A+, housing A; Watch: amenities F, commute F, health & safety F.
- Sumter (rural): math 61% / reading 61% proficiency, ranked #11 of 73 in FL (top 15%) — acceptable for families but not a draw, mixed tenant base, ~2y average lease.
- Market conditions: 265 active listings in the ZIP; 10 comparable units currently listed for rent nearby; rentals at typical pace (median 21d on market — plan ~3-4 weeks tenant-placement turnaround); solid renter incomes; 3,961 units permitted in Sumter County in 2024 (248 in 5+ unit buildings).
- This rent runs 32% of the median local income ($97k/yr) — at the standard rent-burdened threshold; future hikes will face affordability resistance.
Forward outlook
- In year one you build about $42k of equity ($3k loan paydown + $40k appreciation (10.0% local appreciation)).
- Sumter County population projected at +45% by 2050 — long-run rental-demand tailwind backs the buy-and-hold thesis.
- By year 2, paydown + projected appreciation supports a ~$68k cash-out refi (75% LTV) — recoverable capital for the next deal without selling this one.
Negotiation context
- Only 2 days on market — expect competitive offers; lowballing is unlikely to land.
- 2 sale attempts since 3y ago with the ask held roughly flat each time — persistent listings suggest the price (not the market) is what's stuck; bring a comps-based counter.
Risks & watch-outs
- Climate carrying-cost: severe wind risk, 99% chance of damaging wind over 30y; extreme-heat days projected 7→23/yr by 2055 (HVAC capex compounding) — expect insurance premiums to compound above CPI over the hold.
Questions for the listing agent
- What do current leases actually rent for vs. the listed asking? Can we see a recent rent roll and the last 12 months of T-12 income?
- What does the HOA fee cover, when was the last increase, and are there any pending special assessments or reserve-fund shortfalls?
- Is there a deadline driving the sale (1031 exchange, divorce, estate, relocation)? That informs how much negotiation room exists.
- Schools are A-rated — typically a magnet for longer-tenancy family renters. What's the average tenant stay here, and is there a school-zone premium baked into asking?
- The area grade is low — what's the realistic commute time and amenity access for the typical tenant pool here? Any planned neighborhood developments (good or bad) we should know about?
- What's the average days-on-market for RENTAL listings here right now (not sales)? A rising rental-DOM trend means longer vacancies and softer asking-rent achievability than the comps imply.
- What's the recent tenant-quality profile in this submarket — average credit score on applications, eviction rate, late-payment / NSF rate, and stable-employment percentage? A property-management company in the area should have these aggregated.
- How much new for-sale + rental construction is in the pipeline within 1–3 miles? Heavy new supply typically softens prices + rents 12–24 months out; constrained supply supports both.
Investment metrics
- 1% rule
- 0.66% ✗
- Cap rate
- 3.90%
- Cash-on-cash
- -8.56%
- DSCR
- 0.62
- GRM
- 12.7
CMA / ARV
- ARV (on-the-fly)
- $463,130
- Comps found
- 12
Show comp detail 12 sales within ~0.75 mi
| Address | Dist | Beds/Ba | Sqft | Sold | Price | $/sf | Match |
|---|---|---|---|---|---|---|---|
| 3563 Marianna Pl | 0.37mi | 3/2.0 | 1,608 (+1%) | 2mo | $465,000 | $289 | 80 |
| 3481 Oldham Ln | 0.44mi | 3/2.0 | 1,504 (-6%) | 2mo | $385,000 | $256 | 68 |
| 3497 Oldham Ln | 0.44mi | 3/2.0 | 1,695 (+6%) | 6mo | $479,900 | $283 | 64 |
| 3493 Habersham Ct | 0.39mi | 3/2.0 | 1,446 (-10%) | 6mo | $438,000 | $303 | 61 |
| 2932 Beadle Pl | 0.62mi | 3/2.0 | 1,473 (-8%) | 4mo | $440,000 | $299 | 55 |
| 3407 Melbourne Ln | 0.72mi | 3/2.0 | 1,559 (-2%) | 11mo | $394,000 | $253 | 53 |
| 3562 Farrell Ave | 0.66mi | 3/2.0 | 1,473 (-8%) | 4mo | $435,000 | $295 | 53 |
| 3459 Oldham Ln | 0.45mi | 3/2.0 | 1,446 (-10%) | 15mo | $420,000 | $290 | 50 |
| 3554 Marianna Pl | 0.37mi | 3/2.0 | 1,416 (-11%) | 17mo | $410,000 | $290 | 50 |
| 5585 Hancock Dr | 0.71mi | 3/2.0 | 1,494 (-6%) | 16mo | $200,000 | $134 | 43 |
| 3023 Charlevoix St | 0.67mi | 3/2.0 | 1,794 (+12%) | 12mo | $530,000 | $295 | 38 |
| 3930 E Torch Lake Dr | 0.69mi | 3/2.0 | 1,794 (+12%) | 16mo | $640,000 | $357 | 34 |
Match score weights: distance 35% · size 25% · config 20% · recency 20%. Top-matched comps best support the ARV.
Projected returns pro-forma
10.0% appreciation · 3.0% rent growth · sell at horizon
- IRR
- 18.3%
- Equity multiple
- 2.49×
- Total profit
- $165,000
- Equity at exit
- $355,847
- IRR
- 17.0%
- Equity multiple
- 5.75×
- Total profit
- $525,621
- Equity at exit
- $767,398
Cash invested: $110,600 (down + closing). Projections, not guarantees.
Landlord ↔ Tenant lean methodology
- Overall (STATE)
- 87 Strongly Landlord-Friendly
- State Florida
- 87 Strongly Landlord-Friendly · R+3
- County
- — inherits STATE
- City
- — inherits STATE
ZIP-level market 32163
- Home prices YoY
- 9.8%
- Active inventory
- 265
- Price-to-rent
- 12.7×
Monthly cashflow live
- Estimated rent
- $2,601 high interval (Pro) →
- Mortgage (P&I)
- −$2,071
- Tax from tax record
- −$412 /mo · $4,949/yr
- Insurance
- −$165
- HOA
- −$195
- Vacancy / Maint / Mgmt
- −$546
- Net cashflow
- $-789
Break-even live
UW: 25.0% down · 7.5% · 30yr · 1.5% tax · 5.0% vac · 8.0% maint · 8.0% mgmt
Financing live
Cash to close
- Down payment
- $98,750
- Closing costs
- $11,850
- Reserves months
- —
- Total cash needed
- —
Loan-product check · same deal, 3 products live
Conventional
25% down · 7.5% · 30yr
- Down + closing
- —
- Monthly P&I
- —
- Monthly cashflow
- —
- DSCR
- —
- Eligible?
- —
Personal DTI + credit; lowest rate.
DSCR
20% down · 8.5% · 30yr
- Down + closing
- —
- Monthly P&I
- —
- Monthly cashflow
- —
- DSCR
- —
- Eligible?
- —
No personal income docs; deal must DSCR.
Hard money
10% down · 12.0% · 12mo
- Down + closing
- —
- Monthly P&I
- —
- Monthly cashflow
- —
- DSCR
- —
- Eligible?
- —
Short-term bridge; refi at stabilization.
Rent comps 10 comps
| Address | Beds | Baths | Sqft | Rent | $/sqft | DOM | Units | Dist |
|---|---|---|---|---|---|---|---|---|
| 2577 Lindewood St The Villages, FL | 2.0 | 2.0 | 1206 | $2,495 | $2.07 | 21d | 1 | 0.03mi |
| 6629 Dan DiCiolla Dr Wildwood, FL | 1.0–3.0 | 1.0–2.5 | 1075 | $2,399 | $2.23 | 21d | 44 | 0.62mi |
| 3480 Kewadin Ave The Villages, FL | 2.0 | 2.0 | 1758 | $2,500 | $1.42 | 21d | 1 | 0.63mi |
| 7011 Homestead Lp Wildwood, FL | 1.0–3.0 | 1.0–2.0 | 998 | $1,759 | $1.76 | 21d | 22 | 0.77mi |
| 3064 Gulfport Ct The Villages, FL | 2.0 | 2.0 | 1602 | $2,800 | $1.75 | 21d | 1 | 0.80mi |
| 3025 Bartow Ln The Villages, FL | 3.0 | 2.0 | 1415 | $3,500 | $2.47 | 21d | 1 | 0.87mi |
| 2910 Monument Way The Villages, FL | 2.0 | 2.0 | 1494 | $2,600 | $1.74 | 21d | 1 | 1.09mi |
| 5267 Dragonfly Dr Wildwood, FL | 3.0 | 2.5 | 1688 | $1,945 | $1.15 | 21d | 1 | 1.29mi |
| 5115 Spanish Harbor Dr Wildwood, FL | 1.0–3.0 | 1.0–2.0 | 990 | $1,680 | $1.70 | 21d | 29 | 1.36mi |
| 5339 Loblolly Ln Wildwood, FL | 3.0 | 2.5 | 1688 | $2,000 | $1.18 | 21d | 1 | 1.40mi |
HOA detail
- Monthly dues
- $195 · $2,340/yr
- Likely covers
- pool
Listing history 3 events
-
2026-06-19days on market $395,000 Active 2 DOM
-
2026-06-17remarks 699-char remark
-
2026-06-17$395,000 Active 1 DOM
ⓘ Source: listings_history table (triggers on properties + properties_extension) + one-shot
backfill from property_details.listing_events for pre-trigger history.
Tax reassessment forecast FL · Resets to sale price
- Current annual tax
- $4,949 · $412/mo
- Projected year-2 tax
- $4,949 · $412/mo
- Expected delta
- $0/yr ($0/mo · 0.0%)
ⓘ Screening estimate from a state-policy table — verify with the county assessor before closing.
Climate risk First Street
- Flood 1/10 Low FEMA zone X (unshaded) · 0% chance over 30 yrs
- Wildfire 3/10 Moderate
- Heat 9/10 Extreme 7 d/yr ≥108°F today · 23 d/yr by 30 yrs out
- Wind 9/10 Extreme 99% chance of damaging wind over 30 yrs
- Air quality 2/10 Low 1 unhealthy d/yr today · 2 by 30 yrs out
Nearby sold comps map
Loading sold comps map…
Walkable amenities ~0.75 mi
Loading nearby amenities…
Taxation est. · year 1
- Rental income
- $31,211
- − Mortgage interest
- −$22,126
- − Property taxes
- −$4,949
- − Insurance
- −$1,975
- − Repairs & maintenance
- −$2,497
- − Management
- −$2,497
- − HOA
- −$2,340
- − Depreciation
- −$11,491
- Taxable loss
- −$16,665
- Est. tax savings @ 24.0%
- +$3,999
- After-tax cash flow
- $-5,466/yr
For passive investors: Depreciation is non-cash, so a rental often shows a tax loss while cash-flowing — sheltering income. Rental losses are passive: they offset passive income freely, and up to $25,000/yr can offset ordinary (W-2) income if you actively participate and your MAGI is under $100k (phasing out to $0 by $150k); unused losses carry forward. On sale, claimed depreciation is recaptured at up to 25%, and gains may owe capital-gains tax (a 1031 exchange can defer both). Figures are a year-1 estimate at your 24.0% rate — not tax advice; consult a CPA.
Schools (NCES district)
- District
- Sumter
- NCES district ID
- 1201800
- Math proficiency
- 61% ▼ -4.00%
- Reading proficiency
- 61% ▼ -2.00%
- Median HH income
- $48,240
- Composite
- 51.74/100
- National rank
- #1682
- State rank
- #11 of 73 in FL
Livability — The Villages
- Score
- 70/100
- State rank
- #431
- US rank
- #7363
Category grades
Schools grade is shown separately in the Schools card above.
Census & demographics
- Census place
- The Villages, FL
- County
- Sumter County · 110,591 people
- City population
- 83,973
- Metro
- The Villages, FL
- Population (ZIP)
- 28,549
- Household income
- $96,775
- Rent vs Own
- Severe rent burden
- 307.0
Population outlook (Sumter County) Hauer SSP2
- Today (2025)
- 161,172 people
- By 2030
- 180,083 · +11.7%
- By 2040
- 209,892 · +30.2%
- By 2050
- 234,186 · +45.3%
- By 2075
- 284,602 · +76.6%
- By 2100
- 317,039 · +96.7%
Race, ethnicity, and origin ACS 2023
- Neighborhood character
- Predominantly White (95%)
- Race & ethnicity
- White 95% Two or more races 2% Hispanic / Latino 2% Asian 1%
- Common ancestry
- Romanian 6% Lithuanian 3% Iranian 3%
- Foreign-born
- 6% · Canada, Vietnam
- Languages at home
- 96% English-only · Spanish 2% Vietnamese 1% Other Indo-European 0%
Political lean MEDSL · Sumter
- 2024 margin
- Solid R (+37.6) · D 30.9% · R 68.6%
- 2008→2024 swing
- -10.6pp toward R · 2008: -27.0pp · 2024: -37.6pp
- All cycles
- 2024: R+37.6 2020: R+36.1 2016: R+39.2 2012: R+34.9 2008: R+27.0
Not yet ingested
- Civics
- —
Market trends
- HPI YoY
- ▲ 20.47%
- Current HPI
- 229.0075
- Rent YoY
- —
- Metro
- The Villages, FL
- State GDP YoY
- ▲ 3.28%
- F500 in state
- 36
Industry mix (Fortune 500 HQ in FL)
| Industry | F500 HQs | Revenue |
|---|---|---|
| Industrial Technology | 2 | $29B |
|
||
| Insurance | 2 | $17B |
|
||
| Retail | 1 | $60B |
|
||
| Technology Distribution | 1 | $58B |
|
||
| Homebuilding | 1 | $35B |
|
||
| Technology Manufacturing | 1 | $35B |
|
||
Price history
-16.8% since first listed7 events — show timeline
- 2026-06-17 Listed $395,000 Stellar MLS as Distributed by MLS Grid
- 2023-11-22 Sold (Public Records) $409,000 Public Records
- 2023-11-13 Sold (MLS) $409,000 Stellar MLS as Distributed by MLS Grid
- 2023-09-22 Pending — Stellar MLS as Distributed by MLS Grid
- 2023-09-12 Price Changed $425,000 Stellar MLS as Distributed by MLS Grid
- 2023-08-08 Price Changed $450,000 Stellar MLS as Distributed by MLS Grid
- 2023-06-27 Listed $475,000 Stellar MLS as Distributed by MLS Grid
Property tax history
+11.1%/yrLatest (2025): $4,949 · -2.1% YoY. Source: county tax records.
Cash-flow waterfall
monthlySold comps — $/sqft
last 12 mo · ≤1 miLoading sold comps…