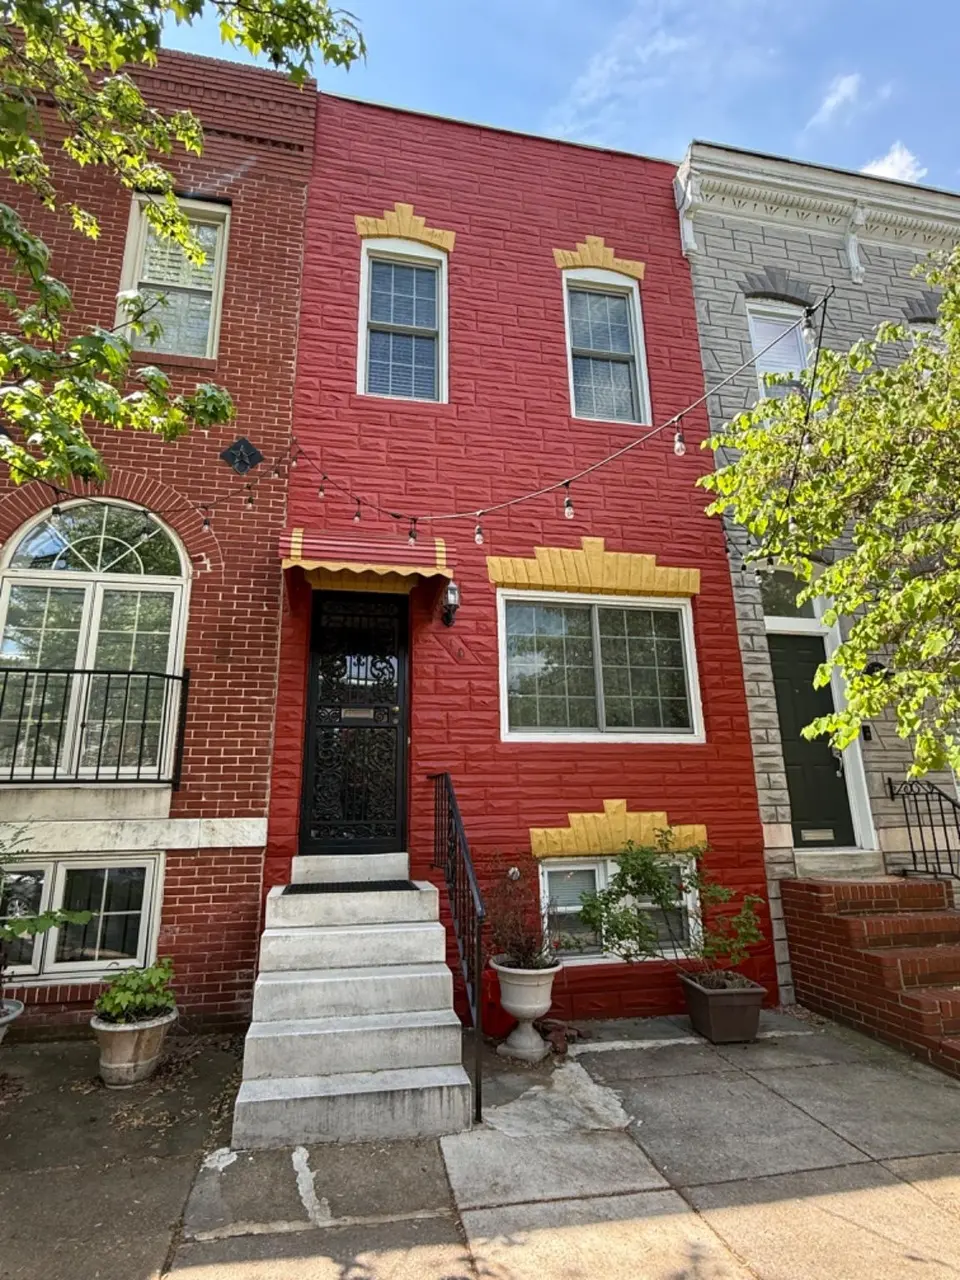
10 N Milton Ave · Baltimore, MD
Flood risk 1/10 · Minimal
- FEMA flood zone
- X (unshaded)
- Chance of flooding over 30 yrs
- 0.0%
- Est. flood insurance / yr
- $473 – $860
Fire risk 1/10 · Minimal
- Est. fire insurance / yr
- $755 – $1,403
Heat risk 7/10 · Major
- Hot days now (above 103°F)
- 7 days/yr
- Hot days in 30 yrs
- 15 days/yr
Wind risk 6/10 · Moderate
- Chance of severe wind over 30 yrs
- 27.0%
Air-quality risk 4/10 · Minor
- Unhealthy air days now
- 6 days/yr
- Unhealthy air days in 30 yrs
- 7 days/yr
Risk factors via First Street. Map © Google.
Why this score? — see what drove the C- grade
The composite is a weighted blend of 9 inputs, each scored 0–100. Each bar is that input's sub-score; the figure is the points it added to the 100-point composite (weight × sub-score).
- Cash flow +19.0/30.0
- ARV discount +15.0/15.0
- DSCR +6.0/10.0
- 1% rule +4.3/10.0
- Livability +3.8/5.0
- Rent growth +2.8/5.0
- Condition / age +2.5/5.0
- Schools +1.0/10.0
- Appreciation +0.0/10.0
$225,000
🖨 Deal sheet (PDF) 📄 Offer letter ✓ Due diligence
Listing remarks
PRICE REDUCED! Nestled in the heart of a vibrant community, and steps away from Patterson Park. Step inside to discover a warm and inviting atmosphere, where natural light dances through the windows, illuminating the rich character of the home. The partially finished basement provides a versatile space, waiting for your finishing touch. Outside, the charming brick façade exudes timeless appeal, while the surrounding neighborhood offers a rich tapestry of local amenities, parks, and cultural attractions. Enjoy leisurely strolls through tree-lined streets or indulge in the vibrant dining and shopping options just moments away. Parking is a breeze with parking pad at the back of the hou
Key facts
- Built 1920
- Listed 51 days
Property features AI
Finance
- Other: Lease not considered
Exterior
- Parking: On-street parking; Other parking
- Utilities: Public water; Public sewer
- Home design: Interior townhouse/rowhouse; Estimated year built
- Construction: Brick construction; Other foundation
- Exterior features: Townhouse/rowhouse setting; No tidal water on the lot; Other above- and below-grade structures; Irrigation water rights
Interior
- Bedrooms: Three bedrooms on the main level
- Bathrooms: One full bathroom on the main level; One half bathroom on the main level; One full bathroom total; One half bathroom total
- Heating & cooling: Forced air heating (natural gas); Central air conditioning (natural gas); Natural gas hot water
- Interior features: Partially finished basement; Level entry to main level; Not in a federal flood zone; Fee simple ownership
Neighborhood map
What this means for you Summary
Snapshot
- This is a 3-bed/1.0-bath townhouse listed at $225k.
Deal economics
- At list price, monthly cash flow is $236 ($3k/yr) — positive.
- The deal already cash-flows at list — no discount required.
- To meet the 1% rule (rent ≥ 1% of price), the offer needs to be $210k (6.8% below list).
- Recommended offer: $210k (6.8% below list) — sets the bar for 1% rule.
- Cap rate 7.6% vs local median 6.0% in Baltimore — meaningfully above typical; check what's discounted (condition, days-on-market, listing class) to confirm the premium yield is real.
Location & tenants
- Location reads 76/100 on livability (#90 in MD, #3,396 nationally) — a middle-class / working-renter tenant base. Strengths: amenities A+, commute A+, housing A+; Watch: schools D, crime F.
- Baltimore City Public Schools (urban): math 7% / reading 16% proficiency, ranked #24 of 24 in MD (top 100%) — low school quality limits family demand, transient renter base, plan for 1-2y turnover; 79% free/reduced lunch — lower-income household profile, screen leases tightly.
- Market conditions: Rents rising (+1.3%/yr); 393 active listings in the ZIP; 40 comparable units currently listed for rent nearby; rentals at typical pace (median 25d on market — plan ~3-4 weeks tenant-placement turnaround); 40% of comp listings sitting > 30 days — soft ceiling on asking rent; solid renter incomes; 1,273 units permitted in Baltimore city in 2024 (1,104 in 5+ unit buildings).
Forward outlook
- Local home prices are declining (-3.0%/yr); year-one equity from $2k of loan paydown is wiped out by about $7k of value loss. Plan a longer hold.
- Baltimore County population projected to shrink 4% by 2050 — rents likely to lag national; underwrite the cash flow, not the appreciation.
Negotiation context
- It's been on market 51 days — a 3% lower offer ($218k) is reasonable based on typical stale-listing flexibility.
- Current owner paid $35k; list at $225k implies a 543% gain — meaningful room to come down on a strong offer.
Risks & watch-outs
- Watch-outs: built in 1920 — expect roof / HVAC / electrical / plumbing capex.
- Climate carrying-cost: major wind risk, 27% chance of damaging wind over 30y; extreme-heat days projected 7→15/yr by 2055 (HVAC capex compounding) — expect insurance premiums to compound above CPI over the hold.
Questions for the listing agent
- It's been on market 51 days. Have you received any prior offers? Is the seller open to a 7% concession, seller financing, or rate buy-down credit?
- Built in 1920 — when were the roof, HVAC, electrical panel, plumbing, and water heater last replaced?
- Is there a deadline driving the sale (1031 exchange, divorce, estate, relocation)? That informs how much negotiation room exists.
- Schools are D-rated, which usually means shorter tenancies and higher turnover. Who's the typical renter profile here, and what's been the actual vacancy rate?
- Crime grade is F in this area — have there been break-ins, vandalism, or insurance claims at this property in the last 3 years? What carrier currently insures it and at what premium?
- What's the average days-on-market for RENTAL listings here right now (not sales)? A rising rental-DOM trend means longer vacancies and softer asking-rent achievability than the comps imply.
- What's the recent tenant-quality profile in this submarket — average credit score on applications, eviction rate, late-payment / NSF rate, and stable-employment percentage? A property-management company in the area should have these aggregated.
- How much new for-sale + rental construction is in the pipeline within 1–3 miles? Heavy new supply typically softens prices + rents 12–24 months out; constrained supply supports both.
Investment metrics
- 1% rule
- 0.93% ✗
- Cap rate
- 7.55%
- Cash-on-cash
- 4.49%
- DSCR
- 1.20
- GRM
- 8.9
CMA / ARV
- ARV (median comp)
- $275,667
- List price
- $225,000
- Delta
- -18.38%
- Verdict
- UNDERPRICED
- Comps
- 20 within 1.0 mi
Show comp detail 12 sales within ~0.75 mi
| Address | Dist | Beds/Ba | Sqft | Sold | Price | $/sf | Match |
|---|---|---|---|---|---|---|---|
| 2435 Jefferson St | 0.28mi | 3/1.0 | 1,260 (+2%) | 1mo | $140,000 | $111 | 82 |
| 410 N Patterson Park Ave | 0.28mi | 3/1.0 | 1,180 (-4%) | 0mo | $180,000 | $153 | 80 |
| 122 Ellwood Ave | 0.47mi | 3/1.5 | 1,200 (-3%) | 0mo | $235,000 | $196 | 72 |
| 220 N Luzerne Ave | 0.20mi | 3/1.0 | 1,372 (+11%) | 1mo | $120,000 | $87 | 71 |
| 410 N Chester St | 0.39mi | 2/1.5 (-1) | 1,260 (+2%) | 1mo | $180,000 | $143 | 70 |
| 145 N Milton Ave | 0.11mi | 2/2.0 (-1) | 1,353 (+10%) | 1mo | $260,000 | $192 | 69 |
| 325 S Castle St | 0.47mi | 2/1.5 (-1) | 1,196 (-3%) | 0mo | $275,000 | $230 | 66 |
| 280 S Robinson St | 0.58mi | 2/1.0 (-1) | 1,282 (+4%) | 1mo | $294,000 | $229 | 61 |
| 2428 Fleet St | 0.50mi | 2/2.5 (-1) | 1,300 (+6%) | 1mo | $285,000 | $219 | 56 |
| 629 N Kenwood Ave | 0.48mi | 2/1.5 (-1) | 1,100 (-11%) | 1mo | $76,500 | $70 | 52 |
| 18 S Washington St | 0.40mi | 3/3.0 | 1,410 (+14%) | 0mo | $318,000 | $226 | 49 |
| 2731 Fait Ave | 0.70mi | 2/2.0 (-1) | 1,097 (-11%) | 0mo | $285,000 | $260 | 40 |
Match score weights: distance 35% · size 25% · config 20% · recency 20%. Top-matched comps best support the ARV.
Projected returns pro-forma
-3.0% appreciation · 1.31% rent growth · sell at horizon
- IRR
- -11.1%
- Equity multiple
- 0.60×
- Total profit
- $-24,999
- Equity at exit
- $33,548
- IRR
- -4.3%
- Equity multiple
- 0.74×
- Total profit
- $-16,548
- Equity at exit
- $19,454
Cash invested: $63,000 (down + closing). Projections, not guarantees.
Landlord ↔ Tenant lean methodology
- Overall (CITY)
- 12 Strongly Tenant-Friendly
- State Maryland
- 27 Tenant-Leaning · D+14
- County
- — inherits STATE
- City Baltimore
- 12 Strongly Tenant-Friendly · D+58
ZIP-level market 21224
- Rents YoY
- 1.3%
- Active inventory
- 393
- Price-to-rent
- 8.9×
Monthly cashflow live
- Estimated rent
- $2,098 high interval (Pro) →
- Mortgage (P&I)
- −$1,180
- Tax from tax record
- −$148 /mo · $1,773/yr
- Insurance
- −$94
- HOA
- −$0
- Vacancy / Maint / Mgmt
- −$441
- Net cashflow
- $236
Break-even live
Sensitivity live
| Price | -10% $363 | -5% $300 | +0% $236 | +5% $172 | +10% $108 |
|---|---|---|---|---|---|
| Rent | -10% $70 | -5% $153 | +0% $236 | +5% $319 | +10% $402 |
| Rate | -1.0pp $349 | -0.5pp $293 | base $236 | +0.5pp $178 | +1.0pp $118 |
UW: 25.0% down · 7.5% · 30yr · 1.5% tax · 5.0% vac · 8.0% maint · 8.0% mgmt
Financing live
Cash to close
- Down payment
- $56,250
- Closing costs
- $6,750
- Reserves months
- —
- Total cash needed
- —
Loan-product check · same deal, 3 products live
Conventional
25% down · 7.5% · 30yr
- Down + closing
- —
- Monthly P&I
- —
- Monthly cashflow
- —
- DSCR
- —
- Eligible?
- —
Personal DTI + credit; lowest rate.
DSCR
20% down · 8.5% · 30yr
- Down + closing
- —
- Monthly P&I
- —
- Monthly cashflow
- —
- DSCR
- —
- Eligible?
- —
No personal income docs; deal must DSCR.
Hard money
10% down · 12.0% · 12mo
- Down + closing
- —
- Monthly P&I
- —
- Monthly cashflow
- —
- DSCR
- —
- Eligible?
- —
Short-term bridge; refi at stabilization.
Rent comps 40 comps
| Address | Beds | Baths | Sqft | Rent | $/sqft | DOM | Units | Dist |
|---|---|---|---|---|---|---|---|---|
| 9 N Luzerne Ave Baltimore, MD | 3.0 | 2.5 | 1380 | $2,450 | $1.78 | 5d | 1 | 0.10mi |
| 107 N Port St Baltimore, MD | 2.0 | 2.0 | 870 | $1,995 | $2.29 | 25d | 1 | 0.11mi |
| 104 N Rose St Baltimore, MD | 3.0 | 2.0 | 936 | $2,500 | $2.67 | 45d | 1 | 0.11mi |
| 16 N Bradford St Baltimore, MD | 2.0 | 3.5 | 930 | $2,400 | $2.58 | 5d | 1 | 0.12mi |
| 2242 E Fairmount Ave Baltimore, MD | 3.0 | 2.0 | 1345 | $2,850 | $2.12 | 45d | 1 | 0.18mi |
| 127 N Glover St Baltimore, MD | 2.0 | 1.5 | 1110 | $2,100 | $1.89 | 4d | 1 | 0.18mi |
| 2410 E Fayette St Baltimore, MD | 3.0 | 1.0 | 1224 | $1,800 | $1.47 | 45d | 1 | 0.19mi |
| 2317 E Fayette St Baltimore, MD | 3.0 | 1.5 | 1315 | $2,000 | $1.52 | 13d | 1 | 0.19mi |
| 139 N Lakewood Ave Unit 1 Baltimore, MD | 4.0 | 2.0 | 1370 | $2,500 | $1.82 | 45d | 1 | 0.22mi |
| 139 N Lakewood Ave Baltimore, MD | 4.0 | 2.5 | 1370 | $2,500 | $1.82 | 45d | 1 | 0.22mi |
| 2608 E Fayette St Unit 1 Baltimore, MD | 2.0 | 1.0 | 900 | $1,700 | $1.89 | 16d | 1 | 0.22mi |
| 108 N Madeira St Baltimore, MD | 2.0 | 2.0 | 1098 | $1,900 | $1.73 | 45d | 1 | 0.22mi |
| 224 N Rose St Baltimore, MD | 2.0 | 2.5 | 1120 | $1,875 | $1.67 | 19d | 1 | 0.22mi |
| 227 N Rose St Baltimore, MD | 2.0 | 4.0 | 1420 | $1,600 | $1.13 | 25d | 1 | 0.23mi |
| 230 N Rose St Baltimore, MD | 2.0 | 1.5 | 1200 | $1,545 | $1.29 | 45d | 1 | 0.23mi |
| 225 N Luzerne Ave Baltimore, MD | 3.0 | 1.0 | 1198 | $1,350 | $1.13 | 20d | 1 | 0.23mi |
| 233 N Rose St Baltimore, MD | 2.0 | 2.5 | 934 | $1,750 | $1.87 | 19d | 1 | 0.23mi |
| 218 N Glover St Baltimore, MD | 2.0 | 2.0 | 1360 | $1,750 | $1.29 | 45d | 1 | 0.24mi |
| 402 N Milton Ave Unit 402B Baltimore, MD | 2.0 | 1.0 | 950 | $1,290 | $1.36 | 45d | 1 | 0.26mi |
| 10 N Streeper St Baltimore, MD | 3.0 | 2.5 | 1440 | $2,500 | $1.74 | 25d | 1 | 0.27mi |
| 211 S Madeira St Baltimore, MD | 2.0 | 1.0 | 819 | $1,650 | $2.01 | 5d | 1 | 0.27mi |
| 227 S Madeira St Baltimore, MD | 2.0 | 2.5 | 1100 | $2,200 | $2.00 | 45d | 1 | 0.28mi |
| 425 N Milton Ave Baltimore, MD | 3.0 | 1.0 | 1200 | $1,525 | $1.27 | 16d | 1 | 0.29mi |
| 437 N Montford Ave Baltimore, MD | 3.0 | 1.5 | 1100 | $1,450 | $1.32 | 45d | 1 | 0.31mi |
| 34 N Linwood Ave Baltimore, MD | 2.0 | 1.5 | 1288 | $2,400 | $1.86 | 25d | 1 | 0.31mi |
| 420 N Montford Ave Baltimore, MD | 3.0 | 1.0 | 1350 | $1,450 | $1.07 | 45d | 1 | 0.31mi |
| 415 N Glover St Baltimore, MD | 2.0 | 2.5 | 1092 | $1,600 | $1.47 | 25d | 1 | 0.32mi |
| 2208 Orleans St Baltimore, MD | 3.0 | 1.0 | 1310 | $1,775 | $1.35 | 45d | 1 | 0.33mi |
| 102 S Curley St Baltimore, MD | 2.0 | 1.5 | 1200 | $1,800 | $1.50 | 5d | 1 | 0.35mi |
| 2308 Jefferson St Baltimore, MD | 3.0 | 1.0 | 907 | $1,450 | $1.60 | 45d | 1 | 0.35mi |
| 415 N Belnord Ave Baltimore, MD | 2.0 | 1.0 | 1008 | $1,300 | $1.29 | 25d | 1 | 0.36mi |
| 406 N Collington Ave Baltimore, MD | 2.0 | 2.5 | 1216 | $1,875 | $1.54 | 45d | 1 | 0.37mi |
| 2015 E Fairmount Ave Baltimore, MD | 3.0 | 3.5 | 1402 | $2,500 | $1.78 | 45d | 1 | 0.37mi |
| 305 S Collington Ave Baltimore, MD | 3.0 | 2.5 | 722 | $2,895 | $4.01 | 18d | 1 | 0.37mi |
| 2800 Orleans St Baltimore, MD | 3.0 | 1.0 | 1404 | $1,600 | $1.14 | 19d | 1 | 0.37mi |
| 2800 Orleans St Baltimore, MD | 3.0 | 1.0 | 1404 | $1,600 | $1.14 | 16d | 1 | 0.37mi |
| 502 N Glover St Baltimore, MD | 2.0 | 1.5 | 827 | $1,250 | $1.51 | 21d | 1 | 0.37mi |
| 150 N Curley St Baltimore, MD | 2.0 | 2.5 | 1266 | $1,850 | $1.46 | 19d | 1 | 0.37mi |
| 517 N Rose St Baltimore, MD | 3.0 | 1.0 | 845 | $1,400 | $1.66 | 5d | 1 | 0.37mi |
| 2815 Orleans St Baltimore, MD | 2.0 | 1.0 | 1204 | $1,600 | $1.33 | 3d | 1 | 0.37mi |
Listing history 18 events
-
2026-06-21statusdays on market $225,000 Pending 51 DOM
-
2026-06-18days on market $225,000 Active 49 DOM
-
2026-06-17days on market $225,000 Active 48 DOM
-
2026-06-16days on market $225,000 Active 47 DOM
-
2026-06-15days on market $225,000 Active 46 DOM
-
2026-06-13days on market $225,000 Active 44 DOM
-
2026-06-09days on market $225,000 Active 40 DOM
-
2026-06-08days on market $225,000 Active 39 DOM
-
2026-06-07days on market $225,000 Active 38 DOM
-
2026-06-04days on market $225,000 Active 35 DOM
-
2026-06-03days on market $225,000 Active 34 DOM
-
2026-06-02days on market $225,000 Active 33 DOM
-
2026-06-01days on market $225,000 Active 32 DOM
-
2026-05-31days on market $225,000 Active 31 DOM
-
2026-05-17price $225,000 887-char remark
-
2026-05-01$249,900 Active 887-char remark
-
2026-04-29historical $249,900 887-char remark
-
1989-07-13soldstatus $35,000
ⓘ Source: listings_history table (triggers on properties + properties_extension) + one-shot
backfill from property_details.listing_events for pre-trigger history.
Tax reassessment forecast MD · Partial reset (capped growth)
- Current annual tax
- $1,773 · $148/mo
- Projected year-2 tax
- $2,113 · $176/mo
- Expected delta
- +$340/yr (+$28/mo · 19.2%)
ⓘ Screening estimate from a state-policy table — verify with the county assessor before closing.
Climate risk First Street
- Flood 1/10 Low FEMA zone X (unshaded) · 0% chance over 30 yrs
- Wildfire 1/10 Low
- Heat 7/10 Severe 7 d/yr ≥103°F today · 15 d/yr by 30 yrs out
- Wind 6/10 Major 27% chance of damaging wind over 30 yrs
- Air quality 4/10 Moderate 6 unhealthy d/yr today · 7 by 30 yrs out
Nearby sold comps map
Loading sold comps map…
Walkable amenities ~0.75 mi
Loading nearby amenities…
Taxation est. · year 1
- Rental income
- $25,173
- − Mortgage interest
- −$12,603
- − Property taxes
- −$1,773
- − Insurance
- −$1,125
- − Repairs & maintenance
- −$2,014
- − Management
- −$2,014
- − Depreciation
- −$6,545
- Taxable loss
- −$901
- Est. tax savings @ 24.0%
- +$216
- After-tax cash flow
- $3,046/yr
For passive investors: Depreciation is non-cash, so a rental often shows a tax loss while cash-flowing — sheltering income. Rental losses are passive: they offset passive income freely, and up to $25,000/yr can offset ordinary (W-2) income if you actively participate and your MAGI is under $100k (phasing out to $0 by $150k); unused losses carry forward. On sale, claimed depreciation is recaptured at up to 25%, and gains may owe capital-gains tax (a 1031 exchange can defer both). Figures are a year-1 estimate at your 24.0% rate — not tax advice; consult a CPA.
Schools (NCES district)
- District
- Baltimore City Public Schools
- NCES district ID
- 2400090
- Math proficiency
- 7% ▼ -9.00%
- Reading proficiency
- 16% ▼ -5.00%
- Median HH income
- $42,108
- Composite
- 10.08/100
- National rank
- #9805
- State rank
- #24 of 24 in MD
Livability — Baltimore
- Score
- 76/100
- State rank
- #90
- US rank
- #3396
Category grades
Schools grade is shown separately in the Schools card above.
Census & demographics
- Census place
- Baltimore, MD
- County
- Baltimore City · 558,601 people
- City population
- 588,727
- Metro
- Baltimore-Columbia-Towson, MD
- Population (ZIP)
- 47,465
- Household income
- $89,017
- Rent vs Own
- Severe rent burden
- 1786.0
Population outlook (Baltimore County) Hauer SSP2
- Today (2025)
- 624,249 people
- By 2030
- 621,541 · -0.4%
- By 2040
- 609,756 · -2.3%
- By 2050
- 597,249 · -4.3%
- By 2075
- 552,236 · -11.5%
- By 2100
- 513,934 · -17.7%
Race, ethnicity, and origin ACS 2023
- Neighborhood character
- Diverse neighborhood (Simpson 0.62)
- Race & ethnicity
- White 55% Hispanic / Latino 21% Black 16% Two or more races 7% Asian 4%
- Hispanic origin (detail)
- Mexican 4% Puerto Rican 2% Dominican 1%
- Common ancestry
- Romanian 5% Lithuanian 2% Italian 1%
- Foreign-born
- 17% · Canada, China, Vietnam
- Languages at home
- 76% English-only · Spanish 18% Other Indo-European 2% Russian/Polish/Slavic 1%
Political lean MEDSL · Baltimore
- 2024 margin
- Solid D (+73.0) · D 85.2% · R 12.2% · Other 2.6%
- 2008→2024 swing
- -2.5pp toward R · 2008: 75.5pp · 2024: 73.0pp
- All cycles
- 2024: D+73.0 2020: D+76.6 2016: D+74.6 2012: D+76.4 2008: D+75.5
Not yet ingested
- Civics
- —
Market trends
- HPI YoY
- ▼ -332.23%
- Current HPI
- 241.284
- Rent YoY
- ▲ 1.31%
- Metro
- Baltimore-Columbia-Towson, MD
- State GDP YoY
- ▲ 2.97%
- F500 in state
- 12
Industry mix (Fortune 500 HQ in MD)
| Industry | F500 HQs | Revenue |
|---|---|---|
| Aerospace / Defense | 1 | $71B |
|
||
| Utilities | 1 | $25B |
|
||
| Hotels | 1 | $24B |
|
||
| Consumer Goods | 1 | $7B |
|
||
| Real Estate | 1 | $6B |
|
||
| Chemicals | 1 | $2B |
|
||
Price history
+542.9% since first listed4 events — show timeline
- 2026-05-17 Price Changed $225,000 BRIGHT MLS
- 2026-05-01 Listed $249,900 BRIGHT MLS
- 2026-04-29 Coming Soon $249,900 BRIGHT MLS
- 1989-07-13 Sold (Public Records) $35,000 Public Records
Property tax history
-3.5%/yrLatest (2025): $1,773 · +4.5% YoY. Source: county tax records.
Cash-flow waterfall
monthlySold comps — $/sqft
last 12 mo · ≤1 miLoading sold comps…