 🏗️ New Construction
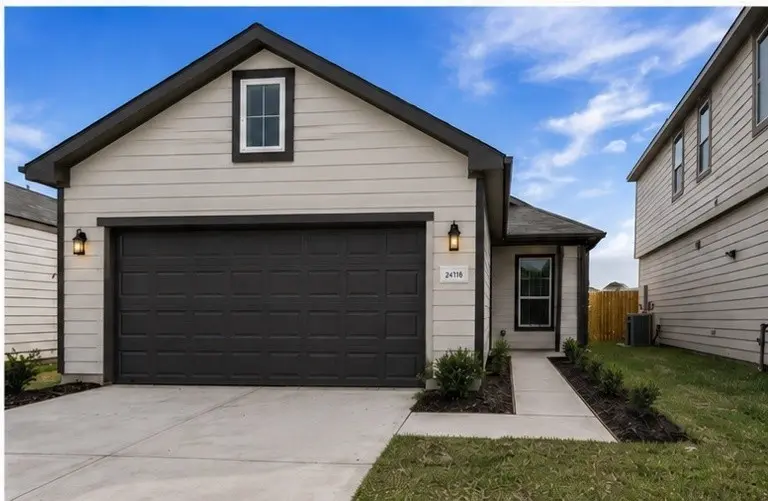
206 Colonnade Reflection Dr · Houston, TX
Flood risk 1/10 · Minimal
- FEMA flood zone
- X (unshaded)
- Chance of flooding over 30 yrs
- 0.0%
- Est. flood insurance / yr
- $507 – $1,088
Fire risk 5/10 · Moderate
- Est. fire insurance / yr
- $1,222 – $2,270
Heat risk 9/10 · Severe
- Hot days now (above 111°F)
- 7 days/yr
- Hot days in 30 yrs
- 24 days/yr
Wind risk 9/10 · Severe
- Chance of severe wind over 30 yrs
- 99.0%
Air-quality risk 2/10 · Minimal
- Unhealthy air days now
- 2 days/yr
- Unhealthy air days in 30 yrs
- 2 days/yr
Risk factors via First Street. Map © Google.
Why this score? — see what drove the C- grade
The composite is a weighted blend of 9 inputs, each scored 0–100. Each bar is that input's sub-score; the figure is the points it added to the 100-point composite (weight × sub-score).
- Cash flow +20.7/30.0
- ARV discount +7.5/15.0
- DSCR +6.6/10.0
- 1% rule +5.8/10.0
- Condition / age +4.0/5.0
- Livability +3.7/5.0
- Schools +3.5/10.0
- Rent growth +2.9/5.0
- Appreciation +0.0/10.0
$197,990
🖨 Deal sheet (PDF) 📄 Offer letter ✓ Due diligence
Listing remarks
Beautiful new 3-bedroom, 2-bath home in the desirable Crosby Terrace community! This thoughtfully designed home features an open-concept floor plan perfect for both everyday living and entertaining. The spacious kitchen flows seamlessly into the dining and family areas, creating a bright and inviting atmosphere. The private covered patio offers the perfect space to relax, enjoy your morning coffee, or host guests year-round. The owner’s suite provides a peaceful retreat with a well-appointed bath and generous closet space. With modern finishes, comfortable secondary bedrooms, and a functional layout, this home combines style and convenience. A wonderful opportunity to enjoy new constr
Key facts
- Spacious kitchen
- Great location
- Owner's suite
Tags
Property features AI
Finance
- HOA & community: Association: ACMI MANAGEMENT; Association amenities include playground, park, and trails; Annual association fee of $600 covering common areas and recreation facilities
Exterior
- Parking: Attached 2-car garage; Attached garage parking
- Security: Smoke detector(s)
- Utilities: Public water; Public sewer
- Home design: Residential property; Under construction (new construction); Slab foundation; Composition roof; Builder: COLINA HOMES; Living area approximately 1,243; Lot dimensions 40 x 120 (4,800 sq ft); Concrete road surface
- Construction: Brick and wood siding construction; Year built 2026
- Exterior features: Covered patio; Deck; Porch; Patio; Private yard; Back yard fencing; Subdivision
Interior
- Kitchen: Dishwasher; Gas cooktop; Gas oven; Microwave; Disposal; Pantry; Granite counters
- Bedrooms: Primary bedroom (first floor) — 14 x 12; Bedroom (first floor) — 11.5 x 10; Bedroom (first floor) — 12.5 x 10.5
- Flooring: Carpet; Plank; Tile; Vinyl
- Bathrooms: 2 full bathrooms
- Heating & cooling: Central heating (gas); Central air (electric)
- Interior features: Insulated doors; Double vanity; Granite counters; High ceilings; Pantry; Separate shower and tub/shower; Window treatments / coverings; Ceiling fans; Programmable thermostat; Low emissivity windows
- Laundry & utility: Washer hookup; Electric dryer hookup
Neighborhood map
What this means for you Summary
Snapshot
- This is a 3-bed/2.0-bath single-family listed at $198k. Condition is rated good.
Deal economics
- At list price, monthly cash flow is $242 ($3k/yr) — positive.
- The deal already cash-flows at list — no discount required.
- To meet the 1% rule (rent ≥ 1% of price), the offer needs to be $192k (2.8% below list).
- Recommended offer: $192k (3.0% below list) — sets the bar for market timing.
- Cap rate 7.9% vs local median 3.2% in Houston — top-decile yield for the area; either an underpriced asset or a hidden risk that comps aren't pricing in. Stress-test before assuming the spread holds.
Location & tenants
- Location reads 74/100 on livability (#184 in TX, #4,771 nationally) — a middle-class / working-renter tenant base. Strengths: amenities A+, cost of living A+, housing A+; Watch: crime F.
- Crosby ISD (rural): math 39% / reading 40% proficiency, ranked #369 of 826 in TX (top 45%) — families likely to look elsewhere, expect single-tenant / working-renter base with shorter leases.
- Zoned schools: Crosby Middle (math 36% / reading 37%, grade F, #786 of 1,662 statewide, top 48%, 1,549 students, 60% FRL); Crosby H S (math 44% / reading 45%, grade F, #652 of 1,632 statewide, top 43%, 1,937 students, 54% FRL).
- Market conditions: Rents rising (+1.5%/yr); 1189 active listings in the ZIP; solid renter incomes; 29,883 units permitted in Harris County in 2024 (8,621 in 5+ unit buildings).
Forward outlook
- Local home prices are declining (-3.0%/yr); year-one equity from $1k of loan paydown is wiped out by about $5k of value loss. Plan a longer hold.
- Harris County population projected at +47% by 2050 — long-run rental-demand tailwind backs the buy-and-hold thesis.
Negotiation context
- It's been on market 31 days — a 3% lower offer ($192k) is reasonable based on typical stale-listing flexibility.
- 2 sale attempts with the ask held roughly flat each time — persistent listings suggest the price (not the market) is what's stuck; bring a comps-based counter.
Risks & watch-outs
- Climate carrying-cost: severe wind risk, 99% chance of damaging wind over 30y; moderate wildfire risk; extreme-heat days projected 7→24/yr by 2055 (HVAC capex compounding) — expect insurance premiums to compound above CPI over the hold.
Questions for the listing agent
- It's been on market 31 days. Have you received any prior offers? Is the seller open to a 3% concession, seller financing, or rate buy-down credit?
- What does the HOA fee cover, when was the last increase, and are there any pending special assessments or reserve-fund shortfalls?
- Is there a deadline driving the sale (1031 exchange, divorce, estate, relocation)? That informs how much negotiation room exists.
- Schools are D-rated, which usually means shorter tenancies and higher turnover. Who's the typical renter profile here, and what's been the actual vacancy rate?
- Crime grade is F in this area — have there been break-ins, vandalism, or insurance claims at this property in the last 3 years? What carrier currently insures it and at what premium?
- What's the average days-on-market for RENTAL listings here right now (not sales)? A rising rental-DOM trend means longer vacancies and softer asking-rent achievability than the comps imply.
- What's the recent tenant-quality profile in this submarket — average credit score on applications, eviction rate, late-payment / NSF rate, and stable-employment percentage? A property-management company in the area should have these aggregated.
- How much new for-sale + rental construction is in the pipeline within 1–3 miles? Heavy new supply typically softens prices + rents 12–24 months out; constrained supply supports both.
Investment metrics
- 1% rule
- 1.08% ✓
- Cap rate
- 7.93%
- Cash-on-cash
- 5.84%
- DSCR
- 1.26
- GRM
- 7.7
CMA / ARV
- ARV (median comp)
- $177,682
- List price
- $197,990
- Delta
- 11.43%
- Verdict
- OVERPRICED
- Comps
- 20 within 1.0 mi
Show comp detail 6 sales within ~0.75 mi
| Address | Dist | Beds/Ba | Sqft | Sold | Price | $/sf | Match |
|---|---|---|---|---|---|---|---|
| 119 Little Buck Dr | 0.46mi | 3/2.0 | 1,172 (-6%) | 3mo | $225,000 | $192 | 67 |
| 605 Heather Gate Ln | 0.44mi | 3/2.0 | 1,140 (-8%) | 9mo | $99,000 | $87 | 58 |
| 119 Antelope Dr | 0.25mi | 3/1.5 | 1,333 (+7%) | 20mo | $235,000 | $176 | 58 |
| 614 Elk Dr | 0.72mi | 3/2.0 | 1,275 (+3%) | 20mo | $209,000 | $164 | 46 |
| 507 Elk Dr | 0.58mi | 2/1.0 (-1) | 1,144 (-8%) | 8mo | $160,000 | $140 | 44 |
| 706 Antelope Dr | 0.70mi | 2/2.0 (-1) | 1,230 (-1%) | 24mo | $149,000 | $121 | 41 |
Match score weights: distance 35% · size 25% · config 20% · recency 20%. Top-matched comps best support the ARV.
Projected returns pro-forma
-3.0% appreciation · 1.48% rent growth · sell at horizon
- IRR
- -9.0%
- Equity multiple
- 0.67×
- Total profit
- $-16,218
- Equity at exit
- $26,493
- IRR
- -1.8%
- Equity multiple
- 0.89×
- Total profit
- $-5,568
- Equity at exit
- $15,363
Cash invested: $49,751 (down + closing). Projections, not guarantees.
Landlord ↔ Tenant lean methodology
- Overall (STATE)
- 87 Strongly Landlord-Friendly
- State Texas
- 87 Strongly Landlord-Friendly · R+5
- County
- — inherits STATE
- City
- — inherits STATE
ZIP-level market 77532
- Home prices YoY
- -28.6%
- Rents YoY
- 1.5%
- Active inventory
- 1189
- Price-to-rent
- 8.6×
Monthly cashflow live
- Estimated rent
- $1,924 medium interval (Pro) →
- Mortgage (P&I)
- −$932
- Tax est. 1.5%
- −$222 /mo · $2,665/yr
- Insurance
- −$74
- HOA
- −$50
- Vacancy / Maint / Mgmt
- −$404
- Net cashflow
- $242
Break-even live
Sensitivity live
| Price | -10% $365 | -5% $303 | +0% $242 | +5% $181 | +10% $119 |
|---|---|---|---|---|---|
| Rent | -10% $90 | -5% $166 | +0% $242 | +5% $318 | +10% $394 |
| Rate | -1.0pp $331 | -0.5pp $287 | base $242 | +0.5pp $196 | +1.0pp $149 |
UW: 25.0% down · 7.5% · 30yr · 1.5% tax · 5.0% vac · 8.0% maint · 8.0% mgmt
Financing live
Cash to close
- Down payment
- $44,421
- Closing costs
- $5,330
- Reserves months
- —
- Total cash needed
- —
Loan-product check · same deal, 3 products live
Conventional
25% down · 7.5% · 30yr
- Down + closing
- —
- Monthly P&I
- —
- Monthly cashflow
- —
- DSCR
- —
- Eligible?
- —
Personal DTI + credit; lowest rate.
DSCR
20% down · 8.5% · 30yr
- Down + closing
- —
- Monthly P&I
- —
- Monthly cashflow
- —
- DSCR
- —
- Eligible?
- —
No personal income docs; deal must DSCR.
Hard money
10% down · 12.0% · 12mo
- Down + closing
- —
- Monthly P&I
- —
- Monthly cashflow
- —
- DSCR
- —
- Eligible?
- —
Short-term bridge; refi at stabilization.
HOA detail
- Monthly dues
- $50 · $600/yr
Listing history 15 events
-
2026-06-21days on market $197,990 Active 31 DOM
-
2026-06-18days on market $197,990 Active 28 DOM
-
2026-06-17days on market $197,990 Active 27 DOM
-
2026-06-16days on market $197,990 Active 26 DOM
-
2026-06-15days on market $197,990 Active 25 DOM
-
2026-06-13days on market $197,990 Active 23 DOM
-
2026-06-09days on market $197,990 Active 19 DOM
-
2026-06-08days on market $197,990 Active 18 DOM
-
2026-06-07days on market $197,990 Active 17 DOM
-
2026-06-04days on market $197,990 Active 14 DOM
-
2026-06-03days on market $197,990 Active 13 DOM
-
2026-06-02days on market $197,990 Active 12 DOM
-
2026-06-01days on market $197,990 Active 11 DOM
-
2026-05-31days on market $197,990 Active 10 DOM
-
2026-04-11$197,990 Active 784-char remark
ⓘ Source: listings_history table (triggers on properties + properties_extension) + one-shot
backfill from property_details.listing_events for pre-trigger history.
Climate risk First Street
- Flood 1/10 Low FEMA zone X (unshaded) · 0% chance over 30 yrs
- Wildfire 5/10 Major
- Heat 9/10 Extreme 7 d/yr ≥111°F today · 24 d/yr by 30 yrs out
- Wind 9/10 Extreme 99% chance of damaging wind over 30 yrs
- Air quality 2/10 Low 2 unhealthy d/yr today · 2 by 30 yrs out
Nearby sold comps map
Loading sold comps map…
Walkable amenities ~0.75 mi
Loading nearby amenities…
Taxation est. · year 1
- Rental income
- $23,088
- − Mortgage interest
- −$9,953
- − Property taxes
- −$2,665
- − Insurance
- −$888
- − Repairs & maintenance
- −$1,847
- − Management
- −$1,847
- − HOA
- −$600
- − Depreciation
- −$5,169
- Taxable income
- $118
- Est. tax owed @ 24.0%
- −$28
- After-tax cash flow
- $2,876/yr
For passive investors: Depreciation is non-cash, so a rental often shows a tax loss while cash-flowing — sheltering income. Rental losses are passive: they offset passive income freely, and up to $25,000/yr can offset ordinary (W-2) income if you actively participate and your MAGI is under $100k (phasing out to $0 by $150k); unused losses carry forward. On sale, claimed depreciation is recaptured at up to 25%, and gains may owe capital-gains tax (a 1031 exchange can defer both). Figures are a year-1 estimate at your 24.0% rate — not tax advice; consult a CPA.
Condition & rehab AI · 12 photos
This well-maintained, modern home in a desirable community is ready for immediate occupancy. It offers a good balance of style and functionality, with potential for minor updates to enhance its curb appeal and value.
Value-add opportunities
- Both Painting the exterior and interior walls — Fresh paint can enhance the home's curb appeal and interior aesthetics.
- Both Landscaping improvements — Enhanced landscaping can increase both resale and rental value.
- Both Adding smart home features — Smart home features can improve convenience and add value to the property.
- Resale Upgrading the kitchen appliances — Modern, high-end appliances can attract more buyers and renters.
- Rental Adding a smart thermostat — A smart thermostat can help reduce energy costs and attract eco-conscious renters.
Renovation cost estimate screening
Value-add ROI direction
- Both Painting the exterior and interior walls — Fresh paint can enhance the home's curb appeal and interior aesthetics. ↑
- Both Landscaping improvements — Enhanced landscaping can increase both resale and rental value. ↑
- Both Adding smart home features — Smart home features can improve convenience and add value to the property. ↑
- Resale Upgrading the kitchen appliances — Modern, high-end appliances can attract more buyers and renters. ↑
- Rental Adding a smart thermostat — A smart thermostat can help reduce energy costs and attract eco-conscious renters. ↑
ⓘ Cost ranges are severity-bucket heuristics (US national rule-of-thumb). Get contractor quotes + a written scope before underwriting a rehab budget.
Schools (NCES district)
- District
- Crosby ISD
- NCES district ID
- 4815750
- Math proficiency
- 39% ▼ -13.00%
- Reading proficiency
- 40% ▼ -5.00%
- Median HH income
- $61,079
- Composite
- 35.14/100
- National rank
- #5012
- State rank
- #369 of 826 in TX
Livability — Houston
- Score
- 74/100
- State rank
- #184
- US rank
- #4771
Category grades
Schools grade is shown separately in the Schools card above.
Census & demographics
- County
- Harris County · 4,702,590 people
- City population
- 3,226,434
- Metro
- Houston-The Woodlands-Sugar Land, TX
- Population (ZIP)
- 33,780
- Household income
- $92,201
- Rent vs Own
- Severe rent burden
- 382.0
Population outlook (Harris County) Hauer SSP2
- Today (2025)
- 5,571,493 people
- By 2030
- 6,089,821 · +9.3%
- By 2040
- 7,142,806 · +28.2%
- By 2050
- 8,185,864 · +46.9%
- By 2075
- 10,574,329 · +89.8%
- By 2100
- 12,109,958 · +117.4%
Race, ethnicity, and origin ACS 2023
- Neighborhood character
- Diverse neighborhood (Simpson 0.60)
- Race & ethnicity
- White 54% Hispanic / Latino 31% Two or more races 16% Black 9%
- Hispanic origin (detail)
- Mexican 24%
- Common ancestry
- Lithuanian 4% Romanian 3% Italian 2%
- Foreign-born
- 10% · Canada
- Languages at home
- 78% English-only · Spanish 21%
Political lean MEDSL · Harris
- 2024 margin
- Lean D (+5.5) · D 52.0% · R 46.4% · Other 1.6%
- 2008→2024 swing
- +3.9pp toward D · 2008: 1.6pp · 2024: 5.5pp
- All cycles
- 2024: D+5.5 2020: D+13.3 2016: D+12.4 2012: D+0.1 2008: D+1.6
Not yet ingested
- Civics
- —
Market trends
- HPI YoY
- ▼ -105.63%
- Current HPI
- 264.0126
- Rent YoY
- ▲ 1.48%
- Metro
- Houston-The Woodlands-Sugar Land, TX
- State GDP YoY
- ▲ 3.95%
- F500 in state
- 110
Industry mix (Fortune 500 HQ in TX)
| Industry | F500 HQs | Revenue |
|---|---|---|
| Energy | 16 | $1,198B |
|
||
| Technology | 5 | $198B |
|
||
| Engineering / Construction | 4 | $72B |
|
||
| Energy Services | 3 | $60B |
|
||
| Utilities | 3 | $41B |
|
||
| Healthcare | 2 | $330B |
|
||
Price history
+0.0% since first listed3 events — show timeline
- 2026-05-21 Listed $197,990 HARMLS
- 2026-05-21 Listing Removed — HARMLS
- 2026-04-11 Listed $197,990 HARMLS
Cash-flow waterfall
monthlySold comps — $/sqft
last 12 mo · ≤1 miLoading sold comps…