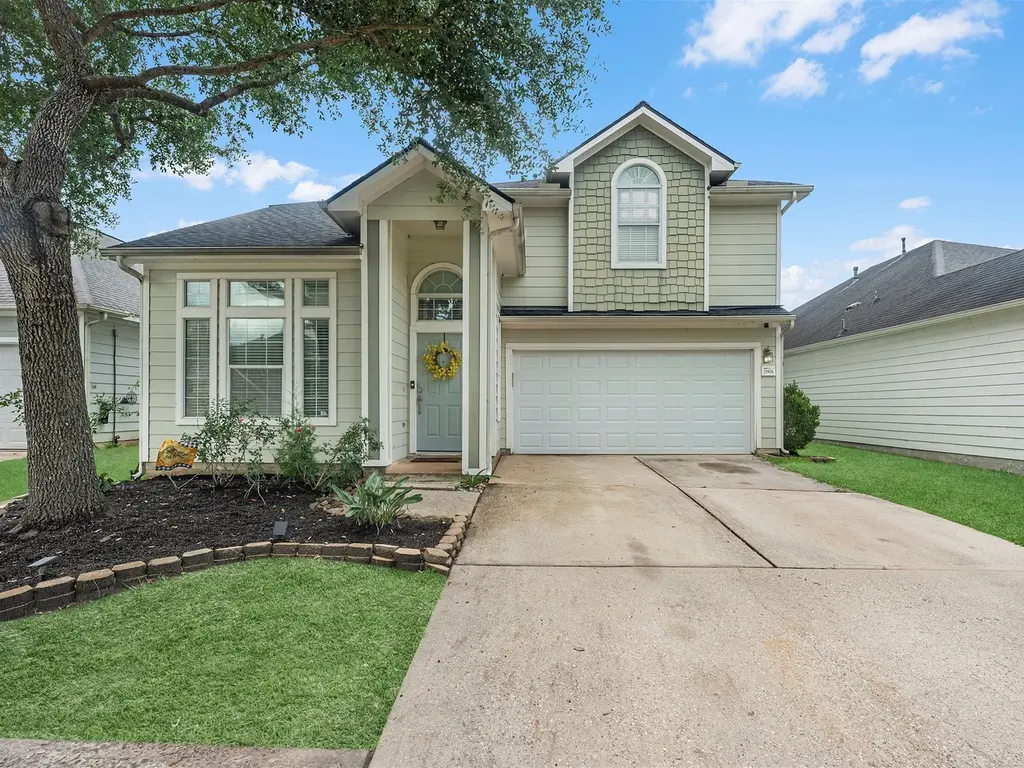
15826 Shoreline Terrace Dr · Houston, TX
Flood risk 1/10 · Minimal
- FEMA flood zone
- X (unshaded)
- Chance of flooding over 30 yrs
- 0.0%
- Est. flood insurance / yr
- $507 – $1,088
Fire risk 1/10 · Minimal
- Est. fire insurance / yr
- $1,222 – $2,270
Heat risk 9/10 · Severe
- Hot days now (above 111°F)
- 7 days/yr
- Hot days in 30 yrs
- 24 days/yr
Wind risk 9/10 · Severe
- Chance of severe wind over 30 yrs
- 99.0%
Air-quality risk 3/10 · Minor
- Unhealthy air days now
- 3 days/yr
- Unhealthy air days in 30 yrs
- 3 days/yr
Risk factors via First Street. Map © Google.
Why this score? — see what drove the C grade
The composite is a weighted blend of 9 inputs, each scored 0–100. Each bar is that input's sub-score; the figure is the points it added to the 100-point composite (weight × sub-score).
- Cash flow +15.0/30.0
- ARV discount +15.0/15.0
- 1% rule +5.6/10.0
- DSCR +4.6/10.0
- Appreciation +4.2/10.0
- Schools +3.9/10.0
- Livability +3.7/5.0
- Rent growth +2.7/5.0
- Condition / age +2.5/5.0
$299,900
🖨 Deal sheet 📄 Offer letter ✓ Due diligence
Listing remarks
Nestled in the serene Lakeshore Subdivision, this home offers an array of amenities including a pool, splash pad, playground, workout room, party room, and tennis/pickleball courts. The spacious bedrooms feature ample closet space, while the kitchen boasts quartz countertops, a gas stove, and tile flooring. The primary bedroom on the main floor includes a walk-in closet, wood floors, and a luxurious ensuite with double sinks, separate shower, and garden tub. Upstairs, a game room accompanies three additional large bedrooms with walk-in closets and a jack and jill bathroom. The family room features a cozy fireplace, wood floors, and there is a formal dining room with wood floors as well. Woo
Key facts
- Workout room
- Tennis courts
- Splash pad
Tags
Property features AI
Finance
- HOA & community: Association managed by Crest Management; Annual association fee of $800 (covers common areas and recreation facilities); Community amenities include fitness center, playground, pickleball, park, pool, and trash service; Community features include community pool and curbs
Exterior
- Parking: Attached 2-car garage; Attached garage parking
- Security: Owned security system; Smoke detectors
- Utilities: Public water; Public sewer
- Home design: Residential property; Built in 2006; Pillar/post/pier foundation
- Construction: Cement siding; Composition roof
- Exterior features: Association pool; Subdivision lot; Concrete road surface
Interior
- Kitchen: Dishwasher; Disposal; Gas oven; Gas range; Microwave; Pantry
- Bedrooms: Primary bedroom on the first floor (approx. 17x13); Three additional bedrooms on the second floor (approx. 16x12, 13x12, 12x11)
- Flooring: Carpet; Tile; Wood
- Bathrooms: Two full bathrooms; One half bathroom
- Heating & cooling: Central heating (gas); Central air conditioning (electric)
- Interior features: Gas fireplace; Double vanity; Pantry; Soaking tub; Separate shower; Tub/shower combination; Window treatments / coverings
- Laundry & utility: Washer hookup; Electric dryer hookup; Gas dryer hookup
Neighborhood map
What this means for you Summary
Snapshot
- This is a 4-bed/2.5-bath single-family listed at $300k.
Deal economics
- At list price, monthly cash flow is $92 ($1k/yr) — positive.
- The deal already cash-flows at list — no discount required.
- Meets the 1% rule at list price ($3k rent vs $300k).
- Cap rate 6.7% vs local median 3.2% in Houston — top-decile yield for the area; either an underpriced asset or a hidden risk that comps aren't pricing in. Stress-test before assuming the spread holds.
Location & tenants
- Location reads 74/100 on livability (#184 in TX, #4,771 nationally) — a middle-class / working-renter tenant base. Strengths: amenities A+, cost of living A+, housing A+; Watch: crime F.
- Humble ISD (urban): math 38% / reading 44% proficiency, ranked #262 of 826 in TX (top 32%) — families likely to look elsewhere, expect single-tenant / working-renter base with shorter leases.
- Zoned schools: Lakeshore El (math 26% / reading 33%, grade F, #2,525 of 4,322 statewide, top 62%, 862 students, 48% FRL); Summer Creek H S (math 33% / reading 48%, grade F, #798 of 1,632 statewide, top 49%, 3,600 students, 45% FRL).
- Market conditions: Rents flat; 337 active listings in the ZIP; 9 comparable units currently listed for rent nearby; rentals leasing fast (median 6d on market — plan ~1-2 weeks tenant-placement turnaround); solid renter incomes; 29,883 units permitted in Harris County in 2024 (8,621 in 5+ unit buildings).
- This rent runs 40% of the median local income ($95k/yr) — at the standard rent-burdened threshold; future hikes will face affordability resistance.
Forward outlook
- Local home prices are declining (-1.6%/yr); year-one equity from $2k of loan paydown is wiped out by about $5k of value loss. Plan a longer hold.
- Harris County population projected at +47% by 2050 — long-run rental-demand tailwind backs the buy-and-hold thesis.
Negotiation context
- Only 10 days on market — expect competitive offers; lowballing is unlikely to land.
- 4 sale attempts since 14y ago with the ask held roughly flat each time — persistent listings suggest the price (not the market) is what's stuck; bring a comps-based counter.
Risks & watch-outs
- Watch-outs: property tax is 2.7% of price.
- Climate carrying-cost: severe wind risk, 99% chance of damaging wind over 30y; extreme-heat days projected 7→24/yr by 2055 (HVAC capex compounding) — expect insurance premiums to compound above CPI over the hold.
Questions for the listing agent
- Property tax is high relative to price — has the assessment been appealed recently, and will the sale trigger a re-assessment?
- What does the HOA fee cover, when was the last increase, and are there any pending special assessments or reserve-fund shortfalls?
- Is there a deadline driving the sale (1031 exchange, divorce, estate, relocation)? That informs how much negotiation room exists.
- Schools are D-rated, which usually means shorter tenancies and higher turnover. Who's the typical renter profile here, and what's been the actual vacancy rate?
- Crime grade is F in this area — have there been break-ins, vandalism, or insurance claims at this property in the last 3 years? What carrier currently insures it and at what premium?
- What's the average days-on-market for RENTAL listings here right now (not sales)? A rising rental-DOM trend means longer vacancies and softer asking-rent achievability than the comps imply.
- What's the recent tenant-quality profile in this submarket — average credit score on applications, eviction rate, late-payment / NSF rate, and stable-employment percentage? A property-management company in the area should have these aggregated.
- How much new for-sale + rental construction is in the pipeline within 1–3 miles? Heavy new supply typically softens prices + rents 12–24 months out; constrained supply supports both.
Investment metrics
- 1% rule
- 1.06% ✓
- Cap rate
- 6.66%
- Cash-on-cash
- 1.31%
- DSCR
- 1.06
- GRM
- 7.8
CMA / ARV
- ARV (on-the-fly)
- $406,296
- Comps found
- 12
Show comp detail 12 sales within ~0.75 mi
| Address | Dist | Beds/Ba | Sqft | Sold | Price | $/sf | Match |
|---|---|---|---|---|---|---|---|
| 12919 Palm Leaf Ct | 0.08mi | 4/2.5 | 2,863 (-7%) | 3mo | $229,900 | $80 | 82 |
| 13103 Six Rivers Dr | 0.44mi | 4/3.0 | 3,043 (-1%) | 1mo | $479,000 | $157 | 75 |
| 12923 Pecan Shores Dr | 0.10mi | 5/2.5 (+1) | 2,777 (-10%) | 0mo | $319,995 | $115 | 74 |
| 16007 Angler Bend Dr | 0.16mi | 4/3.0 | 2,674 (-13%) | 5mo | $349,786 | $131 | 64 |
| 15915 Angler Bend Dr | 0.19mi | 4/3.5 | 2,710 (-12%) | 5mo | $315,000 | $116 | 63 |
| 13235 Barkley Bend Ln | 0.42mi | 4/3.0 | 2,828 (-8%) | 5mo | $475,000 | $168 | 61 |
| 13211 Offshore Dr | 0.51mi | 5/4.0 (+1) | 3,397 (+10%) | 0mo | $535,000 | $157 | 48 |
| 16334 Gentle Slope Ln | 0.49mi | 5/4.0 (+1) | 3,412 (+11%) | 3mo | $450,000 | $132 | 46 |
| 13018 Foxwood Creek Ln | 0.66mi | 3/2.5 (-1) | 2,784 (-10%) | 6mo | $290,000 | $104 | 44 |
| 16706 Hemlock Grove Dr | 0.60mi | 4/3.0 | 3,536 (+15%) | 2mo | $584,900 | $165 | 43 |
| 12919 Leolyn Woods Ln | 0.73mi | 4/3.5 | 3,438 (+12%) | 0mo | $475,000 | $138 | 42 |
| 15615 Tindary Meadow Ct | 0.64mi | 3/2.0 (-1) | 2,673 (-13%) | 2mo | $350,000 | $131 | 39 |
Match score weights: distance 35% · size 25% · config 20% · recency 20%. Top-matched comps best support the ARV.
Projected returns pro-forma
-1.59% appreciation · 0.92% rent growth · sell at horizon
- IRR
- -9.1%
- Equity multiple
- 0.63×
- Total profit
- $-30,870
- Equity at exit
- $64,049
- IRR
- -4.2%
- Equity multiple
- 0.67×
- Total profit
- $-27,492
- Equity at exit
- $60,380
Cash invested: $83,972 (down + closing). Projections, not guarantees.
Landlord ↔ Tenant lean methodology
- Overall (STATE)
- 87 Strongly Landlord-Friendly
- State Texas
- 87 Strongly Landlord-Friendly · R+5
- County
- — inherits STATE
- City
- — inherits STATE
ZIP-level market 77044
- Home prices YoY
- -0.7%
- Rents YoY
- 0.9%
- Active inventory
- 337
- Price-to-rent
- 7.8×
Monthly cashflow live
- Estimated rent
- $3,194 high interval (Pro) →
- Mortgage (P&I)
- −$1,573
- Tax from tax record
- −$667 /mo · $8,002/yr
- Insurance
- −$125
- HOA
- −$67
- Vacancy / Maint / Mgmt
- −$671
- Net cashflow
- $92
Break-even live
UW: 25.0% down · 7.5% · 30yr · 1.5% tax · 5.0% vac · 8.0% maint · 8.0% mgmt
Financing live
Cash to close
- Down payment
- $74,975
- Closing costs
- $8,997
- Reserves months
- —
- Total cash needed
- —
Loan-product check · same deal, 3 products live
Conventional
25% down · 7.5% · 30yr
- Down + closing
- —
- Monthly P&I
- —
- Monthly cashflow
- —
- DSCR
- —
- Eligible?
- —
Personal DTI + credit; lowest rate.
DSCR
20% down · 8.5% · 30yr
- Down + closing
- —
- Monthly P&I
- —
- Monthly cashflow
- —
- DSCR
- —
- Eligible?
- —
No personal income docs; deal must DSCR.
Hard money
10% down · 12.0% · 12mo
- Down + closing
- —
- Monthly P&I
- —
- Monthly cashflow
- —
- DSCR
- —
- Eligible?
- —
Short-term bridge; refi at stabilization.
Rent comps 9 comps
| Address | Beds | Baths | Sqft | Rent | $/sqft | DOM | Units | Dist |
|---|---|---|---|---|---|---|---|---|
| 16807 Hemlock Grove Dr Humble, TX | 4.0 | 3.0 | 2476 | $3,100 | $1.25 | 44d | 1 | 0.70mi |
| 12731 Arcola Valley Ct Houston, TX | 4.0 | 3.0 | 2663 | $2,716 | $1.02 | 5d | 1 | 0.71mi |
| 15410 Rosehill Summit Ln Houston, TX | 4.0 | 3.0 | 2631 | $5,000 | $1.90 | 1d | 1 | 0.79mi |
| 15614 Countesswells Dr Humble, TX | 4.0 | 2.5 | 2620 | $3,150 | $1.20 | 3d | 1 | 0.87mi |
| 15614 Countesswells Dr Unit NA Humble, TX | 4.0 | 2.5 | 2620 | $3,350 | $1.28 | 44d | 1 | 0.87mi |
| 16614 Spirit Lake Ct Houston, TX | 3.0 | 2.5 | 2374 | $2,395 | $1.01 | 24d | 1 | 0.94mi |
| 16411 Little Pine Creek Dr Humble, TX | 4.0 | 3.0 | 2646 | $2,976 | $1.12 | 5d | 1 | 1.11mi |
| 12643 Jamestown Crossing Ln Humble, TX | 4.0 | 2.0 | 2450 | $4,995 | $2.04 | 24d | 1 | 1.24mi |
| 12323 Crescent Mountain Ln Humble, TX | 3.0 | 2.5 | 2358 | $2,326 | $0.99 | 5d | 1 | 1.49mi |
HOA detail
- Monthly dues
- $67 · $804/yr
- Likely covers
- gaspool
Listing history 8 events
-
2026-06-18days on market $299,900 Active 10 DOM
-
2026-06-17days on market $299,900 Active 9 DOM
-
2026-06-16days on market $299,900 Active 8 DOM
-
2026-06-15days on market $299,900 Active 7 DOM
-
2026-06-13days on market $299,900 Active 5 DOM
-
2026-06-13days on market $299,900 Active 4 DOM
-
2026-06-08remarks 699-char remark
-
2026-06-08$299,900 Active 1 DOM
ⓘ Source: listings_history table (triggers on properties + properties_extension) + one-shot
backfill from property_details.listing_events for pre-trigger history.
Tax reassessment forecast TX · Resets to sale price
- Current annual tax
- $8,002 · $667/mo
- Projected year-2 tax
- $8,002 · $667/mo
- Expected delta
- $0/yr ($0/mo · 0.0%)
ⓘ Screening estimate from a state-policy table — verify with the county assessor before closing.
Climate risk First Street
- Flood 1/10 Low FEMA zone X (unshaded) · 0% chance over 30 yrs
- Wildfire 1/10 Low
- Heat 9/10 Extreme 7 d/yr ≥111°F today · 24 d/yr by 30 yrs out
- Wind 9/10 Extreme 99% chance of damaging wind over 30 yrs
- Air quality 3/10 Moderate 3 unhealthy d/yr today · 3 by 30 yrs out
Nearby sold comps map
Loading sold comps map…
Walkable amenities ~0.75 mi
Loading nearby amenities…
Taxation est. · year 1
- Rental income
- $38,326
- − Mortgage interest
- −$16,799
- − Property taxes
- −$8,002
- − Insurance
- −$1,500
- − Repairs & maintenance
- −$3,066
- − Management
- −$3,066
- − HOA
- −$804
- − Depreciation
- −$8,724
- Taxable loss
- −$3,636
- Est. tax savings @ 24.0%
- +$873
- After-tax cash flow
- $1,972/yr
For passive investors: Depreciation is non-cash, so a rental often shows a tax loss while cash-flowing — sheltering income. Rental losses are passive: they offset passive income freely, and up to $25,000/yr can offset ordinary (W-2) income if you actively participate and your MAGI is under $100k (phasing out to $0 by $150k); unused losses carry forward. On sale, claimed depreciation is recaptured at up to 25%, and gains may owe capital-gains tax (a 1031 exchange can defer both). Figures are a year-1 estimate at your 24.0% rate — not tax advice; consult a CPA.
Schools (NCES district)
- District
- Humble ISD
- NCES district ID
- 4823910
- Math proficiency
- 38% ▼ -11.00%
- Reading proficiency
- 44% ▼ -7.00%
- Median HH income
- $83,946
- Composite
- 38.55/100
- National rank
- #4171
- State rank
- #262 of 826 in TX
Livability — Houston
- Score
- 74/100
- State rank
- #184
- US rank
- #4771
Category grades
Schools grade is shown separately in the Schools card above.
Census & demographics
- Census place
- Houston, TX
- County
- Harris County · 4,702,590 people
- City population
- 3,226,434
- Metro
- Houston-The Woodlands-Sugar Land, TX
- Population (ZIP)
- 58,347
- Household income
- $95,000
- Rent vs Own
- Severe rent burden
- 1332.0
Population outlook (Harris County) Hauer SSP2
- Today (2025)
- 5,571,493 people
- By 2030
- 6,089,821 · +9.3%
- By 2040
- 7,142,806 · +28.2%
- By 2050
- 8,185,864 · +46.9%
- By 2075
- 10,574,329 · +89.8%
- By 2100
- 12,109,958 · +117.4%
Race, ethnicity, and origin ACS 2023
- Neighborhood character
- Diverse neighborhood (Simpson 0.66)
- Race & ethnicity
- Hispanic / Latino 44% Black 32% White 19% Two or more races 18% Native American 2% Asian 1%
- Hispanic origin (detail)
- Mexican 36%
- Common ancestry
- Lithuanian 1% Romanian 1% Iranian 1%
- Foreign-born
- 18% · Canada
- Languages at home
- 61% English-only · Spanish 35% French/Haitian/Cajun 1% Other Indo-European 1%
Political lean MEDSL · Harris
- 2024 margin
- Lean D (+5.5) · D 52.0% · R 46.4% · Other 1.6%
- 2008→2024 swing
- +3.9pp toward D · 2008: 1.6pp · 2024: 5.5pp
- All cycles
- 2024: D+5.5 2020: D+13.3 2016: D+12.4 2012: D+0.1 2008: D+1.6
Not yet ingested
- Civics
- —
Market trends
- HPI YoY
- ▼ -1.59%
- Current HPI
- 215.5736
- Rent YoY
- ▲ 0.92%
- Metro
- Houston-The Woodlands-Sugar Land, TX
- State GDP YoY
- ▲ 3.95%
- F500 in state
- 110
Industry mix (Fortune 500 HQ in TX)
| Industry | F500 HQs | Revenue |
|---|---|---|
| Energy | 16 | $1,198B |
|
||
| Technology | 5 | $198B |
|
||
| Engineering / Construction | 4 | $72B |
|
||
| Energy Services | 3 | $60B |
|
||
| Utilities | 3 | $41B |
|
||
| Healthcare | 2 | $330B |
|
||
Price history
+87.6% since first listed8 events — show timeline
- 2026-06-08 Listed $299,900 HARMLS
- 2020-06-30 Listing Removed — HARMLS
- 2020-05-20 Listed $239,000 HARMLS
- 2019-06-09 Listing Removed — HARMLS
- 2019-05-17 Listed $249,000 HARMLS
- 2015-04-23 Sold (Public Records) — Public Records
- 2012-03-04 Listing Removed — HARMLS
- 2012-01-29 Listed $159,900 HARMLS
Property tax history
+1.3%/yrLatest (2025): $8,002 · +11.3% YoY. Source: county tax records.
Cash-flow waterfall
monthlySold comps — $/sqft
last 12 mo · ≤1 miLoading sold comps…