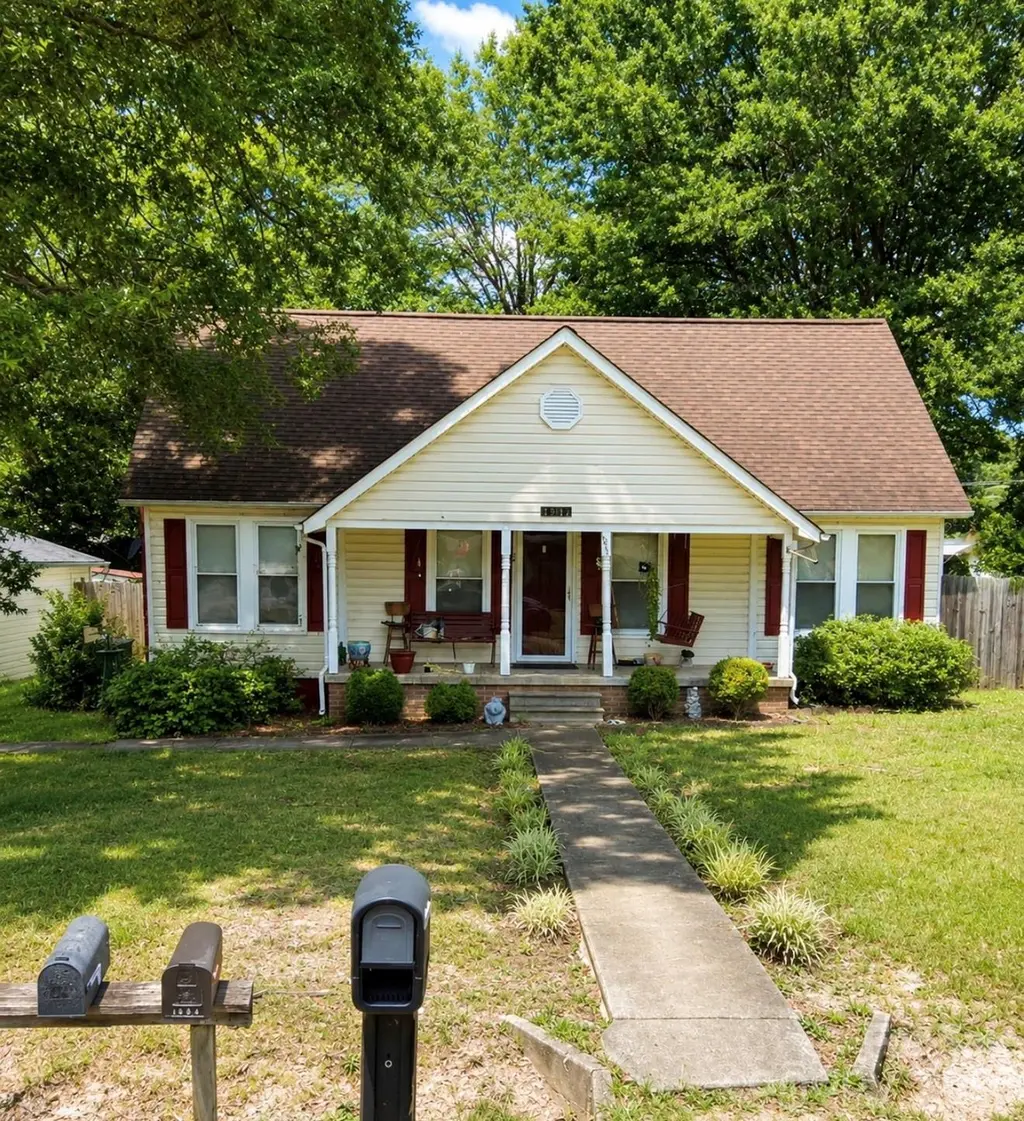
1911 Crestmont Ave · Kannapolis, NC
Flood risk 1/10 · Minimal
- FEMA flood zone
- X (unshaded)
- Chance of flooding over 30 yrs
- 0.0%
- Est. flood insurance / yr
- $507 – $1,088
Fire risk 3/10 · Minor
- Est. fire insurance / yr
- $906 – $1,684
Heat risk 5/10 · Moderate
- Hot days now (above 104°F)
- 7 days/yr
- Hot days in 30 yrs
- 17 days/yr
Wind risk 4/10 · Minor
- Chance of severe wind over 30 yrs
- 15.0%
Air-quality risk 2/10 · Minimal
- Unhealthy air days now
- 1 days/yr
- Unhealthy air days in 30 yrs
- 3 days/yr
Risk factors via First Street. Map © Google.
Why this score? — see what drove the C grade
The composite is a weighted blend of 9 inputs, each scored 0–100. Each bar is that input's sub-score; the figure is the points it added to the 100-point composite (weight × sub-score).
- Cash flow +20.6/30.0
- ARV discount +15.0/15.0
- DSCR +6.6/10.0
- 1% rule +5.1/10.0
- Livability +3.2/5.0
- Rent growth +3.1/5.0
- Schools +2.6/10.0
- Condition / age +2.5/5.0
- Appreciation +0.0/10.0
$180,000
🖨 Deal sheet (PDF) 📄 Offer letter ✓ Due diligence
Listing remarks
Investor opportunity in the rapidly growing Kannapolis market! Situated on an approximately 0.28-acre lot following the proposed subdivision of the current 0.44-acre parcel, this 2-bedroom, 1-bath home presents exceptional potential for investors, renovators, or buyers seeking their next value-add project. Conveniently located with easy access to downtown Kannapolis, shopping, dining, and major commuter routes. Offered below current tax value, this property provides a rare opportunity to capitalize on future upside and redevelopment potential. An additional upper-level finished flex space has previously been utilized as a sleeping area and offers added versatility for a home office, bonus r
Key facts
- 0.28-acre lot
- 0.28 acre lot
- Built 1940
Tags
Property features AI
Finance
- Other: Zoning allows RV; Lot approximately 0.28 acres
- HOA & community: No HOA
Exterior
- Parking: On-street parking; Other parking (see remarks)
- Utilities: Well water and other water source (see remarks); Public sewer; Electricity connected; Propane
- Home design: Single-family residence; One-story; Site-built construction; Aluminum exterior
- Construction: Crawl space foundation
- Exterior features: Shed(s); Publicly maintained paved road; portions listed as none
Interior
- Kitchen: Dishwasher; Electric cooktop
- Bedrooms: Two bedrooms on the main level
- Bathrooms: One full bathroom on the main level
- Heating & cooling: Central heating (natural gas); Central air conditioning
- Interior features: Five total rooms; Main-level rooms
- Laundry & utility: Laundry located on the main level; Electric water heater
Neighborhood map
What this means for you Summary
Snapshot
- This is a 2-bed/1.0-bath single-family listed at $180k.
Deal economics
- At list price, monthly cash flow is $241 ($3k/yr) — positive.
- The deal already cash-flows at list — no discount required.
- Meets the 1% rule at list price ($2k rent vs $180k).
- Recommended offer: $175k (3.0% below list) — sets the bar for market timing.
- Cap rate 7.9% vs local median 3.5% in Kannapolis — top-decile yield for the area; either an underpriced asset or a hidden risk that comps aren't pricing in. Stress-test before assuming the spread holds.
Location & tenants
- Location reads 64/100 on livability (#354 in NC) — a middle-class / working-renter tenant base. Strengths: cost of living A+, housing A+, crime B; Watch: employment D+, amenities F, commute F.
- Rowan-Salisbury Schools (rural): math 26% / reading 35% proficiency, ranked #142 of 178 in NC (top 80%) — families likely to look elsewhere, expect single-tenant / working-renter base with shorter leases.
- Zoned schools: Landis Elementary (math 57% / reading 47%, grade C-, #354 of 1,410 statewide, top 28%, 589 students, 91% FRL); Corriher Lipe Middle (math 26% / reading 30%, grade F, #360 of 475 statewide, top 77%, 476 students, 64% FRL); South Rowan High (math 27% / reading 38%, grade F, #441 of 535 statewide, top 83%, 952 students, 52% FRL).
- Market conditions: Rents rising (+2.5%/yr); 226 active listings in the ZIP; 11 comparable units currently listed for rent nearby; rentals leasing fast (median 13d on market — plan ~1-2 weeks tenant-placement turnaround); 592 units permitted in Rowan County in 2024 (5 in 5+ unit buildings).
- This rent runs 30% of the median local income ($72k/yr) — at the standard rent-burdened threshold; future hikes will face affordability resistance.
Forward outlook
- Local home prices are declining (-3.0%/yr); year-one equity from $1k of loan paydown is wiped out by about $5k of value loss. Plan a longer hold.
- Rowan County population projected to shrink 6% by 2050 — rents likely to lag national; underwrite the cash flow, not the appreciation.
Negotiation context
- It's been on market 37 days — a 3% lower offer ($175k) is reasonable based on typical stale-listing flexibility.
Risks & watch-outs
- Watch-outs: built in 1940 — expect roof / HVAC / electrical / plumbing capex.
- Climate carrying-cost: extreme-heat days projected 7→17/yr by 2055 (HVAC capex compounding) — expect insurance premiums to compound above CPI over the hold.
Questions for the listing agent
- It's been on market 37 days. Have you received any prior offers? Is the seller open to a 3% concession, seller financing, or rate buy-down credit?
- Built in 1940 — when were the roof, HVAC, electrical panel, plumbing, and water heater last replaced?
- Is there a deadline driving the sale (1031 exchange, divorce, estate, relocation)? That informs how much negotiation room exists.
- Schools are F-rated, which usually means shorter tenancies and higher turnover. Who's the typical renter profile here, and what's been the actual vacancy rate?
- What's the average days-on-market for RENTAL listings here right now (not sales)? A rising rental-DOM trend means longer vacancies and softer asking-rent achievability than the comps imply.
- What's the recent tenant-quality profile in this submarket — average credit score on applications, eviction rate, late-payment / NSF rate, and stable-employment percentage? A property-management company in the area should have these aggregated.
- How much new for-sale + rental construction is in the pipeline within 1–3 miles? Heavy new supply typically softens prices + rents 12–24 months out; constrained supply supports both.
Investment metrics
- 1% rule
- 1.01% ✓
- Cap rate
- 7.90%
- Cash-on-cash
- 5.75%
- DSCR
- 1.26
- GRM
- 8.2
CMA / ARV
- ARV (on-the-fly)
- $351,870
- Comps found
- 12
Show comp detail 12 sales within ~0.75 mi
| Address | Dist | Beds/Ba | Sqft | Sold | Price | $/sf | Match |
|---|---|---|---|---|---|---|---|
| 1706 Chapman Ave | 0.23mi | 3/2.0 (+1) | 1,485 (-6%) | 1mo | $329,900 | $222 | 69 |
| Lot 1 Chapman Ave | 0.41mi | 3/2.0 (+1) | 1,553 (-2%) | 1mo | $340,000 | $219 | 68 |
| 821 Alta Way | 0.55mi | 3/2.5 (+1) | 1,518 (-4%) | 2mo | $325,000 | $214 | 55 |
| 362 W 18th St | 0.74mi | 3/2.0 (+1) | 1,532 (-3%) | 1mo | $338,000 | $221 | 50 |
| 344 W 18th St | 0.74mi | 3/2.0 (+1) | 1,532 (-3%) | 2mo | $350,000 | $228 | 49 |
| 332 W 18th St | 0.74mi | 3/2.0 (+1) | 1,532 (-3%) | 2mo | $334,999 | $219 | 49 |
| 1409 Arden Ave | 0.58mi | 3/2.0 (+1) | 1,456 (-8%) | 3mo | $294,900 | $203 | 48 |
| 368 W 18th St | 0.74mi | 3/2.0 (+1) | 1,399 (-12%) | 1mo | $332,000 | $237 | 36 |
| 245 W 18th St | 0.71mi | 3/2.0 (+1) | 1,399 (-12%) | 2mo | $302,499 | $216 | 36 |
| 356 W 18th St | 0.74mi | 3/2.0 (+1) | 1,399 (-12%) | 1mo | $324,799 | $232 | 36 |
| 350 W 18th St | 0.74mi | 3/2.0 (+1) | 1,399 (-12%) | 1mo | $327,900 | $234 | 36 |
| 326 W 18th St | 0.74mi | 3/2.0 (+1) | 1,399 (-12%) | 2mo | $325,000 | $232 | 35 |
Match score weights: distance 35% · size 25% · config 20% · recency 20%. Top-matched comps best support the ARV.
Projected returns pro-forma
-3.0% appreciation · 2.5% rent growth · sell at horizon
- IRR
- -8.0%
- Equity multiple
- 0.71×
- Total profit
- $-14,704
- Equity at exit
- $26,839
- IRR
- 0.9%
- Equity multiple
- 1.07×
- Total profit
- $3,288
- Equity at exit
- $15,563
Cash invested: $50,400 (down + closing). Projections, not guarantees.
Landlord ↔ Tenant lean methodology
- Overall (STATE)
- 85 Strongly Landlord-Friendly
- State North Carolina
- 85 Strongly Landlord-Friendly · R+3
- County
- — inherits STATE
- City
- — inherits STATE
ZIP-level market 28081
- Rents YoY
- 2.5%
- Active inventory
- 226
- Price-to-rent
- 8.2×
Monthly cashflow live
- Estimated rent
- $1,821 high interval (Pro) →
- Mortgage (P&I)
- −$944
- Tax from tax record
- −$179 /mo · $2,143/yr
- Insurance
- −$75
- HOA
- −$0
- Vacancy / Maint / Mgmt
- −$383
- Net cashflow
- $241
Break-even live
Sensitivity live
| Price | -10% $343 | -5% $292 | +0% $241 | +5% $190 | +10% $140 |
|---|---|---|---|---|---|
| Rent | -10% $98 | -5% $169 | +0% $241 | +5% $313 | +10% $385 |
| Rate | -1.0pp $332 | -0.5pp $287 | base $241 | +0.5pp $195 | +1.0pp $147 |
UW: 25.0% down · 7.5% · 30yr · 1.5% tax · 5.0% vac · 8.0% maint · 8.0% mgmt
Financing live
Cash to close
- Down payment
- $45,000
- Closing costs
- $5,400
- Reserves months
- —
- Total cash needed
- —
Loan-product check · same deal, 3 products live
Conventional
25% down · 7.5% · 30yr
- Down + closing
- —
- Monthly P&I
- —
- Monthly cashflow
- —
- DSCR
- —
- Eligible?
- —
Personal DTI + credit; lowest rate.
DSCR
20% down · 8.5% · 30yr
- Down + closing
- —
- Monthly P&I
- —
- Monthly cashflow
- —
- DSCR
- —
- Eligible?
- —
No personal income docs; deal must DSCR.
Hard money
10% down · 12.0% · 12mo
- Down + closing
- —
- Monthly P&I
- —
- Monthly cashflow
- —
- DSCR
- —
- Eligible?
- —
Short-term bridge; refi at stabilization.
Rent comps 11 comps
| Address | Beds | Baths | Sqft | Rent | $/sqft | DOM | Units | Dist |
|---|---|---|---|---|---|---|---|---|
| 371 Copes Ct Kannapolis, NC | 3.0 | 2.5 | 1880 | $2,035 | $1.08 | 14d | 1 | 0.24mi |
| 603 Falls Ln Kannapolis, NC | 3.0 | 2.5 | 2069 | $1,875 | $0.91 | 19d | 1 | 0.37mi |
| 720 Fraternity Row Kannapolis, NC | 3.0 | 3.0 | 1591 | $1,999 | $1.26 | 4d | 1 | 0.51mi |
| 1415 Arden Ave Kannapolis, NC | 3.0 | 2.5 | 1225 | $1,590 | $1.30 | 25d | 1 | 0.54mi |
| 1413 Arden Ave Kannapolis, NC | 3.0 | 2.5 | 1225 | $1,590 | $1.30 | 25d | 1 | 0.55mi |
| 1413 Arden Ave Kannapolis, NC | 3.0 | 2.5 | 1225 | $1,590 | $1.30 | 12d | 1 | 0.55mi |
| 368 W 18th St Kannapolis, NC | 3.0 | 2.0 | 1399 | $1,995 | $1.43 | 6d | 1 | 0.76mi |
| 310 Glenn Ave Kannapolis, NC | 3.0 | 2.5 | 1475 | $2,050 | $1.39 | 6d | 1 | 1.32mi |
| 602 N Juniper Ave Kannapolis, NC | 2.0 | 1.0 | 1200 | $1,300 | $1.08 | 16d | 1 | 1.44mi |
| 1004 Valley St Kannapolis, NC | 2.0 | 2.0 | 1322 | $2,200 | $1.66 | 0d | 1 | 1.47mi |
| 126 Glenn Ave Unit NA Kannapolis, NC | 3.0 | 3.0 | 1541 | $2,250 | $1.46 | 0d | 1 | 1.50mi |
Listing history 16 events
-
2026-06-21days on market $180,000 Active 37 DOM
-
2026-06-18days on market $180,000 Active 34 DOM
-
2026-06-17days on market $180,000 Active 33 DOM
-
2026-06-16days on market $180,000 Active 32 DOM
-
2026-06-15days on market $180,000 Active 31 DOM
-
2026-06-13days on market $180,000 Active 29 DOM
-
2026-06-09days on market $180,000 Active 25 DOM
-
2026-06-08days on market $180,000 Active 24 DOM
-
2026-06-07days on market $180,000 Active 23 DOM
-
2026-06-04days on market $180,000 Active 20 DOM
-
2026-06-03days on market $180,000 Active 19 DOM
-
2026-06-02days on market $180,000 Active 18 DOM
-
2026-06-01days on market $180,000 Active 17 DOM
-
2026-05-31days on market $180,000 Active 16 DOM
-
2026-05-22price $180,000
-
2026-05-15$190,000 Active
ⓘ Source: listings_history table (triggers on properties + properties_extension) + one-shot
backfill from property_details.listing_events for pre-trigger history.
Tax reassessment forecast NC · Resets to sale price
- Current annual tax
- $2,143 · $179/mo
- Projected year-2 tax
- $2,143 · $179/mo
- Expected delta
- $0/yr ($0/mo · 0.0%)
ⓘ Screening estimate from a state-policy table — verify with the county assessor before closing.
Climate risk First Street
- Flood 1/10 Low FEMA zone X (unshaded) · 0% chance over 30 yrs
- Wildfire 3/10 Moderate
- Heat 5/10 Major 7 d/yr ≥104°F today · 17 d/yr by 30 yrs out
- Wind 4/10 Moderate 15% chance of damaging wind over 30 yrs
- Air quality 2/10 Low 1 unhealthy d/yr today · 3 by 30 yrs out
Nearby sold comps map
Loading sold comps map…
Walkable amenities ~0.75 mi
Loading nearby amenities…
Taxation est. · year 1
- Rental income
- $21,858
- − Mortgage interest
- −$10,083
- − Property taxes
- −$2,143
- − Insurance
- −$900
- − Repairs & maintenance
- −$1,749
- − Management
- −$1,749
- − Depreciation
- −$5,236
- Taxable loss
- −$2
- Est. tax savings @ 24.0%
- +$0
- After-tax cash flow
- $2,898/yr
For passive investors: Depreciation is non-cash, so a rental often shows a tax loss while cash-flowing — sheltering income. Rental losses are passive: they offset passive income freely, and up to $25,000/yr can offset ordinary (W-2) income if you actively participate and your MAGI is under $100k (phasing out to $0 by $150k); unused losses carry forward. On sale, claimed depreciation is recaptured at up to 25%, and gains may owe capital-gains tax (a 1031 exchange can defer both). Figures are a year-1 estimate at your 24.0% rate — not tax advice; consult a CPA.
Schools (NCES district)
- District
- Rowan-Salisbury Schools
- NCES district ID
- 3704050
- Math proficiency
- 26% ▲ 2.00%
- Reading proficiency
- 35% ▲ 1.00%
- Median HH income
- $43,953
- Composite
- 26.01/100
- National rank
- #7317
- State rank
- #142 of 178 in NC
Livability — Kannapolis
- Score
- 64/100
- State rank
- #354
- US rank
- #14030
Category grades
Schools grade is shown separately in the Schools card above.
Census & demographics
- Census place
- Kannapolis, NC
- County
- Cabarrus County · 218,793 people
- City population
- 57,170
- Metro
- Charlotte-Concord-Gastonia, NC-SC
- Population (ZIP)
- 29,075
- Household income
- $71,665
- Rent vs Own
- Severe rent burden
- 763.0
Population outlook (Rowan County) Hauer SSP2
- Today (2025)
- 140,430 people
- By 2030
- 140,193 · -0.2%
- By 2040
- 137,617 · -2.0%
- By 2050
- 131,826 · -6.1%
- By 2075
- 115,123 · -18.0%
- By 2100
- 92,774 · -33.9%
Race, ethnicity, and origin ACS 2023
- Neighborhood character
- Majority White (65%)
- Race & ethnicity
- White 65% Black 18% Hispanic / Latino 12% Two or more races 6% Asian 1%
- Hispanic origin (detail)
- Mexican 6%
- Common ancestry
- Slovak 2% Italian 1% Serbian 1%
- Foreign-born
- 8% · Canada, China
- Languages at home
- 88% English-only · Spanish 10% French/Haitian/Cajun 1% Chinese 1%
Political lean MEDSL · Rowan
- 2024 margin
- Solid R (+35.9) · D 31.6% · R 67.5%
- 2008→2024 swing
- -13.1pp toward R · 2008: -22.8pp · 2024: -35.9pp
- All cycles
- 2024: R+35.9 2020: R+35.7 2016: R+36.8 2012: R+26.0 2008: R+22.8
Not yet ingested
- Civics
- —
Market trends
- HPI YoY
- ▼ -202.75%
- Current HPI
- 282.9002
- Rent YoY
- ▲ 2.50%
- Metro
- Charlotte-Concord-Gastonia, NC-SC
- State GDP YoY
- ▲ 3.28%
- F500 in state
- 26
Industry mix (Fortune 500 HQ in NC)
| Industry | F500 HQs | Revenue |
|---|---|---|
| Financial Services | 2 | $213B |
|
||
| Retail | 2 | $95B |
|
||
| Industrial Conglomerate | 1 | $38B |
|
||
| Metals / Steel | 1 | $35B |
|
||
| Utilities | 1 | $30B |
|
||
| Industrial Machinery | 1 | $19B |
|
||
Price history
-5.3% since first listed2 events — show timeline
- 2026-05-22 Price Changed $180,000 CANOPYMLS as Distributed by MLS Grid
- 2026-05-15 Listed $190,000 CANOPYMLS as Distributed by MLS Grid
Property tax history
+6.1%/yrLatest (2025): $2,143 · +0.0% YoY. Source: county tax records.
Cash-flow waterfall
monthlySold comps — $/sqft
last 12 mo · ≤1 miLoading sold comps…