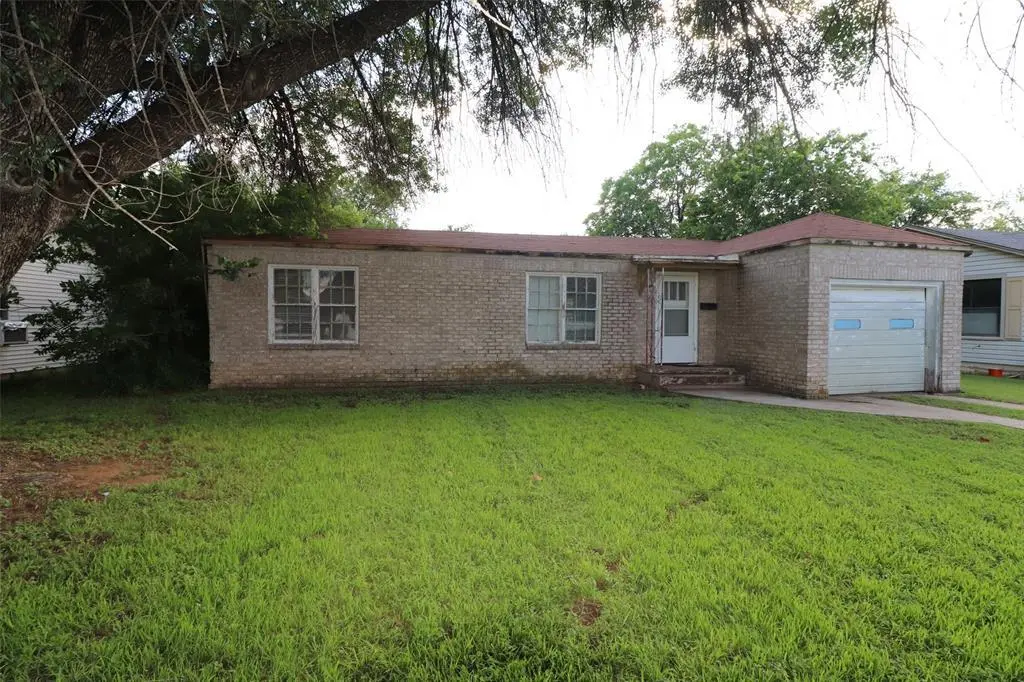
2111 Southside St · Brownwood, TX
Flood risk 1/10 · Minimal
- FEMA flood zone
- X (unshaded)
- Chance of flooding over 30 yrs
- 0.0%
- Est. flood insurance / yr
- $507 – $1,088
Fire risk 5/10 · Moderate
- Est. fire insurance / yr
- $1,222 – $2,270
Heat risk 7/10 · Major
- Hot days now (above 107°F)
- 7 days/yr
- Hot days in 30 yrs
- 23 days/yr
Wind risk 6/10 · Moderate
- Chance of severe wind over 30 yrs
- 27.0%
Air-quality risk 1/10 · Minimal
- Unhealthy air days now
- 0 days/yr
- Unhealthy air days in 30 yrs
- 0 days/yr
Risk factors via First Street. Map © Google.
Why this score? — see what drove the B- grade
The composite is a weighted blend of 9 inputs, each scored 0–100. Each bar is that input's sub-score; the figure is the points it added to the 100-point composite (weight × sub-score).
- Cash flow +30.0/30.0
- 1% rule +10.0/10.0
- DSCR +10.0/10.0
- ARV discount +7.5/15.0
- Schools +3.6/10.0
- Livability +3.2/5.0
- Rent growth +2.5/5.0
- Condition / age +2.5/5.0
- Appreciation +0.0/10.0
$59,000
🖨 Deal sheet 📄 Offer letter ✓ Due diligence
Listing remarks MLS
good location 3br, 1.5ba. all electric per seller, roof 3-4 yrs new, 1 car garage, large backyard, fenced, access from alley if needed.
Key facts
- Large interior lot
- Hardwood floors
- 0.25 acre lot
Tags
Property features AI
Finance
- Financial info: Listing accepts Cash and Conventional offers; Treat as clear loan type
- HOA & community: No association
Exterior
- Parking: Covered parking (1 space); Driveway; Attached garage; Garage faces front; 2-car single door garage (1 garage space, approx. 10' x 19')
- Utilities: City water; City sewer; Electricity connected; Individual water meter; Alley access; Located in a municipal utility district
- Home design: Single family residence; One story
- Construction: Wood construction; Composition roof; Pillar/post/pier foundation; Built in 1950
- Exterior features: Front porch; Storm cellar; Chain link fence; Few trees; Interior lot
Interior
- Kitchen: Electric range; Electric water heater
- Bedrooms: 3 bedrooms (all on main level); Primary bedroom on main level
- Flooring: Hardwood; Linoleum
- Bathrooms: 1 full bathroom; 1 half bathroom
- Interior features: Eat-in kitchen; Two living areas; One dining area; 8 total rooms
- Laundry & utility: Laundry in garage
Neighborhood map
What this means for you Summary
Snapshot
- This is a 3-bed/2.0-bath single-family listed at $59k.
Deal economics
- At list price, monthly cash flow is $582 ($7k/yr) — positive.
- The deal already cash-flows at list — no discount required.
- Meets the 1% rule at list price ($1k rent vs $59k).
- Cap rate 18.1% vs local median 3.7% in Brownwood — top-decile yield for the area; either an underpriced asset or a hidden risk that comps aren't pricing in. Stress-test before assuming the spread holds.
Location & tenants
- Location reads 64/100 on livability (#781 in TX) — a middle-class / working-renter tenant base. Strengths: cost of living A+, housing A+; Watch: crime D+, health & safety D+, amenities F.
- Brownwood ISD (town): math 45% / reading 41% proficiency, ranked #344 of 826 in TX (top 42%) — families likely to look elsewhere, expect single-tenant / working-renter base with shorter leases.
- Zoned schools: Coggin El (math 45% / reading 34%, grade F, #1,545 of 4,322 statewide, top 38%, 708 students, 79% FRL) — zoned schools average 79% FRL vs 54% district-wide (25 pts higher); higher-poverty schools than district average — tighter screening recommended.
- Market conditions: 377 active listings in the ZIP; 4 comparable units currently listed for rent nearby; rentals lingering (median 44d on market — plan ~5-8 weeks vacancy on turnover, expect pricing pressure); 100% of comp listings sitting > 30 days — soft ceiling on asking rent; 142 units permitted in Brown County in 2024 (0 in 5+ unit buildings).
Forward outlook
- Local home prices are declining (-3.0%/yr); year-one equity from $408 of loan paydown is wiped out by about $2k of value loss. Plan a longer hold.
- At projected returns (-3.0% appreciation + 3.0% rent growth), your $17k cash investment doubles in ~3 years — after that, you're playing with house money.
Negotiation context
- Only 5 days on market — expect competitive offers; lowballing is unlikely to land.
- 2 sale attempts since 13y ago with the ask held roughly flat each time — persistent listings suggest the price (not the market) is what's stuck; bring a comps-based counter.
Risks & watch-outs
- Watch-outs: property tax is 3.1% of price; built in 1950 — expect roof / HVAC / electrical / plumbing capex.
- Climate carrying-cost: major wind risk, 27% chance of damaging wind over 30y; moderate wildfire risk; extreme-heat days projected 7→23/yr by 2055 (HVAC capex compounding) — expect insurance premiums to compound above CPI over the hold.
Questions for the listing agent
- Built in 1950 — when were the roof, HVAC, electrical panel, plumbing, and water heater last replaced?
- Property tax is high relative to price — has the assessment been appealed recently, and will the sale trigger a re-assessment?
- Is there a deadline driving the sale (1031 exchange, divorce, estate, relocation)? That informs how much negotiation room exists.
- Schools are F-rated, which usually means shorter tenancies and higher turnover. Who's the typical renter profile here, and what's been the actual vacancy rate?
- Crime grade is D in this area — have there been break-ins, vandalism, or insurance claims at this property in the last 3 years? What carrier currently insures it and at what premium?
- What's the average days-on-market for RENTAL listings here right now (not sales)? A rising rental-DOM trend means longer vacancies and softer asking-rent achievability than the comps imply.
- What's the recent tenant-quality profile in this submarket — average credit score on applications, eviction rate, late-payment / NSF rate, and stable-employment percentage? A property-management company in the area should have these aggregated.
- How much new for-sale + rental construction is in the pipeline within 1–3 miles? Heavy new supply typically softens prices + rents 12–24 months out; constrained supply supports both.
Investment metrics
- 1% rule
- 2.29% ✓
- Cap rate
- 18.12%
- Cash-on-cash
- 42.25%
- DSCR
- 2.88
- GRM
- 3.6
CMA / ARV
- ARV (on-the-fly)
- $167,152
- Comps found
- 12
Show comp detail 12 sales within ~0.75 mi
| Address | Dist | Beds/Ba | Sqft | Sold | Price | $/sf | Match |
|---|---|---|---|---|---|---|---|
| 2501 Greenway Dr | 0.31mi | 3/2.0 | 1,363 (+1%) | 2mo | $209,000 | $153 | 82 |
| 2302 Berkley St | 0.14mi | 3/1.0 | 1,276 (-5%) | 1mo | $178,000 | $139 | 80 |
| 1801 6th St | 0.31mi | 3/1.0 | 1,363 (+1%) | 2mo | $143,500 | $105 | 79 |
| 2400 Belmeade Ave | 0.23mi | 3/1.0 | 1,420 (+5%) | 1mo | $149,000 | $105 | 76 |
| 1811 4th St | 0.26mi | 3/1.0 | 1,460 (+8%) | 3mo | $94,900 | $65 | 68 |
| 1609 2nd St | 0.51mi | 3/2.0 | 1,300 (-4%) | 4mo | $220,000 | $169 | 67 |
| 2306 Austin Ave | 0.49mi | 3/2.0 | 1,260 (-6%) | 1mo | $204,000 | $162 | 66 |
| 1012 Avenue K | 0.46mi | 3/2.0 | 1,442 (+7%) | 4mo | $150,000 | $104 | 64 |
| 2301 Berkley St | 0.13mi | 4/2.0 (+1) | 1,535 (+14%) | 3mo | $222,500 | $145 | 63 |
| 1201 8th St | 0.74mi | 3/2.0 | 1,372 (+2%) | 1mo | $129,850 | $95 | 62 |
| 2607 1st St | 0.45mi | 3/1.0 | 1,247 (-8%) | 3mo | $142,500 | $114 | 60 |
| 2711 Elizabeth Dr | 0.54mi | 3/1.0 | 1,200 (-11%) | 3mo | $149,000 | $124 | 50 |
Match score weights: distance 35% · size 25% · config 20% · recency 20%. Top-matched comps best support the ARV.
Projected returns pro-forma
-3.0% appreciation · 3.0% rent growth · sell at horizon
- IRR
- 39.0%
- Equity multiple
- 2.67×
- Total profit
- $27,552
- Equity at exit
- $8,797
- IRR
- 45.5%
- Equity multiple
- 5.36×
- Total profit
- $71,973
- Equity at exit
- $5,101
Cash invested: $16,520 (down + closing). Projections, not guarantees.
Landlord ↔ Tenant lean methodology
- Overall (STATE)
- 87 Strongly Landlord-Friendly
- State Texas
- 87 Strongly Landlord-Friendly · R+5
- County
- — inherits STATE
- City
- — inherits STATE
ZIP-level market 76801
- Active inventory
- 377
- Price-to-rent
- 3.6×
Monthly cashflow live
- Estimated rent
- $1,353 medium interval (Pro) →
- Mortgage (P&I)
- −$309
- Tax from tax record
- −$153 /mo · $1,839/yr
- Insurance
- −$25
- HOA
- −$0
- Vacancy / Maint / Mgmt
- −$284
- Net cashflow
- $582
Break-even live
UW: 25.0% down · 7.5% · 30yr · 1.5% tax · 5.0% vac · 8.0% maint · 8.0% mgmt
Financing live
Cash to close
- Down payment
- $14,750
- Closing costs
- $1,770
- Reserves months
- —
- Total cash needed
- —
Loan-product check · same deal, 3 products live
Conventional
25% down · 7.5% · 30yr
- Down + closing
- —
- Monthly P&I
- —
- Monthly cashflow
- —
- DSCR
- —
- Eligible?
- —
Personal DTI + credit; lowest rate.
DSCR
20% down · 8.5% · 30yr
- Down + closing
- —
- Monthly P&I
- —
- Monthly cashflow
- —
- DSCR
- —
- Eligible?
- —
No personal income docs; deal must DSCR.
Hard money
10% down · 12.0% · 12mo
- Down + closing
- —
- Monthly P&I
- —
- Monthly cashflow
- —
- DSCR
- —
- Eligible?
- —
Short-term bridge; refi at stabilization.
Rent comps 4 comps
| Address | Beds | Baths | Sqft | Rent | $/sqft | DOM | Units | Dist |
|---|---|---|---|---|---|---|---|---|
| 2411 13th St Brownwood, TX | 3.0 | 2.0 | 1466 | $1,800 | $1.23 | 43d | 1 | 0.71mi |
| 2001 Brady Ave Unit Booker 703 Brownwood, TX | 2.0 | 1.0 | 1247 | $1,045 | $0.84 | 43d | 1 | 1.00mi |
| 2001 Brady Ave Unit 1705 Austin-A Brownwood, TX | 2.0 | 1.0 | 1070 | $1,095 | $1.02 | 43d | 1 | 1.00mi |
| 3201 Stephen F Austin Dr Lot 130 Brownwood, TX | 3.0 | 2.0 | 1120 | $1,200 | $1.07 | 43d | 1 | 1.41mi |
Listing history 10 events
-
2026-06-03status $59,000 Pending 5 DOM
-
2026-06-02days on market $59,000 Active 5 DOM
-
2026-06-01days on market $59,000 Active 4 DOM
-
2026-05-31days on market $59,000 Active 3 DOM
-
2026-05-28$59,000 Active
-
2013-06-28soldstatus 135-char remark
Show marketing remark (135 chars)
good location 3br, 1.5ba. all electric per seller, roof 3-4 yrs new, 1 car garage, large backyard, fenced, access from alley if needed.
-
2013-06-28soldstatus
Show marketing remark (135 chars)
good location 3br, 1.5ba. all electric per seller, roof 3-4 yrs new, 1 car garage, large backyard, fenced, access from alley if needed.
-
2013-06-06historical 135-char remark
Show marketing remark (135 chars)
good location 3br, 1.5ba. all electric per seller, roof 3-4 yrs new, 1 car garage, large backyard, fenced, access from alley if needed.
-
2013-05-07$46,900 135-char remark
Show marketing remark (135 chars)
good location 3br, 1.5ba. all electric per seller, roof 3-4 yrs new, 1 car garage, large backyard, fenced, access from alley if needed.
-
1997-04-30soldstatus
ⓘ Source: listings_history table (triggers on properties + properties_extension) + one-shot
backfill from property_details.listing_events for pre-trigger history.
Tax reassessment forecast TX · Resets to sale price
- Current annual tax
- $1,839 · $153/mo
- Projected year-2 tax
- $1,839 · $153/mo
- Expected delta
- $0/yr ($0/mo · 0.0%)
ⓘ Screening estimate from a state-policy table — verify with the county assessor before closing.
Climate risk First Street
- Flood 1/10 Low FEMA zone X (unshaded) · 0% chance over 30 yrs
- Wildfire 5/10 Major
- Heat 7/10 Severe 7 d/yr ≥107°F today · 23 d/yr by 30 yrs out
- Wind 6/10 Major 27% chance of damaging wind over 30 yrs
- Air quality 1/10 Low 0 unhealthy d/yr today · 0 by 30 yrs out
Nearby sold comps map
Loading sold comps map…
Walkable amenities ~0.75 mi
Loading nearby amenities…
Taxation est. · year 1
- Rental income
- $16,236
- − Mortgage interest
- −$3,305
- − Property taxes
- −$1,839
- − Insurance
- −$295
- − Repairs & maintenance
- −$1,299
- − Management
- −$1,299
- − Depreciation
- −$1,716
- Taxable income
- $6,483
- Est. tax owed @ 24.0%
- −$1,556
- After-tax cash flow
- $5,424/yr
For passive investors: Depreciation is non-cash, so a rental often shows a tax loss while cash-flowing — sheltering income. Rental losses are passive: they offset passive income freely, and up to $25,000/yr can offset ordinary (W-2) income if you actively participate and your MAGI is under $100k (phasing out to $0 by $150k); unused losses carry forward. On sale, claimed depreciation is recaptured at up to 25%, and gains may owe capital-gains tax (a 1031 exchange can defer both). Figures are a year-1 estimate at your 24.0% rate — not tax advice; consult a CPA.
Schools (NCES district)
- District
- Brownwood ISD
- NCES district ID
- 4811700
- Math proficiency
- 45% ▲ 4.00%
- Reading proficiency
- 41% ▲ 1.00%
- Median HH income
- $37,395
- Composite
- 35.8/100
- National rank
- #4833
- State rank
- #344 of 826 in TX
Livability — Brownwood
- Score
- 64/100
- State rank
- #781
- US rank
- #14230
Category grades
Schools grade is shown separately in the Schools card above.
Census & demographics
- Census place
- Brownwood, TX
- Population (ZIP)
- 25,152
Population outlook (Brown County) Hauer SSP2
- Today (2025)
- 38,381 people
- By 2030
- 38,288 · -0.2%
- By 2040
- 38,120 · -0.7%
- By 2050
- 38,227 · -0.4%
- By 2075
- 39,362 · +2.6%
- By 2100
- 39,171 · +2.1%
Race, ethnicity, and origin ACS 2023
- Neighborhood character
- Predominantly White (66%)
- Race & ethnicity
- White 66% Hispanic / Latino 26% Two or more races 15% Black 4%
- Hispanic origin (detail)
- Mexican 23%
- Common ancestry
- Italian 12% Slovak 2% Lithuanian 1%
- Foreign-born
- 4% · Canada
- Languages at home
- 82% English-only · Spanish 17%
Political lean MEDSL · Brown
- 2024 margin
- Solid R (+73.9) · D 12.7% · R 86.6%
- 2008→2024 swing
- -12.5pp toward R · 2008: -61.5pp · 2024: -73.9pp
- All cycles
- 2024: R+73.9 2020: R+72.6 2016: R+74.5 2012: R+71.7 2008: R+61.5
Not yet ingested
- Civics
- —
Market trends
- HPI YoY
- ▼ -121.52%
- Current HPI
- 164.0992
- Rent YoY
- —
- Metro
- —
- State GDP YoY
- ▲ 3.95%
- F500 in state
- 110
Industry mix (Fortune 500 HQ in TX)
| Industry | F500 HQs | Revenue |
|---|---|---|
| Energy | 16 | $1,198B |
|
||
| Technology | 5 | $198B |
|
||
| Engineering / Construction | 4 | $72B |
|
||
| Energy Services | 3 | $60B |
|
||
| Utilities | 3 | $41B |
|
||
| Healthcare | 2 | $330B |
|
||
Price history
+25.8% since first listed6 events — show timeline
- 2026-05-28 Listed $59,000 NTREIS
- 2013-06-28 Sold (Public Records) — Public Records
- 2013-06-28 Sold (MLS) — NTREIS
- 2013-06-06 Listing Removed — NTREIS
- 2013-05-07 Listed $46,900 NTREIS
- 1997-04-30 Sold (Public Records) — Public Records
Property tax history
+3.4%/yrLatest (2025): $1,839 · +6.2% YoY. Source: county tax records.
Cash-flow waterfall
monthlySold comps — $/sqft
last 12 mo · ≤1 miLoading sold comps…