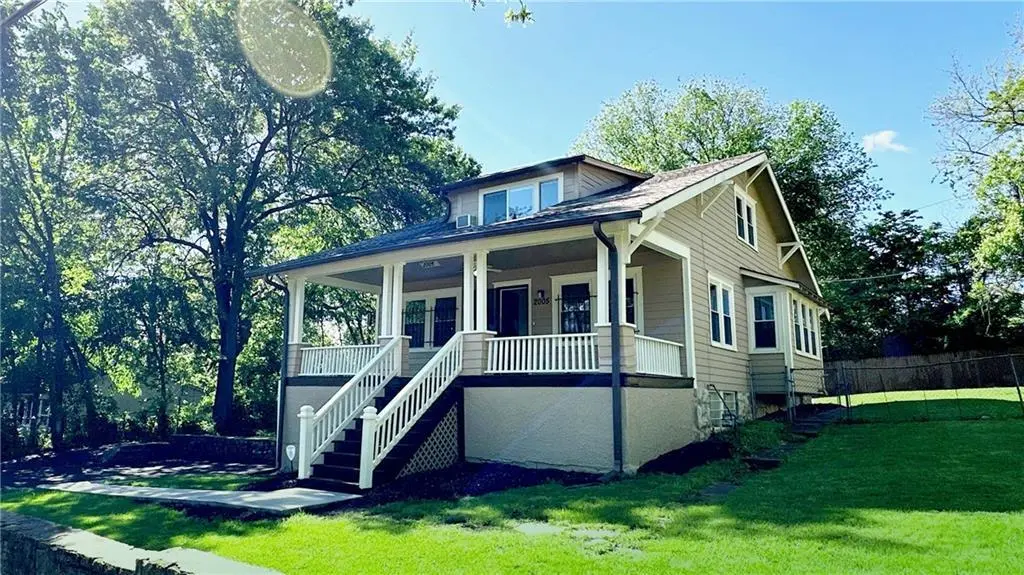
2005 E 81st St · Kansas City, MO
Flood risk 1/10 · Minimal
- FEMA flood zone
- X (unshaded)
- Chance of flooding over 30 yrs
- 0.0%
- Est. flood insurance / yr
- $473 – $860
Fire risk 1/10 · Minimal
- Est. fire insurance / yr
- $1,054 – $1,958
Heat risk 4/10 · Minor
- Hot days now (above 107°F)
- 7 days/yr
- Hot days in 30 yrs
- 17 days/yr
Wind risk 2/10 · Minimal
- Chance of severe wind over 30 yrs
- —
Air-quality risk 3/10 · Minor
- Unhealthy air days now
- 2 days/yr
- Unhealthy air days in 30 yrs
- 4 days/yr
Risk factors via First Street. Map © Google.
Why this score? — see what drove the C grade
The composite is a weighted blend of 9 inputs, each scored 0–100. Each bar is that input's sub-score; the figure is the points it added to the 100-point composite (weight × sub-score).
- Cash flow +20.7/30.0
- Appreciation +10.0/10.0
- DSCR +6.6/10.0
- ARV discount +4.9/15.0
- 1% rule +4.4/10.0
- Livability +3.9/5.0
- Rent growth +3.2/5.0
- Condition / age +2.5/5.0
- Schools +1.8/10.0
$157,000
🖨 Deal sheet (PDF) 📄 Offer letter ✓ Due diligence
Listing remarks MLS
"AS IS WHERE IS" THIS WILL MAKE A GREAT INVESTMENT . NICE HARDWOOD FLOORS.
Key facts
- Natural woodwork
- Spacious yard
- Generous storage
Tags
Property features AI
Finance
- Other: Not in a flood plain; Lot dimensions approximately 107 x 110 (4,237 sq ft); Above-grade finished area reported by appraiser
Exterior
- Parking: Attached garage (1 car)
- Utilities: Public water; Public sewer
- Home design: Single-family residence; Residential property; 1.5-story floor plan; Home faces north
- Construction: Wood siding exterior; Composition roof
- Exterior features: Porch; Partial fencing; City lot
Interior
- Kitchen: Kitchen with vinyl flooring
- Bedrooms: 3 bedrooms (one on first floor, one on second floor)
- Flooring: Carpet; Wood; Vinyl in kitchen and bathrooms/other rooms
- Bathrooms: 2 full bathrooms (one on first floor, one on second floor); Basement access to garage from finished area
- Heating & cooling: Natural gas heating; Electric cooling
- Interior features: Exhaust fan; Formal dining area; Family room
- Laundry & utility: Laundry located in basement
Neighborhood map
What this means for you Summary
Snapshot
- This is a 3-bed/2.0-bath single-family listed at $157k.
Deal economics
- At list price, monthly cash flow is $212 ($3k/yr) — positive.
- The deal already cash-flows at list — no discount required.
- To meet the 1% rule (rent ≥ 1% of price), the offer needs to be $148k (5.5% below list).
- Recommended offer: $148k (5.5% below list) — sets the bar for 1% rule.
- Cap rate 7.9% vs local median 3.9% in Kansas City — top-decile yield for the area; either an underpriced asset or a hidden risk that comps aren't pricing in. Stress-test before assuming the spread holds.
Location & tenants
- Location reads 78/100 on livability (#28 in MO, #2,671 nationally) — a middle-class / working-renter tenant base. Strengths: amenities A+, commute A+, cost of living A+; Watch: schools C-, crime F.
- Center 58 (urban): math 12% / reading 29% proficiency, ranked #301 of 324 in MO (top 93%) — low school quality limits family demand, transient renter base, plan for 1-2y turnover; 63% free/reduced lunch — lower-income household profile, screen leases tightly.
- Market conditions: Rents rising (+3.0%/yr); 94 active listings in the ZIP; 14 comparable units currently listed for rent nearby; rentals at typical pace (median 23d on market — plan ~3-4 weeks tenant-placement turnaround); 4,002 units permitted in Jackson County in 2024 (2,271 in 5+ unit buildings).
- This rent runs 39% of the median local income ($46k/yr) — at the standard rent-burdened threshold; future hikes will face affordability resistance.
Forward outlook
- In year one you build about $17k of equity ($1k loan paydown + $16k appreciation (10.0% local appreciation)).
- Jackson County population projected at +4% by 2050 — modest demand growth; plan on rents tracking national, not racing it.
- At projected returns (10.0% appreciation + 3.0% rent growth), your $44k cash investment doubles in ~3 years — after that, you're playing with house money.
- By year 3, paydown + projected appreciation supports a ~$42k cash-out refi (75% LTV) — recoverable capital for the next deal without selling this one.
Negotiation context
- Only 3 days on market — expect competitive offers; lowballing is unlikely to land.
- 5 sale attempts since 19y ago with the ask held roughly flat each time — persistent listings suggest the price (not the market) is what's stuck; bring a comps-based counter.
Risks & watch-outs
- Watch-outs: built in 1923 — expect roof / HVAC / electrical / plumbing capex.
Questions for the listing agent
- Built in 1923 — when were the roof, HVAC, electrical panel, plumbing, and water heater last replaced?
- Is there a deadline driving the sale (1031 exchange, divorce, estate, relocation)? That informs how much negotiation room exists.
- Crime grade is F in this area — have there been break-ins, vandalism, or insurance claims at this property in the last 3 years? What carrier currently insures it and at what premium?
- What's the average days-on-market for RENTAL listings here right now (not sales)? A rising rental-DOM trend means longer vacancies and softer asking-rent achievability than the comps imply.
- What's the recent tenant-quality profile in this submarket — average credit score on applications, eviction rate, late-payment / NSF rate, and stable-employment percentage? A property-management company in the area should have these aggregated.
- How much new for-sale + rental construction is in the pipeline within 1–3 miles? Heavy new supply typically softens prices + rents 12–24 months out; constrained supply supports both.
Investment metrics
- 1% rule
- 0.94% ✗
- Cap rate
- 7.91%
- Cash-on-cash
- 5.79%
- DSCR
- 1.26
- GRM
- 8.8
CMA / ARV
- ARV (median comp)
- $148,317
- List price
- $157,000
- Delta
- 5.85%
- Verdict
- FAIR
- Comps
- 20 within 1.0 mi
Show comp detail 12 sales within ~0.75 mi
| Address | Dist | Beds/Ba | Sqft | Sold | Price | $/sf | Match |
|---|---|---|---|---|---|---|---|
| 2005 E 81st St | 0.00mi | 3/2.0 | 1,648 (+3%) | 0mo | $157,000 | $95 | 94 |
| 1851 E 85th St | 0.49mi | 3/1.5 | 1,627 (+2%) | 2mo | $150,000 | $92 | 70 |
| 7703 Brooklyn Ave | 0.52mi | 3/2.0 | 1,584 (-1%) | 6mo | $245,000 | $155 | 70 |
| 8401 Paseo Blvd | 0.39mi | 3/1.0 | 1,482 (-7%) | 0mo | $135,000 | $91 | 65 |
| 8401 Wayne Ave | 0.41mi | 3/2.0 | 1,436 (-10%) | 2mo | $180,000 | $125 | 62 |
| 7570 Olive St | 0.64mi | 3/1.0 | 1,520 (-5%) | 3mo | $150,000 | $99 | 56 |
| 1816 E 75th Ter | 0.74mi | 3/2.0 | 1,658 (+4%) | 4mo | $129,900 | $78 | 55 |
| 1174 E 77th St | 0.70mi | 3/2.0 | 1,704 (+7%) | 1mo | $160,000 | $94 | 55 |
| 1415 E 76th Ter | 0.67mi | 3/1.5 | 1,664 (+4%) | 6mo | $149,000 | $90 | 55 |
| 2129 E 77th Ter | 0.41mi | 4/1.0 (+1) | 1,404 (-12%) | 4mo | $90,000 | $64 | 48 |
| 1340 E 85th St | 0.60mi | 3/2.0 | 1,382 (-13%) | 2mo | $115,000 | $83 | 48 |
| 1719 E 76th St | 0.65mi | 3/1.5 | 1,797 (+13%) | 4mo | $205,000 | $114 | 43 |
Match score weights: distance 35% · size 25% · config 20% · recency 20%. Top-matched comps best support the ARV.
Projected returns pro-forma
10.0% appreciation · 2.98% rent growth · sell at horizon
- IRR
- 28.5%
- Equity multiple
- 3.25×
- Total profit
- $98,936
- Equity at exit
- $141,438
- IRR
- 24.8%
- Equity multiple
- 7.38×
- Total profit
- $280,553
- Equity at exit
- $305,016
Cash invested: $43,960 (down + closing). Projections, not guarantees.
Landlord ↔ Tenant lean methodology
- Overall (STATE)
- 81 Strongly Landlord-Friendly
- State Missouri
- 81 Strongly Landlord-Friendly · R+10
- County
- — inherits STATE
- City
- — inherits STATE
ZIP-level market 64132
- Home prices YoY
- 23.6%
- Rents YoY
- 3.0%
- Active inventory
- 94
- Price-to-rent
- 8.8×
Monthly cashflow live
- Estimated rent
- $1,483 high interval (Pro) →
- Mortgage (P&I)
- −$823
- Tax from tax record
- −$71 /mo · $851/yr
- Insurance
- −$65
- HOA
- −$0
- Vacancy / Maint / Mgmt
- −$311
- Net cashflow
- $212
Break-even live
Sensitivity live
| Price | -10% $301 | -5% $257 | +0% $212 | +5% $168 | +10% $123 |
|---|---|---|---|---|---|
| Rent | -10% $95 | -5% $154 | +0% $212 | +5% $271 | +10% $329 |
| Rate | -1.0pp $291 | -0.5pp $252 | base $212 | +0.5pp $172 | +1.0pp $130 |
UW: 25.0% down · 7.5% · 30yr · 1.5% tax · 5.0% vac · 8.0% maint · 8.0% mgmt
Financing live
Cash to close
- Down payment
- $39,250
- Closing costs
- $4,710
- Reserves months
- —
- Total cash needed
- —
Loan-product check · same deal, 3 products live
Conventional
25% down · 7.5% · 30yr
- Down + closing
- —
- Monthly P&I
- —
- Monthly cashflow
- —
- DSCR
- —
- Eligible?
- —
Personal DTI + credit; lowest rate.
DSCR
20% down · 8.5% · 30yr
- Down + closing
- —
- Monthly P&I
- —
- Monthly cashflow
- —
- DSCR
- —
- Eligible?
- —
No personal income docs; deal must DSCR.
Hard money
10% down · 12.0% · 12mo
- Down + closing
- —
- Monthly P&I
- —
- Monthly cashflow
- —
- DSCR
- —
- Eligible?
- —
Short-term bridge; refi at stabilization.
Rent comps 14 comps
| Address | Beds | Baths | Sqft | Rent | $/sqft | DOM | Units | Dist |
|---|---|---|---|---|---|---|---|---|
| 1836 E 77th St Kansas City, MO | 2.0 | 1.0 | 1200 | $1,150 | $0.96 | 22d | 1 | 0.50mi |
| 1827 E 75th Ter Kansas City, MO | 3.0 | 1.5 | 1700 | $1,595 | $0.94 | 17d | 1 | 0.68mi |
| 8101 Campbell St Kansas City, MO | 2.0 | 1.0 | 820 | $888 | $1.08 | 3d | 1 | 0.77mi |
| 7316 Paseo Blvd Kansas City, MO | 3.0 | 1.5 | 1882 | $1,523 | $0.81 | 45d | 1 | 0.99mi |
| 2607 E 73rd St Kansas City, MO | 2.0 | 1.0 | 1212 | $1,050 | $0.87 | 25d | 1 | 1.06mi |
| 7426 Indiana Ave Kansas City, MO | 3.0 | 1.0 | 1100 | $1,400 | $1.27 | 45d | 1 | 1.15mi |
| 7240 Agnes Ave Kansas City, MO | 3.0 | 1.0 | 1140 | $1,350 | $1.18 | 3d | 1 | 1.18mi |
| 320 E 79th Ter Kansas City, MO | 3.0 | 1.0 | 1100 | $1,700 | $1.55 | 45d | 1 | 1.19mi |
| 8104 McGee St Kansas City, MO | 2.0 | 1.0 | 1100 | $1,350 | $1.23 | 25d | 1 | 1.25mi |
| 8701 Chestnut Cir Kansas City, MO | 1.0–2.0 | 1.0–2.0 | 925 | $1,115 | $1.21 | 3d | 15 | 1.29mi |
| 7133 Agnes Ave Kansas City, MO | 3.0 | 2.0 | 1100 | $1,645 | $1.50 | 25d | 1 | 1.32mi |
| 822 E 72nd St Kansas City, MO | 3.0 | 3.0 | 1800 | $2,400 | $1.33 | 22d | 1 | 1.39mi |
| 7022 S Benton Ave Kansas City, MO | 3.0 | 1.5 | 1100 | $1,095 | $1.00 | 16d | 1 | 1.41mi |
| 11 W 80th St Kansas City, MO | 4.0 | 3.5 | 1369 | $2,600 | $1.90 | 3d | 1 | 1.45mi |
Listing history 9 events
-
2026-05-09status Pending 770-char remark
-
2026-05-06$157,000 Active 770-char remark
-
2009-04-16soldstatus 84-char remark
Show marketing remark (84 chars)
"AS IS WHERE IS" THIS WILL MAKE A GREAT INVESTMENT . NICE HARDWOOD FLOORS.
-
2009-04-02$8,000 84-char remark
Show marketing remark (84 chars)
"AS IS WHERE IS" THIS WILL MAKE A GREAT INVESTMENT . NICE HARDWOOD FLOORS.
-
2008-12-16historical
Show marketing remark (216 chars)
This is a terrific value! Fabulous, move-in ready, gleaming hardwoods, updates galore, well-maintained, neutral colors, newer electrical and roof! Huge price reduction, possible owner financing or rent to own, hurry!
-
2008-07-15$69,900
Show marketing remark (216 chars)
This is a terrific value! Fabulous, move-in ready, gleaming hardwoods, updates galore, well-maintained, neutral colors, newer electrical and roof! Huge price reduction, possible owner financing or rent to own, hurry!
-
2008-01-04$79,900
-
2007-09-15$89,500
-
1993-08-09soldstatus
ⓘ Source: listings_history table (triggers on properties + properties_extension) + one-shot
backfill from property_details.listing_events for pre-trigger history.
Tax reassessment forecast MO · Resets to sale price
- Current annual tax
- $851 · $71/mo
- Projected year-2 tax
- $1,523 · $127/mo
- Expected delta
- +$672/yr (+$56/mo · 79.0%)
ⓘ Screening estimate from a state-policy table — verify with the county assessor before closing.
Climate risk First Street
- Flood 1/10 Low FEMA zone X (unshaded) · 0% chance over 30 yrs
- Wildfire 1/10 Low
- Heat 4/10 Moderate 7 d/yr ≥107°F today · 17 d/yr by 30 yrs out
- Wind 2/10 Low
- Air quality 3/10 Moderate 2 unhealthy d/yr today · 4 by 30 yrs out
Nearby sold comps map
Loading sold comps map…
Walkable amenities ~0.75 mi
Loading nearby amenities…
Taxation est. · year 1
- Rental income
- $17,800
- − Mortgage interest
- −$8,794
- − Property taxes
- −$851
- − Insurance
- −$785
- − Repairs & maintenance
- −$1,424
- − Management
- −$1,424
- − Depreciation
- −$4,567
- Taxable loss
- −$46
- Est. tax savings @ 24.0%
- +$11
- After-tax cash flow
- $2,557/yr
For passive investors: Depreciation is non-cash, so a rental often shows a tax loss while cash-flowing — sheltering income. Rental losses are passive: they offset passive income freely, and up to $25,000/yr can offset ordinary (W-2) income if you actively participate and your MAGI is under $100k (phasing out to $0 by $150k); unused losses carry forward. On sale, claimed depreciation is recaptured at up to 25%, and gains may owe capital-gains tax (a 1031 exchange can defer both). Figures are a year-1 estimate at your 24.0% rate — not tax advice; consult a CPA.
Schools (NCES district)
- District
- Center 58
- NCES district ID
- 2908250
- Math proficiency
- 12% ▼ -15.00%
- Reading proficiency
- 29% ▼ -6.00%
- Median HH income
- $43,544
- Composite
- 17.64/100
- National rank
- #9031
- State rank
- #301 of 324 in MO
Livability — Kansas City
- Score
- 78/100
- State rank
- #28
- US rank
- #2671
Category grades
Schools grade is shown separately in the Schools card above.
Census & demographics
- Census place
- Kansas City, MO
- County
- Jackson County · 687,798 people
- City population
- 439,467
- Metro
- Kansas City, MO-KS
- Population (ZIP)
- 12,084
- Household income
- $45,622
- Rent vs Own
- Severe rent burden
- 679.0
Population outlook (Jackson County) Hauer SSP2
- Today (2025)
- 719,589 people
- By 2030
- 731,456 · +1.6%
- By 2040
- 746,689 · +3.8%
- By 2050
- 749,289 · +4.1%
- By 2075
- 736,227 · +2.3%
- By 2100
- 668,210 · -7.1%
Race, ethnicity, and origin ACS 2023
- Neighborhood character
- Predominantly Black (66%)
- Race & ethnicity
- Black 66% White 16% Hispanic / Latino 11% Two or more races 10%
- Hispanic origin (detail)
- Mexican 9%
- Common ancestry
- Italian 2% Scotch-Irish 1% Romanian 1%
- Foreign-born
- 6% · Canada, Jamaica
- Languages at home
- 92% English-only · Spanish 7%
Political lean MEDSL · Jackson
- 2024 margin
- D (+19.3) · D 58.9% · R 39.5% · Other 1.6%
- 2008→2024 swing
- -6.1pp toward R · 2008: 25.4pp · 2024: 19.3pp
- All cycles
- 2024: D+19.3 2020: D+22.0 2016: D+16.6 2012: D+19.0 2008: D+25.4
Not yet ingested
- Civics
- —
Market trends
- HPI YoY
- ▲ 79.13%
- Current HPI
- 414.4305
- Rent YoY
- ▲ 2.98%
- Metro
- Kansas City, MO-KS
- State GDP YoY
- ▲ 1.84%
- F500 in state
- 20
Industry mix (Fortune 500 HQ in MO)
| Industry | F500 HQs | Revenue |
|---|---|---|
| Healthcare | 1 | $163B |
|
||
| Insurance | 1 | $21B |
|
||
| Industrial Technology | 1 | $17B |
|
||
| Retail | 1 | $16B |
|
||
| Industrial Distribution | 1 | $10B |
|
||
| Utilities | 1 | $9B |
|
||
Price history
+75.4% since first listed10 events — show timeline
- 2026-06-10 Sold (MLS) — Heartland MLS as Distributed by MLS Grid
- 2026-05-09 Pending — Heartland MLS as Distributed by MLS Grid
- 2026-05-06 Listed $157,000 Heartland MLS as Distributed by MLS Grid
- 2009-04-16 Sold (MLS) — Heartland MLS as Distributed by MLS Grid
- 2009-04-02 Listed $8,000 Heartland MLS as Distributed by MLS Grid
- 2008-12-16 Listing Removed — Heartland MLS as Distributed by MLS Grid
- 2008-07-15 Listed $69,900 Heartland MLS as Distributed by MLS Grid
- 2008-01-04 Listed $79,900 Heartland MLS as Distributed by MLS Grid
- 2007-09-15 Listed $89,500 Heartland MLS as Distributed by MLS Grid
- 1993-08-09 Sold (Public Records) — Public Records
Property tax history
+2.2%/yrLatest (2025): $851 · +39.8% YoY. Source: county tax records.
Cash-flow waterfall
monthlySold comps — $/sqft
last 12 mo · ≤1 miLoading sold comps…