 🏷️ Likely Rental
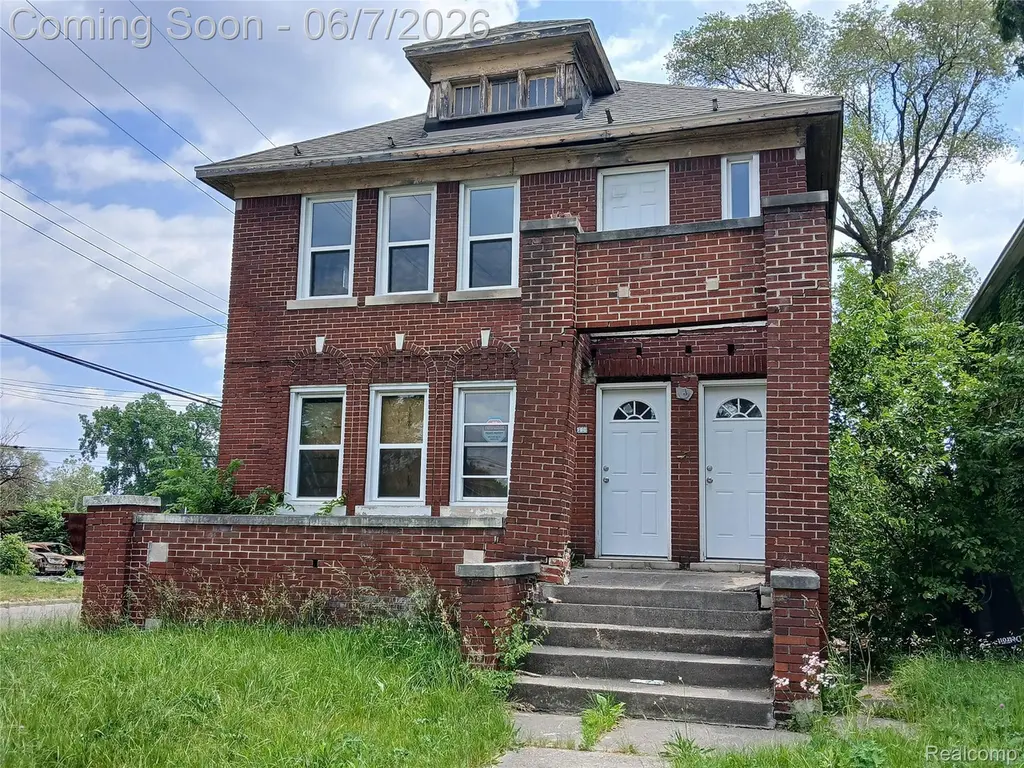
12796 Stoepel St · Detroit, MI
Flood risk 5/10 · Moderate
- FEMA flood zone
- X (unshaded)
- Chance of flooding over 30 yrs
- 0.66%
- Est. flood insurance / yr
- $473 – $860
Fire risk 1/10 · Minimal
- Est. fire insurance / yr
- $784 – $1,456
Heat risk 3/10 · Minor
- Hot days now (above 97°F)
- 7 days/yr
- Hot days in 30 yrs
- 15 days/yr
Wind risk 2/10 · Minimal
- Chance of severe wind over 30 yrs
- —
Air-quality risk 4/10 · Minor
- Unhealthy air days now
- 4 days/yr
- Unhealthy air days in 30 yrs
- 6 days/yr
Risk factors via First Street. Map © Google.
Why this score? — see what drove the B- grade
The composite is a weighted blend of 9 inputs, each scored 0–100. Each bar is that input's sub-score; the figure is the points it added to the 100-point composite (weight × sub-score).
- Cash flow +30.0/30.0
- 1% rule +10.0/10.0
- DSCR +10.0/10.0
- ARV discount +7.5/15.0
- Rent growth +4.0/5.0
- Livability +3.7/5.0
- Condition / age +2.5/5.0
- Schools +1.3/10.0
- Appreciation +0.0/10.0
$64,900
🖨 Deal sheet 📄 Offer letter ✓ Due diligence
Multi-family units
County records classify this as Multi-Family (2-4 Unit). Listing-text estimate: 2 units. confirmed
Listing remarks MLS
* * Attention Investors & Developers! * * Exceptional value-add opportunity with this large brick two-family property, ideal for a full renovation and long-term wealth-building strategy. The building has been taken down to the studs, providing a blank canvas to design and finish to your specifications. Two major capital improvements have already been completed, including a newer roof and vinyl replacement windows, helping reduce upfront renovation costs. Both units feature private front entrances and offer similar floor plans, with one upper and one lower unit. The common basement provides ample storage and could potentially be reconfigured to create separate tenant spaces. Utilities include one water meter, while gas and electric services are separately metered for each unit. Whether your strategy is BRRRR, buy-and-hold, or resale, this property presents significant upside potential for experienced investors seeking their next redevelopment project. Don't miss the opportunity to unlock the value this multifamily asset has to offer. Comparable Solds (12680 Santa Rosa for $197,500 on 5/11/26, 4308 Tyler St for $195,000 on 9/8/25)
Key facts
- 3,888 sq ft lot
- Built 1926
- Listed 12 days
Property features AI
Finance
- Financial info: Residential income property (multi-family) with two units
Exterior
- Utilities: Water available; Sewer available
- Home design: Multi-family residential income property; Two-story building; Private entrances
- Construction: Brick construction; Brick/mortar foundation; Built as multi-family with 2,400 above-grade finished square feet
- Exterior features: Paved road access; Pets allowed
Interior
- Bedrooms: Two 3-bedroom units
- Bathrooms: Two full bathrooms (building total); Each unit has 1 bathroom
- Heating & cooling: Forced air heating (natural gas); Separate meters for heating; No central cooling
- Interior features: ENERGY STAR qualified windows; Private entrance
Neighborhood map
What this means for you Summary
Snapshot
- This is a 2 × 3-bed/1.0-bath units multifamily listed at $65k.
Deal economics
- At list price, monthly cash flow is $1k ($17k/yr) — positive. Per door: $715/mo.
- The deal already cash-flows at list — no discount required.
- Meets the 1% rule at list price ($2k rent vs $65k).
- Cap rate 32.8% vs local median 10.2% in Detroit — top-decile yield for the area; either an underpriced asset or a hidden risk that comps aren't pricing in. Stress-test before assuming the spread holds.
Location & tenants
- Location reads 73/100 on livability (#218 in MI) — a middle-class / working-renter tenant base. Strengths: amenities A+, commute A+, cost of living A+; Watch: schools F, crime F, employment F.
- Detroit Public Schools Community District (urban): math 10% / reading 24% proficiency, ranked #499 of 540 in MI (top 92%) — low school quality limits family demand, transient renter base, plan for 1-2y turnover; 90% free/reduced lunch — lower-income household profile, screen leases tightly.
- Market conditions: Rents rising fast (+6.1%/yr); 346 active listings in the ZIP; 1 comparable units currently listed for rent nearby; lower-income renter base — watch delinquency; 2,639 units permitted in Wayne County in 2024 (1,216 in 5+ unit buildings).
- At $2,379/mo this rent would consume 86% of the median local household income ($33k/yr) (locally 2172% of renters already pay >50% of income on rent) — very limited rent-growth headroom before tenants either downsize or default.
Forward outlook
- Local home prices are declining (-3.0%/yr); year-one equity from $449 of loan paydown is wiped out by about $2k of value loss. Plan a longer hold.
- Wayne County population projected at -17% by 2050 — secular population decline; favor cash flow + early exit over multi-decade hold.
- At projected returns (-3.0% appreciation + 6.1% rent growth), your $18k cash investment doubles in ~2 years — after that, you're playing with house money.
Negotiation context
- Only 12 days on market — expect competitive offers; lowballing is unlikely to land.
- 9 sale attempts since 9y ago with the ask held roughly flat each time — persistent listings suggest the price (not the market) is what's stuck; bring a comps-based counter.
- Current owner paid $45k; 44% above their basis — modest negotiation headroom, anchor on the comps not their cost.
Risks & watch-outs
- Watch-outs: built in 1926 — expect roof / HVAC / electrical / plumbing capex.
- Climate carrying-cost: moderate flood risk — expect insurance premiums to compound above CPI over the hold.
Questions for the listing agent
- Can we see the unit-by-unit rent roll, current vacancy, and any below-market leases? What's the average tenancy length?
- What capital expenditures (roof, boiler, parking lot, exteriors) have been made in the last 5 years, and what's planned in the next 2?
- Built in 1926 — when were the roof, HVAC, electrical panel, plumbing, and water heater last replaced?
- Is there a deadline driving the sale (1031 exchange, divorce, estate, relocation)? That informs how much negotiation room exists.
- Schools are F-rated, which usually means shorter tenancies and higher turnover. Who's the typical renter profile here, and what's been the actual vacancy rate?
- Crime grade is F in this area — have there been break-ins, vandalism, or insurance claims at this property in the last 3 years? What carrier currently insures it and at what premium?
- What's the average days-on-market for RENTAL listings here right now (not sales)? A rising rental-DOM trend means longer vacancies and softer asking-rent achievability than the comps imply.
- What's the recent tenant-quality profile in this submarket — average credit score on applications, eviction rate, late-payment / NSF rate, and stable-employment percentage? A property-management company in the area should have these aggregated.
- How much new apartment / multifamily construction is in the pipeline within 1–3 miles? Heavy new supply (>2% of stock underway) typically softens rents 12–24 months out; light construction supports rent growth.
Investment metrics
- 1% rule
- 3.67% ✓
- Cap rate
- 32.75%
- Cash-on-cash
- 94.49%
- DSCR
- 5.20
- GRM
- 2.3
CMA / ARV
- ARV (on-the-fly)
- $134,400
- Comps found
- 12
Show comp detail 12 sales within ~0.75 mi
| Address | Dist | Beds/Ba | Sqft | Sold | Price | $/sf | Match |
|---|---|---|---|---|---|---|---|
| 12686 Stoepel St | 0.10mi | 6/2.5 | 2,500 (+4%) | 5mo | $140,000 | $56 | 82 |
| 13233 Santa Rosa Dr | 0.16mi | 5/2.0 (-1) | 2,279 (-5%) | 2mo | $175,000 | $77 | 78 |
| 3734 W Buena Vista St | 0.57mi | 6/2.0 | 2,320 (-3%) | 2mo | $168,000 | $72 | 67 |
| 4324 W Buena Vista St | 0.22mi | 6/3.0 | 2,700 (+12%) | 1mo | $148,000 | $55 | 64 |
| 12374 Stoepel St | 0.24mi | 6/3.5 | 2,610 (+9%) | 6mo | $223,000 | $85 | 63 |
| 3740 Tyler St | 0.56mi | 6/2.0 | 2,600 (+8%) | 2mo | $159,500 | $61 | 58 |
| 3782 Tyler St | 0.52mi | 6/2.0 | 2,600 (+8%) | 4mo | $97,500 | $38 | 58 |
| 4088 Tyler St | 0.37mi | 6/3.0 | 2,690 (+12%) | 1mo | $83,600 | $31 | 58 |
| 12380 Stoepel St | 0.24mi | 7/3.0 (+1) | 2,650 (+10%) | 6mo | $111,780 | $42 | 58 |
| 3741 Tyler St | 0.56mi | 6/2.5 | 2,600 (+8%) | 2mo | $15,000 | $6 | 57 |
| 3729 W Grand St | 0.63mi | 6/2.0 | 2,704 (+13%) | 3mo | $120,000 | $44 | 47 |
| 3316 Sturtevant St | 0.73mi | 6/2.0 | 2,750 (+15%) | 5mo | $215,000 | $78 | 38 |
Match score weights: distance 35% · size 25% · config 20% · recency 20%. Top-matched comps best support the ARV.
Projected returns pro-forma
-3.0% appreciation · 6.14% rent growth · sell at horizon
- IRR
- 98.9%
- Equity multiple
- 5.86×
- Total profit
- $88,406
- Equity at exit
- $9,677
- IRR
- —
- Equity multiple
- 13.57×
- Total profit
- $228,412
- Equity at exit
- $5,611
Cash invested: $18,172 (down + closing). Projections, not guarantees.
Landlord ↔ Tenant lean methodology
- Overall (STATE)
- 62 Landlord-Friendly
- State Michigan
- 62 Landlord-Friendly · EVEN
- County
- — inherits STATE
- City
- — inherits STATE
ZIP-level market 48238
- Home prices YoY
- -14.4%
- Rents YoY
- 6.1%
- Active inventory
- 346
- Price-to-rent
- 4.5×
Monthly cashflow live
- Estimated rent
- $2,379 high interval (Pro) →
- Mortgage (P&I)
- −$340
- Tax est. 1.5%
- −$81 /mo · $974/yr
- Insurance
- −$27
- HOA
- −$0
- Vacancy / Maint / Mgmt
- −$500
- Net cashflow
- $1,431
Break-even live
2-unit breakdown (identical units grouped — click to expand)
| Units | Beds | Baths | Est. rent |
|---|---|---|---|
| 2× units | 3 | 1 | $2,380 |
| #1 | 3 | 1 | $1,190 |
| #2 | 3 | 1 | $1,190 |
| Total (2 units) | $2,379 | ||
UW: 25.0% down · 7.5% · 30yr · 1.5% tax · 5.0% vac · 8.0% maint · 8.0% mgmt
Financing live
Cash to close
- Down payment
- $16,225
- Closing costs
- $1,947
- Reserves months
- —
- Total cash needed
- —
Loan-product check · same deal, 3 products live
Conventional
25% down · 7.5% · 30yr
- Down + closing
- —
- Monthly P&I
- —
- Monthly cashflow
- —
- DSCR
- —
- Eligible?
- —
Personal DTI + credit; lowest rate.
DSCR
20% down · 8.5% · 30yr
- Down + closing
- —
- Monthly P&I
- —
- Monthly cashflow
- —
- DSCR
- —
- Eligible?
- —
No personal income docs; deal must DSCR.
Hard money
10% down · 12.0% · 12mo
- Down + closing
- —
- Monthly P&I
- —
- Monthly cashflow
- —
- DSCR
- —
- Eligible?
- —
Short-term bridge; refi at stabilization.
Rent comps 1 comps
| Address | Beds | Baths | Sqft | Rent | $/sqft | DOM | Units | Dist |
|---|---|---|---|---|---|---|---|---|
| 13225 Santa Rosa Dr Detroit, MI | 5.0 | 2.0 | 2100 | $1,700 | $0.81 | 4d | 1 | 0.16mi |
Listing history 10 events
-
2026-06-18days on market $64,900 Active 12 DOM
-
2026-06-17days on market $64,900 Active 11 DOM
-
2026-06-16days on market $64,900 Active 10 DOM
-
2026-06-15days on market $64,900 Active 9 DOM
-
2026-06-13days on market $64,900 Active 7 DOM
-
2026-06-13days on market $64,900 Active 6 DOM
-
2026-06-09days on market $64,900 Active 3 DOM
-
2026-06-08days on market $64,900 Active 2 DOM
-
2026-06-07remarks 695-char remark
Show marketing remark (1155 chars)
* * Attention Investors & Developers! * * Exceptional value-add opportunity with this large brick two-family property, ideal for a full renovation and long-term wealth-building strategy. The building has been taken down to the studs, providing a blank canvas to design and finish to your specifications. Two major capital improvements have already been completed, including a newer roof and vinyl replacement windows, helping reduce upfront renovation costs. Both units feature private front entrances and offer similar floor plans, with one upper and one lower unit. The common basement provides ample storage and could potentially be reconfigured to create separate tenant spaces. Utilities include one water meter, while gas and electric services are separately metered for each unit. Whether your strategy is BRRRR, buy-and-hold, or resale, this property presents significant upside potential for experienced investors seeking their next redevelopment project. Don't miss the opportunity to unlock the value this multifamily asset has to offer. Comparable Solds (12680 Santa Rosa for $197,500 on 5/11/26, 4308 Tyler St for $195,000 on 9/8/25)
-
2026-06-07$64,900 Active 1 DOM
Show marketing remark (1155 chars)
* * Attention Investors & Developers! * * Exceptional value-add opportunity with this large brick two-family property, ideal for a full renovation and long-term wealth-building strategy. The building has been taken down to the studs, providing a blank canvas to design and finish to your specifications. Two major capital improvements have already been completed, including a newer roof and vinyl replacement windows, helping reduce upfront renovation costs. Both units feature private front entrances and offer similar floor plans, with one upper and one lower unit. The common basement provides ample storage and could potentially be reconfigured to create separate tenant spaces. Utilities include one water meter, while gas and electric services are separately metered for each unit. Whether your strategy is BRRRR, buy-and-hold, or resale, this property presents significant upside potential for experienced investors seeking their next redevelopment project. Don't miss the opportunity to unlock the value this multifamily asset has to offer. Comparable Solds (12680 Santa Rosa for $197,500 on 5/11/26, 4308 Tyler St for $195,000 on 9/8/25)
ⓘ Source: listings_history table (triggers on properties + properties_extension) + one-shot
backfill from property_details.listing_events for pre-trigger history.
Climate risk First Street
- Flood 5/10 Major FEMA zone X (unshaded) · 66% chance over 30 yrs
- Wildfire 1/10 Low
- Heat 3/10 Moderate 7 d/yr ≥97°F today · 15 d/yr by 30 yrs out
- Wind 2/10 Low
- Air quality 4/10 Moderate 4 unhealthy d/yr today · 6 by 30 yrs out
Nearby sold comps map
Loading sold comps map…
Walkable amenities ~0.75 mi
Loading nearby amenities…
Taxation est. · year 1
- Rental income
- $28,548
- − Mortgage interest
- −$3,635
- − Property taxes
- −$974
- − Insurance
- −$324
- − Repairs & maintenance
- −$2,284
- − Management
- −$2,284
- − Depreciation
- −$1,888
- Taxable income
- $17,159
- Est. tax owed @ 24.0%
- −$4,118
- After-tax cash flow
- $13,053/yr
For passive investors: Depreciation is non-cash, so a rental often shows a tax loss while cash-flowing — sheltering income. Rental losses are passive: they offset passive income freely, and up to $25,000/yr can offset ordinary (W-2) income if you actively participate and your MAGI is under $100k (phasing out to $0 by $150k); unused losses carry forward. On sale, claimed depreciation is recaptured at up to 25%, and gains may owe capital-gains tax (a 1031 exchange can defer both). Figures are a year-1 estimate at your 24.0% rate — not tax advice; consult a CPA.
Schools (NCES district)
- District
- Detroit Public Schools Community District
- NCES district ID
- 2601103
- Math proficiency
- 10% ▼ -2.00%
- Reading proficiency
- 24% ▲ 6.00%
- Median HH income
- $25,815
- Composite
- 13.06/100
- National rank
- #9564
- State rank
- #499 of 540 in MI
Livability — Detroit
- Score
- 73/100
- State rank
- #218
- US rank
- #5427
Category grades
Schools grade is shown separately in the Schools card above.
Census & demographics
- Census place
- Detroit, MI
- County
- Wayne County · 1,562,939 people
- City population
- 572,865
- Metro
- Detroit-Warren-Dearborn, MI
- Population (ZIP)
- 24,731
- Household income
- $33,315
- Rent vs Own
- Severe rent burden
- 2172.0
Population outlook (Wayne County) Hauer SSP2
- Today (2025)
- 1,675,273 people
- By 2030
- 1,620,300 · -3.3%
- By 2040
- 1,502,341 · -10.3%
- By 2050
- 1,384,039 · -17.4%
- By 2075
- 1,124,592 · -32.9%
- By 2100
- 881,193 · -47.4%
Race, ethnicity, and origin ACS 2023
- Neighborhood character
- Predominantly Black (94%)
- Race & ethnicity
- Black 94% Two or more races 3% White 1%
- Foreign-born
- 1%
Political lean MEDSL · Wayne
- 2024 margin
- Strong D (+29.0) · D 62.7% · R 33.7% · Other 3.6%
- 2008→2024 swing
- -20.5pp toward R · 2008: 49.5pp · 2024: 29.0pp
- All cycles
- 2024: D+29.0 2020: D+38.1 2016: D+37.3 2012: D+46.9 2008: D+49.5
Not yet ingested
- Civics
- —
Market trends
- HPI YoY
- ▼ -31.96%
- Current HPI
- 189.6227
- Rent YoY
- ▲ 6.14%
- Metro
- Detroit-Warren-Dearborn, MI
- State GDP YoY
- ▲ 1.37%
- F500 in state
- 28
Industry mix (Fortune 500 HQ in MI)
| Industry | F500 HQs | Revenue |
|---|---|---|
| Automotive Parts | 3 | $48B |
|
||
| Automotive | 2 | $372B |
|
||
| Chemicals | 1 | $45B |
|
||
| Automotive Retail | 1 | $29B |
|
||
| Healthcare / Medical Devices | 1 | $23B |
|
||
| Automotive Technology | 1 | $20B |
|
||
Price history
+621.1% since first listed25 events — show timeline
- 2026-06-07 Listed $64,900 MiRealSource-MiMLS
- 2026-06-07 Listed $64,900 REALCOMP
- 2026-06-05 Coming Soon $64,900 MiRealSource-MiMLS
- 2022-01-26 Sold (Public Records) $45,000 Public Records
- 2021-12-22 Listing Removed — MiRealSource-MiMLS
- 2021-11-18 Sold (MLS) $45,000 MiRealSource-MiMLS
- 2021-11-18 Sold (MLS) $45,000 REALCOMP
- 2021-11-10 Pending — MiRealSource-MiMLS
- 2021-11-10 Pending — REALCOMP
- 2021-11-09 Price Changed $49,899 MiRealSource-MiMLS
- 2021-11-09 Price Changed $49,899 REALCOMP
- 2021-11-01 Listed $49,900 MiRealSource-MiMLS
- 2021-11-01 Listed $49,900 REALCOMP
- 2018-07-01 Listing Removed — SW Michigan MLS
- 2018-06-30 Listing Removed — MiRealSource-MiMLS
- 2018-06-30 Listing Removed — REALCOMP
- 2018-01-30 Listed $18,633 MiRealSource-MiMLS
- 2018-01-30 Listed $18,633 SW Michigan MLS
- 2018-01-30 Listed $18,633 REALCOMP
- 2017-07-07 Listing Removed — SW Michigan MLS
- 2017-07-06 Listing Removed — REALCOMP
- 2017-04-18 Price Changed $9,000 SW Michigan MLS
- 2017-04-12 Price Changed $12,900 SW Michigan MLS
- 2017-04-06 Listed $17,500 SW Michigan MLS
- 2017-04-06 Listed $9,000 REALCOMP
Property tax history
+7.5%/yrLatest (2025): $3,777 · +99.0% YoY. Source: county tax records.
Cash-flow waterfall
monthlySold comps — $/sqft
last 12 mo · ≤1 miLoading sold comps…