522 Allen Ave · Stinnett, TX
Flood risk 1/10 · Minimal
- FEMA flood zone
- —
- Chance of flooding over 30 yrs
- 0.0%
- Est. flood insurance / yr
- —
Fire risk 10/10 · Severe
- Est. fire insurance / yr
- $1,222 – $2,270
Heat risk 5/10 · Moderate
- Hot days now (above 100°F)
- 7 days/yr
- Hot days in 30 yrs
- 18 days/yr
Wind risk 2/10 · Minimal
- Chance of severe wind over 30 yrs
- —
Air-quality risk 2/10 · Minimal
- Unhealthy air days now
- 1 days/yr
- Unhealthy air days in 30 yrs
- 1 days/yr
Risk factors via First Street. Map © Google.
Why this score? — see what drove the B+ grade
The composite is a weighted blend of 9 inputs, each scored 0–100. Each bar is that input's sub-score; the figure is the points it added to the 100-point composite (weight × sub-score).
- Cash flow +28.7/30.0
- ARV discount +15.0/15.0
- DSCR +10.0/10.0
- 1% rule +8.2/10.0
- Appreciation +5.6/10.0
- Schools +3.5/10.0
- Livability +3.4/5.0
- Rent growth +2.5/5.0
- Condition / age +2.5/5.0
$73,000
🖨 Deal sheet 📄 Offer letter ✓ Due diligence
Listing remarks MLS
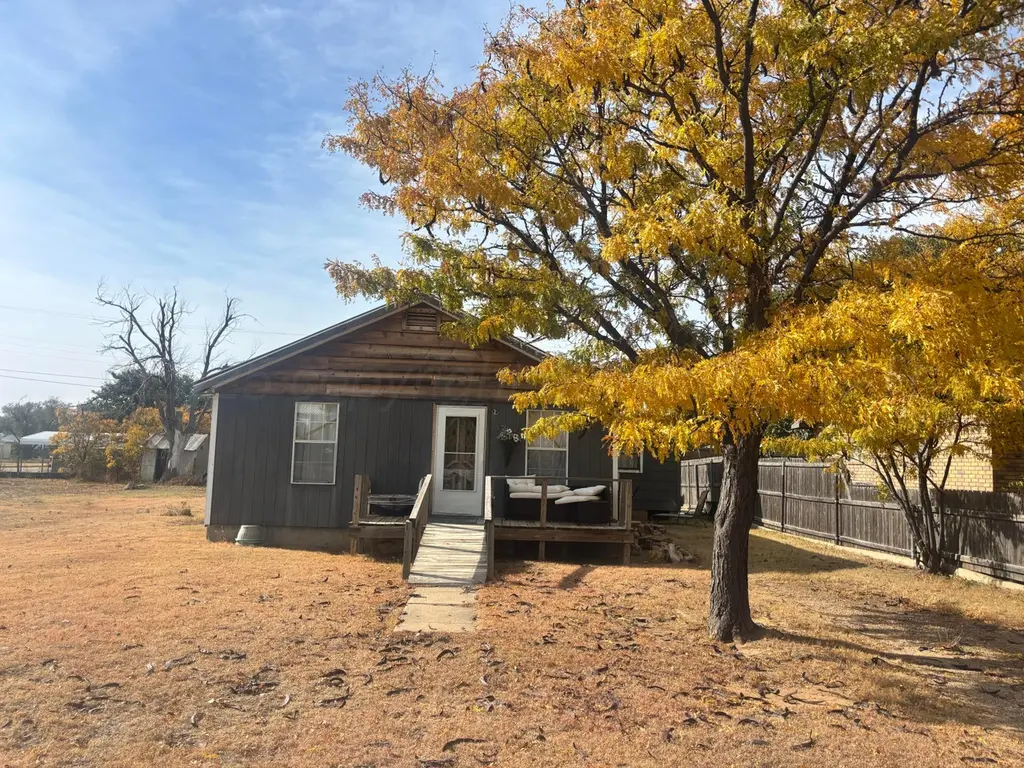
Put the final touches on this 3 bedroom one bath home. The home boats plenty of light, and beautiful hardwood floors. It has a large yard for delightful evenings. Make your appointment today
Key facts
- 6,250 sq ft lot
- Built 1986
- Listed 217 days
Neighborhood map
What this means for you Summary
Snapshot
- This is a 2-bed/1.0-bath single-family listed at $73k.
Deal economics
- At list price, monthly cash flow is $242 ($3k/yr) — positive.
- The deal already cash-flows at list — no discount required.
- Meets the 1% rule at list price ($965 rent vs $73k).
- Recommended offer: $64k (12.0% below list) — sets the bar for market timing.
Location & tenants
- Location reads 67/100 on livability (#556 in TX) — a middle-class / working-renter tenant base. Strengths: cost of living A+, housing A+, crime A-; Watch: schools C-, employment C-, amenities F.
- Plemons-Stinnett-Phillips CISD (rural): math 38% / reading 44% proficiency, ranked #377 of 826 in TX (top 46%) — families likely to look elsewhere, expect single-tenant / working-renter base with shorter leases.
- Market conditions: 14 active listings in the ZIP; 2 units permitted in Hutchinson County in 2024 (0 in 5+ unit buildings).
Forward outlook
- In year one you build about $1k of equity ($505 loan paydown + $916 appreciation (1.3% local appreciation)).
- At projected returns (1.3% appreciation + 3.0% rent growth), your $20k cash investment doubles in ~5 years — after that, you're playing with house money.
Negotiation context
- It's been on market 218 days — a 12% lower offer ($64k) is reasonable based on typical stale-listing flexibility.
Risks & watch-outs
- Climate carrying-cost: severe wildfire risk; extreme-heat days projected 7→18/yr by 2055 (HVAC capex compounding) — expect insurance premiums to compound above CPI over the hold.
Questions for the listing agent
- It's been on market 218 days. Have you received any prior offers? Is the seller open to a 12% concession, seller financing, or rate buy-down credit?
- Why hasn't it sold? Are there any deal-killer items the seller is aware of (foundation, flood, title, zoning, code violations)?
- Is there a deadline driving the sale (1031 exchange, divorce, estate, relocation)? That informs how much negotiation room exists.
- What's the average days-on-market for RENTAL listings here right now (not sales)? A rising rental-DOM trend means longer vacancies and softer asking-rent achievability than the comps imply.
- What's the recent tenant-quality profile in this submarket — average credit score on applications, eviction rate, late-payment / NSF rate, and stable-employment percentage? A property-management company in the area should have these aggregated.
- How much new for-sale + rental construction is in the pipeline within 1–3 miles? Heavy new supply typically softens prices + rents 12–24 months out; constrained supply supports both.
Investment metrics
- 1% rule
- 1.32% ✓
- Cap rate
- 10.27%
- Cash-on-cash
- 14.21%
- DSCR
- 1.63
- GRM
- 6.3
CMA / ARV
- ARV (median comp)
- $113,715
- List price
- $73,000
- Delta
- -35.80%
- Verdict
- UNDERPRICED
- Comps
- 1 within 2.0 mi
Projected returns pro-forma
1.26% appreciation · 3.0% rent growth · sell at horizon
- IRR
- 16.8%
- Equity multiple
- 1.87×
- Total profit
- $17,722
- Equity at exit
- $25,896
- IRR
- 19.8%
- Equity multiple
- 3.46×
- Total profit
- $50,230
- Equity at exit
- $35,180
Cash invested: $20,440 (down + closing). Projections, not guarantees.
Landlord ↔ Tenant lean methodology
- Overall (STATE)
- 87 Strongly Landlord-Friendly
- State Texas
- 87 Strongly Landlord-Friendly · R+5
- County
- — inherits STATE
- City
- — inherits STATE
ZIP-level market 79083
- Home prices YoY
- 1.1%
- Active inventory
- 14
- Price-to-rent
- 6.3×
Monthly cashflow live
- Estimated rent
- $965 medium interval (Pro) →
- Mortgage (P&I)
- −$383
- Tax from tax record
- −$107 /mo · $1,281/yr
- Insurance
- −$30
- HOA
- −$0
- Vacancy / Maint / Mgmt
- −$203
- Net cashflow
- $242
Break-even live
UW: 25.0% down · 7.5% · 30yr · 1.5% tax · 5.0% vac · 8.0% maint · 8.0% mgmt
Financing live
Cash to close
- Down payment
- $18,250
- Closing costs
- $2,190
- Reserves months
- —
- Total cash needed
- —
Loan-product check · same deal, 3 products live
Conventional
25% down · 7.5% · 30yr
- Down + closing
- —
- Monthly P&I
- —
- Monthly cashflow
- —
- DSCR
- —
- Eligible?
- —
Personal DTI + credit; lowest rate.
DSCR
20% down · 8.5% · 30yr
- Down + closing
- —
- Monthly P&I
- —
- Monthly cashflow
- —
- DSCR
- —
- Eligible?
- —
No personal income docs; deal must DSCR.
Hard money
10% down · 12.0% · 12mo
- Down + closing
- —
- Monthly P&I
- —
- Monthly cashflow
- —
- DSCR
- —
- Eligible?
- —
Short-term bridge; refi at stabilization.
Listing history 20 events
-
2026-06-18days on market $73,000 Active 218 DOM
-
2026-06-17days on market $73,000 Active 217 DOM
-
2026-06-16days on market $73,000 Active 216 DOM
-
2026-06-15days on market $73,000 Active 215 DOM
-
2026-06-15days on market $73,000 Active 214 DOM
-
2026-06-13days on market $73,000 Active 213 DOM
-
2026-06-12days on market $73,000 Active 212 DOM
-
2026-06-09days on market $73,000 Active 209 DOM
-
2026-06-08days on market $73,000 Active 208 DOM
-
2026-06-08days on market $73,000 Active 207 DOM
-
2026-06-05pricedays on market $73,000 Active 205 DOM
-
2026-06-03days on market $75,000 Active 203 DOM
-
2026-06-02days on market $75,000 Active 202 DOM
-
2026-06-01days on market $75,000 Active 201 DOM
-
2026-05-31days on market $75,000 Active 200 DOM
-
2026-04-17price $75,000 190-char remark
Show marketing remark (190 chars)
Put the final touches on this 3 bedroom one bath home. The home boats plenty of light, and beautiful hardwood floors. It has a large yard for delightful evenings. Make your appointment today
-
2026-03-04soldstatus
-
2025-11-13$60,000 Active 190-char remark
Show marketing remark (190 chars)
Put the final touches on this 3 bedroom one bath home. The home boats plenty of light, and beautiful hardwood floors. It has a large yard for delightful evenings. Make your appointment today
-
2009-02-27soldstatus
-
2004-01-30soldstatus
ⓘ Source: listings_history table (triggers on properties + properties_extension) + one-shot
backfill from property_details.listing_events for pre-trigger history.
Tax reassessment forecast TX · Resets to sale price
- Current annual tax
- $1,281 · $107/mo
- Projected year-2 tax
- $1,336 · $111/mo
- Expected delta
- +$54/yr (+$5/mo · 4.3%)
ⓘ Screening estimate from a state-policy table — verify with the county assessor before closing.
Climate risk First Street
- Flood 1/10 Low 0% chance over 30 yrs
- Wildfire 10/10 Extreme
- Heat 5/10 Major 7 d/yr ≥100°F today · 18 d/yr by 30 yrs out
- Wind 2/10 Low
- Air quality 2/10 Low 1 unhealthy d/yr today · 1 by 30 yrs out
Nearby sold comps map
Loading sold comps map…
Walkable amenities ~0.75 mi
Loading nearby amenities…
Taxation est. · year 1
- Rental income
- $11,576
- − Mortgage interest
- −$4,089
- − Property taxes
- −$1,281
- − Insurance
- −$365
- − Repairs & maintenance
- −$926
- − Management
- −$926
- − Depreciation
- −$2,124
- Taxable income
- $1,864
- Est. tax owed @ 24.0%
- −$447
- After-tax cash flow
- $2,457/yr
For passive investors: Depreciation is non-cash, so a rental often shows a tax loss while cash-flowing — sheltering income. Rental losses are passive: they offset passive income freely, and up to $25,000/yr can offset ordinary (W-2) income if you actively participate and your MAGI is under $100k (phasing out to $0 by $150k); unused losses carry forward. On sale, claimed depreciation is recaptured at up to 25%, and gains may owe capital-gains tax (a 1031 exchange can defer both). Figures are a year-1 estimate at your 24.0% rate — not tax advice; consult a CPA.
Schools (NCES district)
- District
- Plemons-Stinnett-Phillips CISD
- NCES district ID
- 4841580
- Math proficiency
- 38% ▼ -15.00%
- Reading proficiency
- 44% ▼ -2.00%
- Median HH income
- $46,689
- Composite
- 34.99/100
- National rank
- #5053
- State rank
- #377 of 826 in TX
Livability — Stinnett
- Score
- 67/100
- State rank
- #556
- US rank
- #10725
Category grades
Schools grade is shown separately in the Schools card above.
Census & demographics
- Census place
- Stinnett, TX
- Population (ZIP)
- 1,776
Population outlook (Hutchinson County) Hauer SSP2
- Today (2025)
- 21,274 people
- By 2030
- 21,089 · -0.9%
- By 2040
- 20,938 · -1.6%
- By 2050
- 20,999 · -1.3%
- By 2075
- 21,433 · +0.7%
- By 2100
- 21,243 · -0.1%
Race, ethnicity, and origin ACS 2023
- Neighborhood character
- Predominantly White (82%)
- Race & ethnicity
- White 82% Two or more races 16% Hispanic / Latino 8%
- Hispanic origin (detail)
- Mexican 7%
- Common ancestry
- Slovak 3% Lithuanian 2% Iranian 1%
- Languages at home
- 93% English-only · Spanish 7%
Political lean MEDSL · Hutchinson
- 2024 margin
- Solid R (+77.2) · D 11.1% · R 88.2%
- 2008→2024 swing
- -8.2pp toward R · 2008: -68.9pp · 2024: -77.2pp
- All cycles
- 2024: R+77.2 2020: R+76.6 2016: R+76.1 2012: R+72.7 2008: R+68.9
Not yet ingested
- Civics
- —
Market trends
- HPI YoY
- ▲ 1.26%
- Current HPI
- 115.2223
- Rent YoY
- —
- Metro
- —
- State GDP YoY
- ▲ 3.95%
- F500 in state
- 110
Industry mix (Fortune 500 HQ in TX)
| Industry | F500 HQs | Revenue |
|---|---|---|
| Energy | 16 | $1,198B |
|
||
| Technology | 5 | $198B |
|
||
| Engineering / Construction | 4 | $72B |
|
||
| Energy Services | 3 | $60B |
|
||
| Utilities | 3 | $41B |
|
||
| Healthcare | 2 | $330B |
|
||
Price history
+25.0% since first listed5 events — show timeline
- 2026-04-17 Price Changed $75,000 AARMLS
- 2026-03-04 Sold (Public Records) — Public Records
- 2025-11-13 Listed $60,000 AARMLS
- 2009-02-27 Sold (Public Records) — Public Records
- 2004-01-30 Sold (Public Records) — Public Records
Property tax history
+9.1%/yrLatest (2025): $1,281 · -0.5% YoY. Source: county tax records.
Cash-flow waterfall
monthlySold comps — $/sqft
last 12 mo · ≤1 miLoading sold comps…