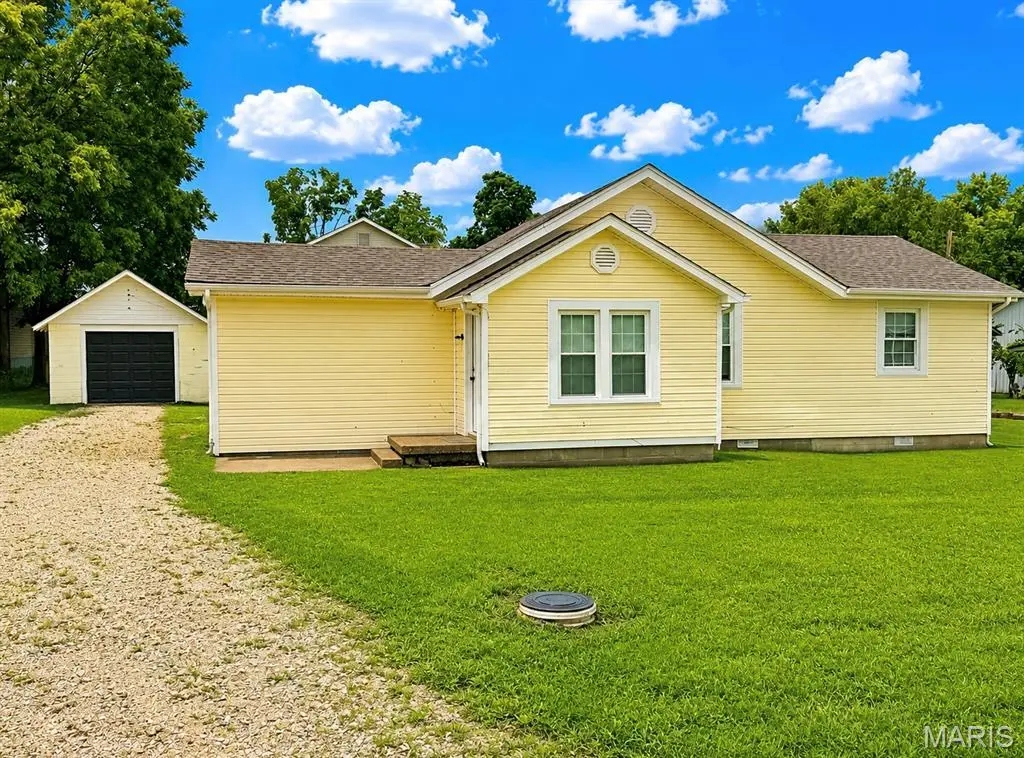
108 W Elm St · Pilot Knob, MO
Flood risk 1/10 · Minimal
- FEMA flood zone
- X (unshaded)
- Chance of flooding over 30 yrs
- 0.0%
- Est. flood insurance / yr
- $507 – $1,088
Fire risk 3/10 · Minor
- Est. fire insurance / yr
- $1,054 – $1,958
Heat risk 5/10 · Moderate
- Hot days now (above 104°F)
- 7 days/yr
- Hot days in 30 yrs
- 22 days/yr
Wind risk 2/10 · Minimal
- Chance of severe wind over 30 yrs
- 1.0%
Air-quality risk 1/10 · Minimal
- Unhealthy air days now
- 0 days/yr
- Unhealthy air days in 30 yrs
- 0 days/yr
Risk factors via First Street. Map © Google.
Why this score? — see what drove the D- grade
The composite is a weighted blend of 9 inputs, each scored 0–100. Each bar is that input's sub-score; the figure is the points it added to the 100-point composite (weight × sub-score).
- Cash flow +10.4/30.0
- Appreciation +9.4/10.0
- Schools +3.6/10.0
- DSCR +3.0/10.0
- Livability +2.6/5.0
- Rent growth +2.5/5.0
- Condition / age +2.5/5.0
- ARV discount +2.0/15.0
- 1% rule +1.7/10.0
$160,000
🖨 Deal sheet (PDF) 📄 Offer letter ✓ Due diligence
Listing remarks MLS
Come take a look at this three bedroom, one bath home located in the heart of Pilot Knob!! This home offers a nice shaded backyard with a patio and a detached garage. On the inside you will find a large living room, a dining room, kitchen, three bedrooms and a full bath. This one won't last long call today for your personal viewing!!!
Key facts
- Large level yard
- Ranch style cottage
- Concrete patio areas
Tags
Property features AI
Finance
- Other: Owner-occupied tax status (2025)
- Financial info: Lease not considered; No second mortgage indicated
Exterior
- Parking: 1-car garage
- Utilities: Public water; Public sewer; 220-volt electric; Cable available; Electricity available and connected; Phone available; Sewer connected; Water available and connected
- Home design: Single-family residence; One level; Private ownership
- Construction: Vinyl siding
- Exterior features: Back yard
Interior
- Kitchen: Range; Refrigerator
- Bedrooms: 4 bedrooms, all on the main level
- Bathrooms: 1 full bathroom (main level)
- Heating & cooling: Natural gas heating; Gas cooling
- Interior features: Range; Refrigerator
- Laundry & utility: Main-level laundry room
Neighborhood map
What this means for you Summary
Snapshot
- This is a 4-bed/1.0-bath single-family listed at $160k.
Deal economics
- At list price, monthly cash flow is $-84 ($-1k/yr) — negative.
- To cash-flow at today's rent, offer at most $145k (9.3% below list).
- To meet the 1% rule (rent ≥ 1% of price), the offer needs to be $108k (32.7% below list).
- Recommended offer: $108k (32.7% below list) — sets the bar for 1% rule.
Location & tenants
- Location reads 51/100 on livability (#882 in MO) — a working-class tenant base; expect higher turnover. Strengths: cost of living A+, housing A+; Watch: crime F, amenities F, commute F.
- Arcadia Valley R-II (rural): math 42% / reading 46% proficiency, ranked #115 of 324 in MO (top 36%) — families likely to look elsewhere, expect single-tenant / working-renter base with shorter leases.
- Zoned schools: Arcadia Valley Elem. (math 42% / reading 42%, grade F, #481 of 1,115 statewide, top 46%, 397 students, 99% FRL); Arcadia Valley Middle (math 41% / reading 45%, grade D-, #134 of 391 statewide, top 35%, 266 students, 99% FRL); Arcadia Valley High (math 47% / reading 62%, grade C-, #69 of 521 statewide, top 15%, 343 students, 50% FRL) — zoned schools average 83% FRL vs 55% district-wide (28 pts higher); higher-poverty schools than district average — tighter screening recommended.
- Market conditions: 4 active listings in the ZIP; 6 units permitted in Iron County in 2024 (0 in 5+ unit buildings).
Forward outlook
- In year one you build about $15k of equity ($1k loan paydown + $14k appreciation (8.9% local appreciation)).
- Iron County population projected at -25% by 2050 — secular population decline; favor cash flow + early exit over multi-decade hold.
- By year 3, paydown + projected appreciation supports a ~$38k cash-out refi (75% LTV) — recoverable capital for the next deal without selling this one.
Negotiation context
- It's been on market 18 days — a 2% lower offer ($158k) is reasonable based on typical stale-listing flexibility.
- 3 sale attempts since 11y ago with the ask held roughly flat each time — persistent listings suggest the price (not the market) is what's stuck; bring a comps-based counter.
Risks & watch-outs
- Watch-outs: built in 1950 — expect roof / HVAC / electrical / plumbing capex.
- Climate carrying-cost: extreme-heat days projected 7→22/yr by 2055 (HVAC capex compounding) — expect insurance premiums to compound above CPI over the hold.
Questions for the listing agent
- What do current leases actually rent for vs. the listed asking? Can we see a recent rent roll and the last 12 months of T-12 income?
- Built in 1950 — when were the roof, HVAC, electrical panel, plumbing, and water heater last replaced?
- Is there a deadline driving the sale (1031 exchange, divorce, estate, relocation)? That informs how much negotiation room exists.
- Schools are F-rated, which usually means shorter tenancies and higher turnover. Who's the typical renter profile here, and what's been the actual vacancy rate?
- Crime grade is F in this area — have there been break-ins, vandalism, or insurance claims at this property in the last 3 years? What carrier currently insures it and at what premium?
- The area grade is low — what's the realistic commute time and amenity access for the typical tenant pool here? Any planned neighborhood developments (good or bad) we should know about?
- What's the average days-on-market for RENTAL listings here right now (not sales)? A rising rental-DOM trend means longer vacancies and softer asking-rent achievability than the comps imply.
- What's the recent tenant-quality profile in this submarket — average credit score on applications, eviction rate, late-payment / NSF rate, and stable-employment percentage? A property-management company in the area should have these aggregated.
- How much new for-sale + rental construction is in the pipeline within 1–3 miles? Heavy new supply typically softens prices + rents 12–24 months out; constrained supply supports both.
Investment metrics
- 1% rule
- 0.67% ✗
- Cap rate
- 5.66%
- Cash-on-cash
- -2.26%
- DSCR
- 0.90
- GRM
- 12.4
CMA / ARV
- ARV (on-the-fly)
- $142,674
- Comps found
- 1
Show comp detail 1 sale within ~0.75 mi
| Address | Dist | Beds/Ba | Sqft | Sold | Price | $/sf | Match |
|---|---|---|---|---|---|---|---|
| 210 W Walnut St | 0.11mi | 3/1.0 (-1) | 1,253 (+13%) | 11mo | $162,000 | $129 | 59 |
Match score weights: distance 35% · size 25% · config 20% · recency 20%. Top-matched comps best support the ARV.
Projected returns pro-forma
8.86% appreciation · 3.0% rent growth · sell at horizon
- IRR
- 20.2%
- Equity multiple
- 2.55×
- Total profit
- $69,370
- Equity at exit
- $131,045
- IRR
- 18.5%
- Equity multiple
- 5.60×
- Total profit
- $205,940
- Equity at exit
- $269,736
Cash invested: $44,800 (down + closing). Projections, not guarantees.
Landlord ↔ Tenant lean methodology
- Overall (STATE)
- 81 Strongly Landlord-Friendly
- State Missouri
- 81 Strongly Landlord-Friendly · R+10
- County
- — inherits STATE
- City
- — inherits STATE
ZIP-level market 63663
- Home prices YoY
- 4.2%
- Active inventory
- 4
- Price-to-rent
- 12.4×
Monthly cashflow live
- Estimated rent
- $1,077 medium interval (Pro) →
- Mortgage (P&I)
- −$839
- Tax from tax record
- −$29 /mo · $351/yr
- Insurance
- −$67
- HOA
- −$0
- Vacancy / Maint / Mgmt
- −$226
- Net cashflow
- $-84
Break-even live
Sensitivity live
| Price | -10% $6 | -5% $-39 | +0% $-84 | +5% $-130 | +10% $-366 |
|---|---|---|---|---|---|
| Rent | -10% $-169 | -5% $-127 | +0% $-84 | +5% $-42 | +10% $1 |
| Rate | -1.0pp $-4 | -0.5pp $-44 | base $-84 | +0.5pp $-126 | +1.0pp $-168 |
UW: 25.0% down · 7.5% · 30yr · 1.5% tax · 5.0% vac · 8.0% maint · 8.0% mgmt
Financing live
Cash to close
- Down payment
- $40,000
- Closing costs
- $4,800
- Reserves months
- —
- Total cash needed
- —
Loan-product check · same deal, 3 products live
Conventional
25% down · 7.5% · 30yr
- Down + closing
- —
- Monthly P&I
- —
- Monthly cashflow
- —
- DSCR
- —
- Eligible?
- —
Personal DTI + credit; lowest rate.
DSCR
20% down · 8.5% · 30yr
- Down + closing
- —
- Monthly P&I
- —
- Monthly cashflow
- —
- DSCR
- —
- Eligible?
- —
No personal income docs; deal must DSCR.
Hard money
10% down · 12.0% · 12mo
- Down + closing
- —
- Monthly P&I
- —
- Monthly cashflow
- —
- DSCR
- —
- Eligible?
- —
Short-term bridge; refi at stabilization.
Listing history 14 events
-
2026-06-22days on market $160,000 Active 18 DOM
-
2026-06-21days on market $160,000 Active 17 DOM
-
2026-06-21days on market $160,000 Active 16 DOM
-
2026-06-18days on market $160,000 Active 14 DOM
-
2026-06-17days on market $160,000 Active 13 DOM
-
2026-06-16days on market $160,000 Active 12 DOM
-
2026-06-15days on market $160,000 Active 11 DOM
-
2026-06-13days on market $160,000 Active 9 DOM
-
2026-06-12days on market $160,000 Active 8 DOM
-
2026-06-09days on market $160,000 Active 5 DOM
-
2026-06-08days on market $160,000 Active 4 DOM
-
2026-06-07days on market $160,000 Active 3 DOM
-
2026-06-07remarks 699-char remark
-
2026-06-07$160,000 Active 2 DOM
ⓘ Source: listings_history table (triggers on properties + properties_extension) + one-shot
backfill from property_details.listing_events for pre-trigger history.
Tax reassessment forecast MO · Resets to sale price
- Current annual tax
- $351 · $29/mo
- Projected year-2 tax
- $1,552 · $129/mo
- Expected delta
- +$1,201/yr (+$100/mo · 342.6%)
ⓘ Screening estimate from a state-policy table — verify with the county assessor before closing.
Climate risk First Street
- Flood 1/10 Low FEMA zone X (unshaded) · 0% chance over 30 yrs
- Wildfire 3/10 Moderate
- Heat 5/10 Major 7 d/yr ≥104°F today · 22 d/yr by 30 yrs out
- Wind 2/10 Low 100% chance of damaging wind over 30 yrs
- Air quality 1/10 Low 0 unhealthy d/yr today · 0 by 30 yrs out
Nearby sold comps map
Loading sold comps map…
Walkable amenities ~0.75 mi
Loading nearby amenities…
Taxation est. · year 1
- Rental income
- $12,921
- − Mortgage interest
- −$8,962
- − Property taxes
- −$351
- − Insurance
- −$800
- − Repairs & maintenance
- −$1,034
- − Management
- −$1,034
- − Depreciation
- −$4,655
- Taxable loss
- −$3,914
- Est. tax savings @ 24.0%
- +$939
- After-tax cash flow
- $-73/yr
For passive investors: Depreciation is non-cash, so a rental often shows a tax loss while cash-flowing — sheltering income. Rental losses are passive: they offset passive income freely, and up to $25,000/yr can offset ordinary (W-2) income if you actively participate and your MAGI is under $100k (phasing out to $0 by $150k); unused losses carry forward. On sale, claimed depreciation is recaptured at up to 25%, and gains may owe capital-gains tax (a 1031 exchange can defer both). Figures are a year-1 estimate at your 24.0% rate — not tax advice; consult a CPA.
Schools (NCES district)
- District
- Arcadia Valley R-II
- NCES district ID
- 2903150
- Math proficiency
- 42% ▼ -8.00%
- Reading proficiency
- 46% ▼ -6.00%
- Median HH income
- $34,573
- Composite
- 36.32/100
- National rank
- #4693
- State rank
- #115 of 324 in MO
Livability — Pilot Knob
- Score
- 51/100
- State rank
- #882
- US rank
- #25346
Category grades
Schools grade is shown separately in the Schools card above.
Census & demographics
- Census place
- Pilot Knob, MO
- City population
- 747
- Population (ZIP)
- 747
Population outlook (Iron County) Hauer SSP2
- Today (2025)
- 9,245 people
- By 2030
- 8,745 · -5.4%
- By 2040
- 7,808 · -15.5%
- By 2050
- 6,944 · -24.9%
- By 2075
- 5,320 · -42.5%
- By 2100
- 4,245 · -54.1%
Race, ethnicity, and origin ACS 2023
- Neighborhood character
- Predominantly White (89%)
- Race & ethnicity
- White 89% Two or more races 10% Hispanic / Latino 2%
- Common ancestry
- Iranian 4% Lithuanian 2% Slovak 1%
- Foreign-born
- 1% · South Korea
Political lean MEDSL · Iron
- 2024 margin
- Solid R (+62.4) · D 18.2% · R 80.7% · Other 1.1%
- 2008→2024 swing
- -65.2pp toward R · 2008: 2.8pp · 2024: -62.4pp
- All cycles
- 2024: R+62.4 2020: R+57.7 2016: R+52.6 2012: R+14.5 2008: D+2.8
Not yet ingested
- Civics
- —
Market trends
- HPI YoY
- ▲ 8.86%
- Current HPI
- 219.9719
- Rent YoY
- —
- Metro
- —
- State GDP YoY
- ▲ 1.84%
- F500 in state
- 20
Industry mix (Fortune 500 HQ in MO)
| Industry | F500 HQs | Revenue |
|---|---|---|
| Healthcare | 1 | $163B |
|
||
| Insurance | 1 | $21B |
|
||
| Industrial Technology | 1 | $17B |
|
||
| Retail | 1 | $16B |
|
||
| Industrial Distribution | 1 | $10B |
|
||
| Utilities | 1 | $9B |
|
||
Price history
+220.6% since first listed6 events — show timeline
- 2026-06-04 Listed $160,000 MARIS as Distributed by MLS Grid
- 2022-11-18 Sold (MLS) — MARIS as Distributed by MLS Grid
- 2022-10-24 Pending — MARIS as Distributed by MLS Grid
- 2022-10-11 Listed $55,900 MARIS as Distributed by MLS Grid
- 2016-07-21 Sold (MLS) — MARIS as Distributed by MLS Grid
- 2015-10-06 Listed $49,900 MARIS as Distributed by MLS Grid
Property tax history
+2.7%/yrLatest (2025): $351 · +14.7% YoY. Source: county tax records.
Cash-flow waterfall
monthlySold comps — $/sqft
last 12 mo · ≤1 miLoading sold comps…