 Duplex
137 Daniel Low Ter · New York, NY
Flood risk 1/10 · Minimal
- FEMA flood zone
- X (unshaded)
- Chance of flooding over 30 yrs
- 0.0%
- Est. flood insurance / yr
- $507 – $1,088
Fire risk 1/10 · Minimal
- Est. fire insurance / yr
- $691 – $1,283
Heat risk 7/10 · Major
- Hot days now (above 98°F)
- 7 days/yr
- Hot days in 30 yrs
- 16 days/yr
Wind risk 6/10 · Moderate
- Chance of severe wind over 30 yrs
- 51.0%
Air-quality risk 4/10 · Minor
- Unhealthy air days now
- 5 days/yr
- Unhealthy air days in 30 yrs
- 7 days/yr
Risk factors via First Street. Map © Google.
Why this score? — see what drove the B+ grade
The composite is a weighted blend of 9 inputs, each scored 0–100. Each bar is that input's sub-score; the figure is the points it added to the 100-point composite (weight × sub-score).
- Cash flow +30.0/30.0
- ARV discount +15.0/15.0
- DSCR +10.0/10.0
- 1% rule +9.6/10.0
- Schools +5.0/10.0
- Rent growth +4.0/5.0
- Livability +3.8/5.0
- Condition / age +2.5/5.0
- Appreciation +0.0/10.0
$499,000
🖨 Deal sheet (PDF) 📄 Offer letter ✓ Due diligence
Multi-family units
County records classify this as Multi-Family (2-4 Unit). Listing-text estimate: 2 units. confirmed
Listing remarks MLS
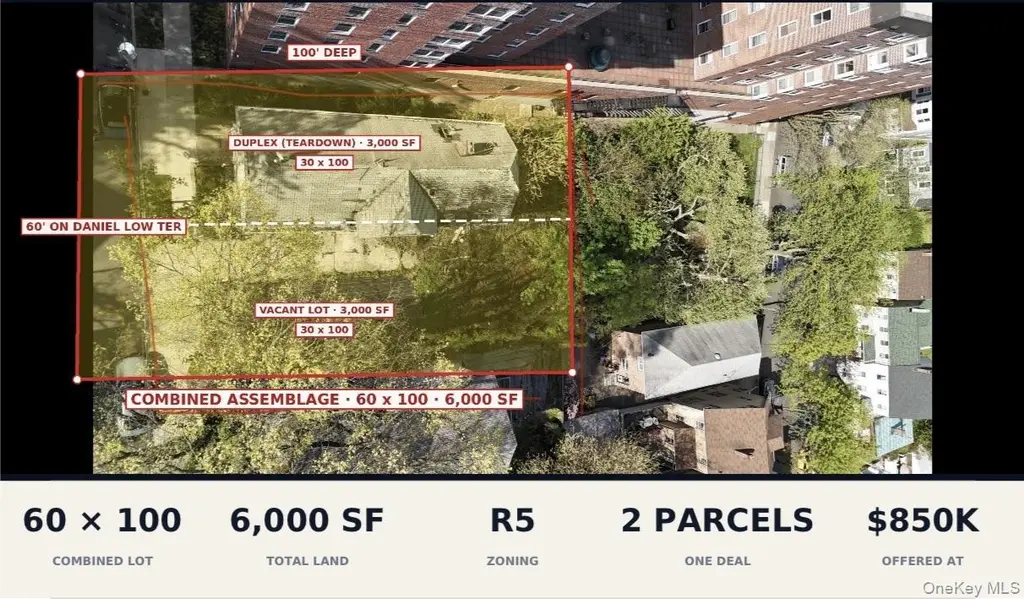
Rare St. George development opportunity — 30 x 100 lot (3,000 SF) on Daniel Low Terrace, a short walk to the St. George Ferry Terminal, Empire Outlets, the FerryHawks ballpark, and Fort Hill Park. The existing 1925 duplex (2,978 SF, 2.5 stories, 2 units) is positioned as a teardown — pricing reflects the site as land, not the existing structure. R5 zoning supports a range of low- to mid-density residential product, subject to NYC DOB review. Being sold together with the adjacent vacant lot at Block 18, Lot 96 — combined frontage of 60 x 100 (6,000 SF) for buyers who want a development-ready assemblage under single ownership. Manhattan skyline across the harbor; downtown is a free 25-minute ferry ride. Detailed investor proposal available on request. All info deemed reliable; buyer to verify zoning, FAR, and buildable assumptions independently.
Key facts
- Two family home
- 30 x 100 lot
- 3,000 sq ft lot
Tags
Property features AI
Exterior
- Parking: Private parking; No carport
- Utilities: Electricity connected (Con-Edison); Public sewer / sewer connected
- Home design: Duplex
- Construction: Frame construction
- Exterior features: Frame construction; Not waterfront; Additional parcel(s) included
Interior
- Heating & cooling: No heating; No cooling
- Interior features: First floor bedroom; Basement present
Neighborhood map
What this means for you Summary
Snapshot
- This is a 2 × 2-bed/1-bath units multifamily listed at $499k.
Deal economics
- At list price, monthly cash flow is $3k ($32k/yr) — positive. Per door: $1k/mo.
- The deal already cash-flows at list — no discount required.
- Meets the 1% rule at list price ($7k rent vs $499k).
- Recommended offer: $484k (3.0% below list) — sets the bar for market timing.
- Cap rate 12.7% vs local median 2.6% in New York — top-decile yield for the area; either an underpriced asset or a hidden risk that comps aren't pricing in. Stress-test before assuming the spread holds.
Location & tenants
- Location reads 75/100 on livability (#268 in NY, #4,188 nationally) — a middle-class / working-renter tenant base. Strengths: amenities A+, commute A+, health & safety A; Watch: crime F, cost of living F.
- Market conditions: Rents rising fast (+6.1%/yr); 263 active listings in the ZIP; 2 comparable units currently listed for rent nearby; solid renter incomes; 480 units permitted in Richmond County in 2024 (22 in 5+ unit buildings).
- At $7,274/mo this rent would consume 102% of the median local household income ($86k/yr) (locally 2008% of renters already pay >50% of income on rent) — very limited rent-growth headroom before tenants either downsize or default.
Forward outlook
- Local home prices are declining (-3.0%/yr); year-one equity from $3k of loan paydown is wiped out by about $15k of value loss. Plan a longer hold.
- Richmond County population projected to shrink 5% by 2050 — rents likely to lag national; underwrite the cash flow, not the appreciation.
- At projected returns (-3.0% appreciation + 6.1% rent growth), your $140k cash investment doubles in ~5 years — after that, you're playing with house money.
Negotiation context
- It's been on market 55 days — a 3% lower offer ($484k) is reasonable based on typical stale-listing flexibility.
- 7 sale attempts since 20y ago; this cycle's ask has dropped $351k (41%) from the opening price — seller is motivated, your offer sets the floor, not the list.
Risks & watch-outs
- Watch-outs: built in 1925 — expect roof / HVAC / electrical / plumbing capex.
- Climate carrying-cost: major wind risk, 51% chance of damaging wind over 30y; extreme-heat days projected 7→16/yr by 2055 (HVAC capex compounding) — expect insurance premiums to compound above CPI over the hold.
Questions for the listing agent
- It's been on market 55 days. Have you received any prior offers? Is the seller open to a 3% concession, seller financing, or rate buy-down credit?
- Can we see the unit-by-unit rent roll, current vacancy, and any below-market leases? What's the average tenancy length?
- What capital expenditures (roof, boiler, parking lot, exteriors) have been made in the last 5 years, and what's planned in the next 2?
- Built in 1925 — when were the roof, HVAC, electrical panel, plumbing, and water heater last replaced?
- Is there a deadline driving the sale (1031 exchange, divorce, estate, relocation)? That informs how much negotiation room exists.
- Schools are B-rated — typically a magnet for longer-tenancy family renters. What's the average tenant stay here, and is there a school-zone premium baked into asking?
- Crime grade is F in this area — have there been break-ins, vandalism, or insurance claims at this property in the last 3 years? What carrier currently insures it and at what premium?
- What's the average days-on-market for RENTAL listings here right now (not sales)? A rising rental-DOM trend means longer vacancies and softer asking-rent achievability than the comps imply.
- What's the recent tenant-quality profile in this submarket — average credit score on applications, eviction rate, late-payment / NSF rate, and stable-employment percentage? A property-management company in the area should have these aggregated.
- How much new apartment / multifamily construction is in the pipeline within 1–3 miles? Heavy new supply (>2% of stock underway) typically softens rents 12–24 months out; light construction supports rent growth.
Investment metrics
- 1% rule
- 1.46% ✓
- Cap rate
- 12.75%
- Cash-on-cash
- 23.05%
- DSCR
- 2.03
- GRM
- 5.7
CMA / ARV
- ARV (on-the-fly)
- $872,554
- Comps found
- 12
Show comp detail 12 sales within ~0.75 mi
| Address | Dist | Beds/Ba | Sqft | Sold | Price | $/sf | Match |
|---|---|---|---|---|---|---|---|
| 87 Montgomery Ave | 0.15mi | 7/3.0 | 3,120 (+5%) | 5mo | $960,000 | $308 | 81 |
| 301 Westervelt Ave | 0.12mi | 6/3.0 | 2,750 (-8%) | 4mo | $805,000 | $293 | 78 |
| 166 Benziger Ave | 0.22mi | 6/3.5 | 3,136 (+5%) | 9mo | $824,000 | $263 | 73 |
| 267 York Ave | 0.41mi | 8/4.0 | 3,150 (+6%) | 1mo | $1,340,000 | $425 | 71 |
| 99 Monroe Ave | 0.15mi | 3/2.0 | 2,678 (-10%) | 7mo | $680,000 | $254 | 70 |
| 98 Hamilton Ave | 0.24mi | 4/4.5 | 2,639 (-11%) | 2mo | $825,000 | $313 | 68 |
| 138 Hendricks Ave | 0.32mi | 5/2.0 | 2,618 (-12%) | 8mo | $818,850 | $313 | 58 |
| 102 Winter Ave | 0.31mi | 10/4.0 | 3,400 (+14%) | 6mo | $875,000 | $257 | 57 |
| 24-26 York Ave | 0.57mi | 6/2.0 | 2,700 (-9%) | 5mo | $825,000 | $306 | 54 |
| 47 Kirby Ct | 0.67mi | 4/2.0 | 2,783 (-6%) | 5mo | $760,000 | $273 | 53 |
| 203 Franklin Ave | 0.57mi | 6/2.0 | 3,264 (+10%) | 7mo | $410,000 | $126 | 51 |
| 360 Victory Blvd | 0.62mi | 5/2.0 | 2,705 (-9%) | 8mo | $770,000 | $285 | 49 |
Match score weights: distance 35% · size 25% · config 20% · recency 20%. Top-matched comps best support the ARV.
Projected returns pro-forma
-3.0% appreciation · 6.07% rent growth · sell at horizon
- IRR
- 19.2%
- Equity multiple
- 1.81×
- Total profit
- $113,086
- Equity at exit
- $74,403
- IRR
- 29.5%
- Equity multiple
- 4.00×
- Total profit
- $419,257
- Equity at exit
- $43,144
Cash invested: $139,720 (down + closing). Projections, not guarantees.
Landlord ↔ Tenant lean methodology
- Overall (CITY)
- 0 Strongly Tenant-Friendly
- State New York
- 15 Strongly Tenant-Friendly · D+10
- County
- — inherits STATE
- City New York
- 0 Strongly Tenant-Friendly · D+34
ZIP-level market 10301
- Rents YoY
- 6.1%
- Active inventory
- 263
- Price-to-rent
- 11.4×
Monthly cashflow live
- Estimated rent
- $7,274 high interval (Pro) →
- Mortgage (P&I)
- −$2,617
- Tax from tax record
- −$238 /mo · $2,859/yr
- Insurance
- −$208
- HOA
- −$0
- Vacancy / Maint / Mgmt
- −$1,528
- Net cashflow
- $2,684
Break-even live
Sensitivity live
| Price | -10% $2,966 | -5% $2,825 | +0% $2,684 | +5% $2,542 | +10% $2,401 |
|---|---|---|---|---|---|
| Rent | -10% $2,109 | -5% $2,396 | +0% $2,684 | +5% $2,971 | +10% $3,258 |
| Rate | -1.0pp $2,935 | -0.5pp $2,810 | base $2,684 | +0.5pp $2,554 | +1.0pp $2,423 |
2-unit breakdown (identical units grouped — click to expand)
| Units | Beds | Baths | Est. rent |
|---|---|---|---|
| 2× units | 2 | 1 | $7,274 |
| #1 | 2 | 1 | $3,637 |
| #2 | 2 | 1 | $3,637 |
| Total (2 units) | $7,274 | ||
UW: 25.0% down · 7.5% · 30yr · 1.5% tax · 5.0% vac · 8.0% maint · 8.0% mgmt
Financing live
Cash to close
- Down payment
- $124,750
- Closing costs
- $14,970
- Reserves months
- —
- Total cash needed
- —
Loan-product check · same deal, 3 products live
Conventional
25% down · 7.5% · 30yr
- Down + closing
- —
- Monthly P&I
- —
- Monthly cashflow
- —
- DSCR
- —
- Eligible?
- —
Personal DTI + credit; lowest rate.
DSCR
20% down · 8.5% · 30yr
- Down + closing
- —
- Monthly P&I
- —
- Monthly cashflow
- —
- DSCR
- —
- Eligible?
- —
No personal income docs; deal must DSCR.
Hard money
10% down · 12.0% · 12mo
- Down + closing
- —
- Monthly P&I
- —
- Monthly cashflow
- —
- DSCR
- —
- Eligible?
- —
Short-term bridge; refi at stabilization.
Rent comps 2 comps
| Address | Beds | Baths | Sqft | Rent | $/sqft | DOM | Units | Dist |
|---|---|---|---|---|---|---|---|---|
| 38 Sherman Ave Staten Island, NY | 2.0 | 2.0 | 2628 | $2,600 | $0.99 | 8d | 1 | 0.09mi |
| 122 Westervelt Ave Unit 1 Staten Island, NY | 2.0 | 1.0 | 2100 | $2,600 | $1.24 | 25d | 1 | 0.37mi |
Listing history 25 events
-
2026-06-18days on market $499,000 Active 55 DOM
-
2026-06-17days on market $499,000 Active 54 DOM
-
2026-06-16days on market $499,000 Active 53 DOM
-
2026-06-15days on market $499,000 Active 52 DOM
-
2026-06-13pricedays on market $499,000 Active 50 DOM
-
2026-06-10days on market $850,000 Active 46 DOM
-
2026-06-08days on market $850,000 Active 45 DOM
-
2026-06-08days on market $850,000 Active 44 DOM
-
2026-06-04days on market $850,000 Active 41 DOM
-
2026-06-03days on market $850,000 Active 40 DOM
-
2026-06-01days on market $850,000 Active 38 DOM
-
2026-05-31days on market $850,000 Active 37 DOM
-
2026-04-24$850,000 Active
Show marketing remark (873 chars)
Rare St. George development opportunity — 30 x 100 lot (3,000 SF) on Daniel Low Terrace, a short walk to the St. George Ferry Terminal, Empire Outlets, the FerryHawks ballpark, and Fort Hill Park. The existing 1925 duplex (2,978 SF, 2.5 stories, 2 units) is positioned as a teardown — pricing reflects the site as land, not the existing structure. R5 zoning supports a range of low- to mid-density residential product, subject to NYC DOB review. Being sold together with the adjacent vacant lot at Block 18, Lot 96 — combined frontage of 60 x 100 (6,000 SF) for buyers who want a development-ready assemblage under single ownership. Manhattan skyline across the harbor; downtown is a free 25-minute ferry ride. Detailed investor proposal available on request. All info deemed reliable; buyer to verify zoning, FAR, and buildable assumptions independently.
-
2026-04-24$850,000 Active 873-char remark
Show marketing remark (873 chars)
Rare St. George development opportunity — 30 x 100 lot (3,000 SF) on Daniel Low Terrace, a short walk to the St. George Ferry Terminal, Empire Outlets, the FerryHawks ballpark, and Fort Hill Park. The existing 1925 duplex (2,978 SF, 2.5 stories, 2 units) is positioned as a teardown — pricing reflects the site as land, not the existing structure. R5 zoning supports a range of low- to mid-density residential product, subject to NYC DOB review. Being sold together with the adjacent vacant lot at Block 18, Lot 96 — combined frontage of 60 x 100 (6,000 SF) for buyers who want a development-ready assemblage under single ownership. Manhattan skyline across the harbor; downtown is a free 25-minute ferry ride. Detailed investor proposal available on request. All info deemed reliable; buyer to verify zoning, FAR, and buildable assumptions independently.
-
2016-02-17historical
-
2016-02-17historical
-
2014-12-12historical
-
2014-12-01historical
-
2007-10-16$685,000
-
2007-09-11$685,000
-
2007-03-12soldstatus $585,000
-
2006-12-28$629,000
-
2006-09-28$675,000
-
2006-09-28$660,000
-
2000-02-08soldstatus $116,500
ⓘ Source: listings_history table (triggers on properties + properties_extension) + one-shot
backfill from property_details.listing_events for pre-trigger history.
Tax reassessment forecast NY · Partial reset (capped growth)
- Current annual tax
- $2,859 · $238/mo
- Projected year-2 tax
- $5,646 · $470/mo
- Expected delta
- +$2,787/yr (+$232/mo · 97.5%)
ⓘ Screening estimate from a state-policy table — verify with the county assessor before closing.
Climate risk First Street
- Flood 1/10 Low FEMA zone X (unshaded) · 0% chance over 30 yrs
- Wildfire 1/10 Low
- Heat 7/10 Severe 7 d/yr ≥98°F today · 16 d/yr by 30 yrs out
- Wind 6/10 Major 51% chance of damaging wind over 30 yrs
- Air quality 4/10 Moderate 5 unhealthy d/yr today · 7 by 30 yrs out
Nearby sold comps map
Loading sold comps map…
Walkable amenities ~0.75 mi
Loading nearby amenities…
Taxation est. · year 1
- Rental income
- $87,288
- − Mortgage interest
- −$27,952
- − Property taxes
- −$2,859
- − Insurance
- −$2,495
- − Repairs & maintenance
- −$6,983
- − Management
- −$6,983
- − Depreciation
- −$14,516
- Taxable income
- $25,500
- Est. tax owed @ 24.0%
- −$6,120
- After-tax cash flow
- $26,082/yr
For passive investors: Depreciation is non-cash, so a rental often shows a tax loss while cash-flowing — sheltering income. Rental losses are passive: they offset passive income freely, and up to $25,000/yr can offset ordinary (W-2) income if you actively participate and your MAGI is under $100k (phasing out to $0 by $150k); unused losses carry forward. On sale, claimed depreciation is recaptured at up to 25%, and gains may owe capital-gains tax (a 1031 exchange can defer both). Figures are a year-1 estimate at your 24.0% rate — not tax advice; consult a CPA.
Schools (NCES district)
No district data.
Livability — New York
- Score
- 75/100
- State rank
- #268
- US rank
- #4188
Category grades
Schools grade is shown separately in the Schools card above.
Census & demographics
- Census place
- New York, NY
- County
- Richmond County · 404,174 people
- City population
- 7,731,280
- Metro
- New York-Newark-Jersey City, NY-NJ-PA
- Population (ZIP)
- 41,052
- Household income
- $85,609
- Rent vs Own
- Severe rent burden
- 2008.0
Population outlook (Richmond County) Hauer SSP2
- Today (2025)
- 482,784 people
- By 2030
- 481,831 · -0.2%
- By 2040
- 473,159 · -2.0%
- By 2050
- 457,242 · -5.3%
- By 2075
- 408,029 · -15.5%
- By 2100
- 341,459 · -29.3%
Race, ethnicity, and origin ACS 2023
- Neighborhood character
- Highly diverse neighborhood (Simpson 0.72)
- Race & ethnicity
- White 37% Hispanic / Latino 29% Black 23% Two or more races 16% Asian 7%
- Hispanic origin (detail)
- Mexican 5% Puerto Rican 10% Cuban 2% Dominican 6%
- Common ancestry
- Romanian 3% Scotch-Irish 2% Italian 1%
- Foreign-born
- 22% · Canada, China, Jamaica
- Languages at home
- 68% English-only · Spanish 16% Other Indo-European 5% Russian/Polish/Slavic 3%
Political lean MEDSL · Richmond
- 2024 margin
- Strong R (+29.8) · D 35.1% · R 64.9%
- 2008→2024 swing
- -25.7pp toward R · 2008: -4.0pp · 2024: -29.8pp
- All cycles
- 2024: R+29.8 2020: R+14.9 2016: R+16.8 2012: D+0.8 2008: R+4.0
Not yet ingested
- Civics
- —
Market trends
- HPI YoY
- ▼ -407.37%
- Current HPI
- 319.0616
- Rent YoY
- ▲ 6.07%
- Metro
- New York-Newark-Jersey City, NY-NJ-PA
- State GDP YoY
- ▲ 2.60%
- F500 in state
- 92
Industry mix (Fortune 500 HQ in NY)
| Industry | F500 HQs | Revenue |
|---|---|---|
| Financial Services | 10 | $950B |
|
||
| Consumer Goods | 9 | $162B |
|
||
| Insurance | 4 | $225B |
|
||
| Telecommunications | 2 | $144B |
|
||
| Pharmaceuticals | 2 | $112B |
|
||
| Media / Entertainment | 2 | $69B |
|
||
Price history
+629.6% since first listed13 events — show timeline
- 2026-04-24 Listed $850,000 OneKey® MLS as Distributed by MLS Grid
- 2026-04-24 Listed $850,000 OneKey® MLS as Distributed by MLS Grid
- 2016-02-17 Listing Removed — SIBORMLS
- 2016-02-17 Listing Removed — SIBORMLS
- 2014-12-12 Listing Removed — SIBORMLS
- 2014-12-01 Listing Removed — SIBORMLS
- 2007-10-16 Listed $685,000 SIBORMLS
- 2007-09-11 Listed $685,000 SIBORMLS
- 2007-03-12 Sold (MLS) $585,000 SIBORMLS
- 2006-12-28 Listed $629,000 SIBORMLS
- 2006-09-28 Listed $660,000 SIBORMLS
- 2006-09-28 Listed $675,000 SIBORMLS
- 2000-02-08 Sold (Public Records) $116,500 Public Records
Property tax history
+1.0%/yrLatest (2025): $2,859 · +6.0% YoY. Source: county tax records.
Cash-flow waterfall
monthlySold comps — $/sqft
last 12 mo · ≤1 miLoading sold comps…