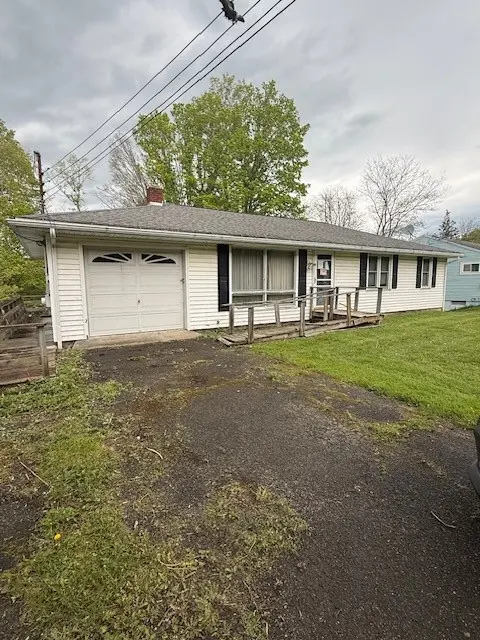
2058 Owego Rd · Endicott, NY
Flood risk 1/10 · Minimal
- FEMA flood zone
- X
- Chance of flooding over 30 yrs
- 0.0%
- Est. flood insurance / yr
- $473 – $860
Fire risk 3/10 · Minor
- Est. fire insurance / yr
- $691 – $1,283
Heat risk 3/10 · Minor
- Hot days now (above 93°F)
- 7 days/yr
- Hot days in 30 yrs
- 16 days/yr
Wind risk 2/10 · Minimal
- Chance of severe wind over 30 yrs
- 1.0%
Air-quality risk 2/10 · Minimal
- Unhealthy air days now
- 0 days/yr
- Unhealthy air days in 30 yrs
- 1 days/yr
Risk factors via First Street. Map © Google.
Why this score? — see what drove the B+ grade
The composite is a weighted blend of 9 inputs, each scored 0–100. Each bar is that input's sub-score; the figure is the points it added to the 100-point composite (weight × sub-score).
- Cash flow +30.0/30.0
- ARV discount +15.0/15.0
- 1% rule +10.0/10.0
- DSCR +10.0/10.0
- Schools +5.7/10.0
- Livability +3.5/5.0
- Rent growth +2.5/5.0
- Condition / age +2.5/5.0
- Appreciation +0.0/10.0
$99,900
🖨 Deal sheet 📄 Offer letter ✓ Due diligence
Listing remarks MLS
2ND OWNERS-MINT CONDITION! A MUST SEE! NEUTRALDECOR. PLUMBED FOR 2ND FULL BATH ON LL $160/MONTHTOTAL FOR GAS AND ELEC ON BUDGET. QUALITY-BUILT. RANGE & REFRIG 6 YRS. ROOF & SIDING NEW -91'.
Key facts
- Walk-out basement
- Huge deck
- Deep backyard
Tags
Property features AI
Finance
- Other: Residential property; Located off Rte 434 onto Owego Rd (do not go onto the property without your agent)
Exterior
- Parking: Driveway
- Utilities: Public water; Public sewer
- Home design: Single-family residence; One story
- Construction: Vinyl siding
- Exterior features: Deck; Sloped down lot
Interior
- Kitchen: Cooktop; Range; Dishwasher; Refrigerator
- Flooring: Carpet; Hardwood; Vinyl
- Bathrooms: 1 full bathroom
- Heating & cooling: Forced air heating; Central air conditioning
- Interior features: Basement with walk-out access; Cooktop, Range, Dishwasher, Refrigerator, Gas water heater
- Laundry & utility: Gas water heater
Neighborhood map
What this means for you Summary
Snapshot
- This is a 3-bed/1.0-bath single-family listed at $100k.
Deal economics
- At list price, monthly cash flow is $801 ($10k/yr) — positive.
- The deal already cash-flows at list — no discount required.
- Meets the 1% rule at list price ($2k rent vs $100k).
- Cap rate 15.9% vs local median 5.5% in Endicott — top-decile yield for the area; either an underpriced asset or a hidden risk that comps aren't pricing in. Stress-test before assuming the spread holds.
Location & tenants
- Location reads 70/100 on livability (#438 in NY) — a middle-class / working-renter tenant base. Strengths: cost of living A+, health & safety A+, housing A; Watch: amenities D, crime F, commute F.
- Vestal Central School District (suburban): math 63% / reading 68% proficiency, ranked #168 of 590 in NY (top 28%) — acceptable for families but not a draw, mixed tenant base, ~2y average lease; only 17% free/reduced lunch — higher-income household profile.
- Zoned schools: Clayton Avenue Elementary School (math 52% / reading 62%, grade C+, #842 of 2,108 statewide, top 43%, 248 students, 49% FRL) — zoned schools average 49% FRL vs 17% district-wide (31 pts higher); higher-poverty schools than district average — tighter screening recommended.
- Market conditions: 90 active listings in the ZIP; 2 comparable units currently listed for rent nearby; 340 units permitted in Broome County in 2024 (269 in 5+ unit buildings).
Forward outlook
- Local home prices are declining (-3.0%/yr); year-one equity from $691 of loan paydown is wiped out by about $3k of value loss. Plan a longer hold.
- Broome County population projected at -13% by 2050 — secular population decline; favor cash flow + early exit over multi-decade hold.
- At projected returns (-3.0% appreciation + 3.0% rent growth), your $28k cash investment doubles in ~4 years — after that, you're playing with house money.
Negotiation context
- Only 8 days on market — expect competitive offers; lowballing is unlikely to land.
- 2 sale attempts since 26y ago with the ask held roughly flat each time — persistent listings suggest the price (not the market) is what's stuck; bring a comps-based counter.
- Current owner paid $67k; 49% above their basis — modest negotiation headroom, anchor on the comps not their cost.
Questions for the listing agent
- Built in 1960 — when were the roof, HVAC, electrical panel, plumbing, and water heater last replaced?
- Is there a deadline driving the sale (1031 exchange, divorce, estate, relocation)? That informs how much negotiation room exists.
- Schools are D-rated, which usually means shorter tenancies and higher turnover. Who's the typical renter profile here, and what's been the actual vacancy rate?
- Crime grade is F in this area — have there been break-ins, vandalism, or insurance claims at this property in the last 3 years? What carrier currently insures it and at what premium?
- What's the average days-on-market for RENTAL listings here right now (not sales)? A rising rental-DOM trend means longer vacancies and softer asking-rent achievability than the comps imply.
- What's the recent tenant-quality profile in this submarket — average credit score on applications, eviction rate, late-payment / NSF rate, and stable-employment percentage? A property-management company in the area should have these aggregated.
- How much new for-sale + rental construction is in the pipeline within 1–3 miles? Heavy new supply typically softens prices + rents 12–24 months out; constrained supply supports both.
Investment metrics
- 1% rule
- 1.91% ✓
- Cap rate
- 15.91%
- Cash-on-cash
- 34.36%
- DSCR
- 2.53
- GRM
- 4.4
CMA / ARV
- ARV (median comp)
- $186,095
- List price
- $99,900
- Delta
- -46.32%
- Verdict
- UNDERPRICED
- Comps
- 13 within 1.0 mi
Show comp detail 3 sales within ~0.75 mi
| Address | Dist | Beds/Ba | Sqft | Sold | Price | $/sf | Match |
|---|---|---|---|---|---|---|---|
| 1860 Castle Gardens Rd | 0.55mi | 3/1.5 | 1,325 (+12%) | 10mo | $215,000 | $162 | 45 |
| 329 Tracy Creek Rd | 0.61mi | 2/2.0 (-1) | 1,318 (+11%) | 5mo | $237,000 | $180 | 40 |
| 217 Westland Rd | 0.73mi | 2/1.0 (-1) | 1,105 (-7%) | 18mo | $159,900 | $145 | 34 |
Match score weights: distance 35% · size 25% · config 20% · recency 20%. Top-matched comps best support the ARV.
Projected returns pro-forma
-3.0% appreciation · 3.0% rent growth · sell at horizon
- IRR
- 29.8%
- Equity multiple
- 2.25×
- Total profit
- $34,860
- Equity at exit
- $14,895
- IRR
- 37.1%
- Equity multiple
- 4.44×
- Total profit
- $96,189
- Equity at exit
- $8,638
Cash invested: $27,972 (down + closing). Projections, not guarantees.
Landlord ↔ Tenant lean methodology
- Overall (STATE)
- 15 Strongly Tenant-Friendly
- State New York
- 15 Strongly Tenant-Friendly · D+10
- County
- — inherits STATE
- City
- — inherits STATE
ZIP-level market 13850
- Home prices YoY
- -33.5%
- Active inventory
- 90
- Price-to-rent
- 4.4×
Monthly cashflow live
- Estimated rent
- $1,904 medium interval (Pro) →
- Mortgage (P&I)
- −$524
- Tax from tax record
- −$137 /mo · $1,648/yr
- Insurance
- −$42
- HOA
- −$0
- Vacancy / Maint / Mgmt
- −$400
- Net cashflow
- $801
Break-even live
UW: 25.0% down · 7.5% · 30yr · 1.5% tax · 5.0% vac · 8.0% maint · 8.0% mgmt
Financing live
Cash to close
- Down payment
- $24,975
- Closing costs
- $2,997
- Reserves months
- —
- Total cash needed
- —
Loan-product check · same deal, 3 products live
Conventional
25% down · 7.5% · 30yr
- Down + closing
- —
- Monthly P&I
- —
- Monthly cashflow
- —
- DSCR
- —
- Eligible?
- —
Personal DTI + credit; lowest rate.
DSCR
20% down · 8.5% · 30yr
- Down + closing
- —
- Monthly P&I
- —
- Monthly cashflow
- —
- DSCR
- —
- Eligible?
- —
No personal income docs; deal must DSCR.
Hard money
10% down · 12.0% · 12mo
- Down + closing
- —
- Monthly P&I
- —
- Monthly cashflow
- —
- DSCR
- —
- Eligible?
- —
Short-term bridge; refi at stabilization.
Rent comps 2 comps
| Address | Beds | Baths | Sqft | Rent | $/sqft | DOM | Units | Dist |
|---|---|---|---|---|---|---|---|---|
| 209 Vivian Ln Vestal, NY | 2.0 | 1.5 | 1442 | $2,400 | $1.66 | 21d | 1 | 0.79mi |
| 228 Airport Rd Unit 1 Endicott, NY | 2.0 | 1.0 | 1000 | $1,075 | $1.07 | 21d | 1 | 1.36mi |
Listing history 4 events
-
2026-05-13$99,900 Active 471-char remark
-
2000-05-10soldstatus $67,200
-
2000-05-09soldstatus $67,200 197-char remark
Show marketing remark (197 chars)
2ND OWNERS-MINT CONDITION! A MUST SEE! NEUTRALDECOR. PLUMBED FOR 2ND FULL BATH ON LL $160/MONTHTOTAL FOR GAS AND ELEC ON BUDGET. QUALITY-BUILT. RANGE & REFRIG 6 YRS. ROOF & SIDING NEW -91'.
-
2000-03-07$67,200 197-char remark
Show marketing remark (197 chars)
2ND OWNERS-MINT CONDITION! A MUST SEE! NEUTRALDECOR. PLUMBED FOR 2ND FULL BATH ON LL $160/MONTHTOTAL FOR GAS AND ELEC ON BUDGET. QUALITY-BUILT. RANGE & REFRIG 6 YRS. ROOF & SIDING NEW -91'.
ⓘ Source: listings_history table (triggers on properties + properties_extension) + one-shot
backfill from property_details.listing_events for pre-trigger history.
Tax reassessment forecast NY · Partial reset (capped growth)
- Current annual tax
- $1,648 · $137/mo
- Projected year-2 tax
- $1,668 · $139/mo
- Expected delta
- +$20/yr (+$2/mo · 1.2%)
ⓘ Screening estimate from a state-policy table — verify with the county assessor before closing.
Climate risk First Street
- Flood 1/10 Low FEMA zone X · 0% chance over 30 yrs
- Wildfire 3/10 Moderate
- Heat 3/10 Moderate 7 d/yr ≥93°F today · 16 d/yr by 30 yrs out
- Wind 2/10 Low 100% chance of damaging wind over 30 yrs
- Air quality 2/10 Low 0 unhealthy d/yr today · 1 by 30 yrs out
Nearby sold comps map
Loading sold comps map…
Walkable amenities ~0.75 mi
Loading nearby amenities…
Taxation est. · year 1
- Rental income
- $22,843
- − Mortgage interest
- −$5,596
- − Property taxes
- −$1,648
- − Insurance
- −$500
- − Repairs & maintenance
- −$1,827
- − Management
- −$1,827
- − Depreciation
- −$2,906
- Taxable income
- $8,538
- Est. tax owed @ 24.0%
- −$2,049
- After-tax cash flow
- $7,562/yr
For passive investors: Depreciation is non-cash, so a rental often shows a tax loss while cash-flowing — sheltering income. Rental losses are passive: they offset passive income freely, and up to $25,000/yr can offset ordinary (W-2) income if you actively participate and your MAGI is under $100k (phasing out to $0 by $150k); unused losses carry forward. On sale, claimed depreciation is recaptured at up to 25%, and gains may owe capital-gains tax (a 1031 exchange can defer both). Figures are a year-1 estimate at your 24.0% rate — not tax advice; consult a CPA.
Schools (NCES district)
- District
- Vestal Central School District
- NCES district ID
- 3629610
- Math proficiency
- 63% ▼ -7.00%
- Reading proficiency
- 68% ▲ 4.00%
- Median HH income
- $64,143
- Composite
- 56.97/100
- National rank
- #1111
- State rank
- #168 of 590 in NY
Livability — Endicott
- Score
- 70/100
- State rank
- #438
- US rank
- #7657
Category grades
Schools grade is shown separately in the Schools card above.
Census & demographics
- City population
- 42,896
- Population (ZIP)
- 23,675
Population outlook (Broome County) Hauer SSP2
- Today (2025)
- 187,989 people
- By 2030
- 183,066 · -2.6%
- By 2040
- 172,228 · -8.4%
- By 2050
- 163,161 · -13.2%
- By 2075
- 153,641 · -18.3%
- By 2100
- 140,851 · -25.1%
Race, ethnicity, and origin ACS 2023
- Neighborhood character
- Predominantly White (78%)
- Race & ethnicity
- White 78% Asian 12% Hispanic / Latino 5% Two or more races 5% Black 2%
- Hispanic origin (detail)
- Puerto Rican 2%
- Common ancestry
- Romanian 6% Scotch-Irish 2% Italian 2%
- Foreign-born
- 14% · China, Canada, South Korea
- Languages at home
- 84% English-only · Chinese 6% Other Indo-European 5% Other Asian/Pacific 2%
Political lean MEDSL · Broome
- 2024 margin
- Toss-up / Even · D 50.2% · R 49.8%
- 2008→2024 swing
- -7.6pp toward R · 2008: 8.0pp · 2024: 0.4pp
- All cycles
- 2024: D+0.4 2020: D+3.5 2016: R+3.7 2012: D+4.6 2008: D+8.0
Not yet ingested
- Civics
- —
Market trends
- HPI YoY
- ▼ -142.14%
- Current HPI
- 282.4645
- Rent YoY
- —
- Metro
- —
- State GDP YoY
- ▲ 2.60%
- F500 in state
- 92
Industry mix (Fortune 500 HQ in NY)
| Industry | F500 HQs | Revenue |
|---|---|---|
| Financial Services | 10 | $950B |
|
||
| Consumer Goods | 9 | $162B |
|
||
| Insurance | 4 | $225B |
|
||
| Telecommunications | 2 | $144B |
|
||
| Pharmaceuticals | 2 | $112B |
|
||
| Media / Entertainment | 2 | $69B |
|
||
Price history
+48.7% since first listed5 events — show timeline
- 2026-05-21 Pending — GBAOR
- 2026-05-13 Listed $99,900 GBAOR
- 2000-05-10 Sold (Public Records) $67,200 Public Records
- 2000-05-09 Sold (MLS) $67,200 GBAOR
- 2000-03-07 Listed $67,200 GBAOR
Property tax history
-1.5%/yrLatest (2025): $1,648 · +74.1% YoY. Source: county tax records.
Cash-flow waterfall
monthlySold comps — $/sqft
last 12 mo · ≤1 miLoading sold comps…