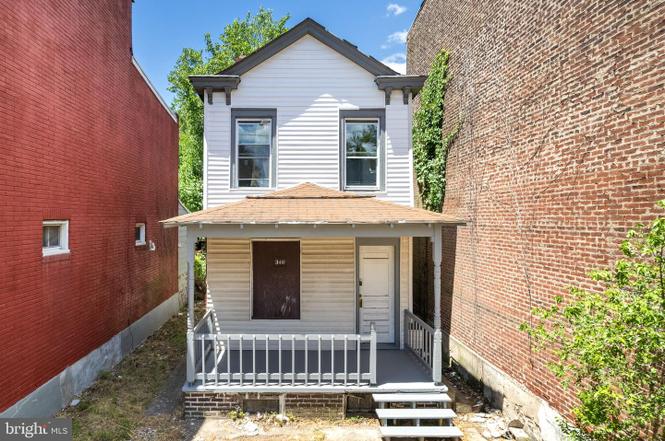
346 Walnut Ave · Trenton, NJ
Flood risk 5/10 · Moderate
- FEMA flood zone
- X (unshaded)
- Chance of flooding over 30 yrs
- 0.24%
- Est. flood insurance / yr
- $507 – $1,088
Fire risk 1/10 · Minimal
- Est. fire insurance / yr
- $526 – $976
Heat risk 6/10 · Moderate
- Hot days now (above 102°F)
- 7 days/yr
- Hot days in 30 yrs
- 15 days/yr
Wind risk 6/10 · Moderate
- Chance of severe wind over 30 yrs
- 27.0%
Air-quality risk 5/10 · Moderate
- Unhealthy air days now
- 6 days/yr
- Unhealthy air days in 30 yrs
- 8 days/yr
Risk factors via First Street. Map © Google.
Why this score? — see what drove the B- grade
The composite is a weighted blend of 9 inputs, each scored 0–100. Each bar is that input's sub-score; the figure is the points it added to the 100-point composite (weight × sub-score).
- Cash flow +30.0/30.0
- DSCR +10.0/10.0
- 1% rule +9.3/10.0
- ARV discount +7.5/15.0
- Livability +3.8/5.0
- Rent growth +2.5/5.0
- Condition / age +2.5/5.0
- Schools +0.7/10.0
- Appreciation +0.0/10.0
$199,000
🖨 Deal sheet (PDF) 📄 Offer letter ✓ Due diligence
Listing remarks MLS
Welcome to 346 Walnut Ave, a promising duplex offering strong projected returns in one of Trenton’s up-and-coming neighborhoods. While it is not currently cash flowing, this property has the potential to generate $3,400–$3,600 per month in rental income—making it a great opportunity for investors seeking a solid cash-on-cash return. With very low annual property taxes of just $2,048, holding costs are minimal, helping to maximize long-term profitability. Each unit features its own separate living space, providing flexibility and appeal to future tenants. Conveniently located near local shops, schools, and public transportation, this duplex is a smart addition to any growing portfolio.
Key facts
- Strong rental demand
- Full rehabilitation
- Two separate units
Tags
Property features AI
Finance
- Financial info: Assessed improvement value recorded; Assessed land value recorded; Recent tax assessment and annual tax recorded
Exterior
- Parking: On-street parking
- Utilities: Public water; Public sewer
- Home design: Detached property; 2-story building; Ownership is fee simple
- Construction: Brick construction; Stone foundation; Above-grade and below-grade structures
- Exterior features: Lot dimensions approximately 25 x 125; No tidal water on property
Interior
- Bedrooms: One 1-bedroom unit; One 2-bedroom unit
- Interior features: Detached structure with two total levels; Two separate residential units
Neighborhood map
What this means for you Summary
Snapshot
- This is a 6-bed/?-bath single-family listed at $199k.
Deal economics
- At list price, monthly cash flow is $948 ($11k/yr) — positive.
- The deal already cash-flows at list — no discount required.
- Meets the 1% rule at list price ($3k rent vs $199k).
- Cap rate 12.0% vs local median 6.3% in Trenton — top-decile yield for the area; either an underpriced asset or a hidden risk that comps aren't pricing in. Stress-test before assuming the spread holds.
Location & tenants
- Location reads 76/100 on livability (#133 in NJ, #3,533 nationally) — a middle-class / working-renter tenant base. Strengths: amenities A+, commute A+, health & safety A+; Watch: schools F, crime F, employment F.
- Trenton Public School District (urban): math 2% / reading 16% proficiency, ranked #471 of 472 in NJ (top 100%) — low school quality limits family demand, transient renter base, plan for 1-2y turnover; 80% free/reduced lunch — lower-income household profile, screen leases tightly.
- Market conditions: 33 active listings in the ZIP; 2,256 units permitted in Mercer County in 2024 (1,303 in 5+ unit buildings).
- At $2,845/mo this rent would consume 50% of the median local household income ($68k/yr) (locally 930% of renters already pay >50% of income on rent) — very limited rent-growth headroom before tenants either downsize or default.
Forward outlook
- Local home prices are declining (-3.0%/yr); year-one equity from $1k of loan paydown is wiped out by about $6k of value loss. Plan a longer hold.
- Mercer County population projected at +4% by 2050 — modest demand growth; plan on rents tracking national, not racing it.
- At projected returns (-3.0% appreciation + 3.0% rent growth), your $56k cash investment doubles in ~6 years — after that, you're playing with house money.
Negotiation context
- Only 1 days on market — expect competitive offers; lowballing is unlikely to land.
- 7 sale attempts since 21y ago with the ask held roughly flat each time — persistent listings suggest the price (not the market) is what's stuck; bring a comps-based counter.
- Current owner paid $95k; list at $199k implies a 109% gain — meaningful room to come down on a strong offer.
Risks & watch-outs
- Watch-outs: built in 1920 — expect roof / HVAC / electrical / plumbing capex.
- Climate carrying-cost: moderate flood risk; major wind risk, 27% chance of damaging wind over 30y; extreme-heat days projected 7→15/yr by 2055 (HVAC capex compounding) — expect insurance premiums to compound above CPI over the hold.
Questions for the listing agent
- Built in 1920 — when were the roof, HVAC, electrical panel, plumbing, and water heater last replaced?
- Is there a deadline driving the sale (1031 exchange, divorce, estate, relocation)? That informs how much negotiation room exists.
- Schools are F-rated, which usually means shorter tenancies and higher turnover. Who's the typical renter profile here, and what's been the actual vacancy rate?
- Crime grade is F in this area — have there been break-ins, vandalism, or insurance claims at this property in the last 3 years? What carrier currently insures it and at what premium?
- What's the average days-on-market for RENTAL listings here right now (not sales)? A rising rental-DOM trend means longer vacancies and softer asking-rent achievability than the comps imply.
- What's the recent tenant-quality profile in this submarket — average credit score on applications, eviction rate, late-payment / NSF rate, and stable-employment percentage? A property-management company in the area should have these aggregated.
- How much new for-sale + rental construction is in the pipeline within 1–3 miles? Heavy new supply typically softens prices + rents 12–24 months out; constrained supply supports both.
Investment metrics
- 1% rule
- 1.43% ✓
- Cap rate
- 12.01%
- Cash-on-cash
- 20.41%
- DSCR
- 1.91
- GRM
- 5.8
CMA / ARV
No comps found within radius.
Projected returns pro-forma
-3.0% appreciation · 3.0% rent growth · sell at horizon
- IRR
- 12.7%
- Equity multiple
- 1.50×
- Total profit
- $28,116
- Equity at exit
- $29,672
- IRR
- 21.6%
- Equity multiple
- 2.83×
- Total profit
- $102,199
- Equity at exit
- $17,206
Cash invested: $55,720 (down + closing). Projections, not guarantees.
Landlord ↔ Tenant lean methodology
- Overall (STATE)
- 21 Tenant-Leaning
- State New Jersey
- 21 Tenant-Leaning · D+6
- County
- — inherits STATE
- City
- — inherits STATE
ZIP-level market 08609
- Home prices YoY
- -29.3%
- Active inventory
- 33
- Price-to-rent
- 5.8×
Monthly cashflow live
- Estimated rent
- $2,845 medium interval (Pro) →
- Mortgage (P&I)
- −$1,044
- Tax from tax record
- −$173 /mo · $2,079/yr
- Insurance
- −$83
- HOA
- −$0
- Vacancy / Maint / Mgmt
- −$597
- Net cashflow
- $948
Break-even live
Sensitivity live
| Price | -10% $1,060 | -5% $1,004 | +0% $948 | +5% $891 | +10% $835 |
|---|---|---|---|---|---|
| Rent | -10% $723 | -5% $835 | +0% $948 | +5% $1,060 | +10% $1,173 |
| Rate | -1.0pp $1,048 | -0.5pp $998 | base $948 | +0.5pp $896 | +1.0pp $844 |
UW: 25.0% down · 7.5% · 30yr · 1.5% tax · 5.0% vac · 8.0% maint · 8.0% mgmt
Financing live
Cash to close
- Down payment
- $49,750
- Closing costs
- $5,970
- Reserves months
- —
- Total cash needed
- —
Loan-product check · same deal, 3 products live
Conventional
25% down · 7.5% · 30yr
- Down + closing
- —
- Monthly P&I
- —
- Monthly cashflow
- —
- DSCR
- —
- Eligible?
- —
Personal DTI + credit; lowest rate.
DSCR
20% down · 8.5% · 30yr
- Down + closing
- —
- Monthly P&I
- —
- Monthly cashflow
- —
- DSCR
- —
- Eligible?
- —
No personal income docs; deal must DSCR.
Hard money
10% down · 12.0% · 12mo
- Down + closing
- —
- Monthly P&I
- —
- Monthly cashflow
- —
- DSCR
- —
- Eligible?
- —
Short-term bridge; refi at stabilization.
Listing history 2 events
-
2026-06-19remarks 687-char remark
-
2026-06-19$199,000 Active 1 DOM
ⓘ Source: listings_history table (triggers on properties + properties_extension) + one-shot
backfill from property_details.listing_events for pre-trigger history.
Tax reassessment forecast NJ · Partial reset (capped growth)
- Current annual tax
- $2,079 · $173/mo
- Projected year-2 tax
- $3,517 · $293/mo
- Expected delta
- +$1,438/yr (+$120/mo · 69.2%)
ⓘ Screening estimate from a state-policy table — verify with the county assessor before closing.
Climate risk First Street
- Flood 5/10 Major FEMA zone X (unshaded) · 24% chance over 30 yrs
- Wildfire 1/10 Low
- Heat 6/10 Major 7 d/yr ≥102°F today · 15 d/yr by 30 yrs out
- Wind 6/10 Major 27% chance of damaging wind over 30 yrs
- Air quality 5/10 Major 6 unhealthy d/yr today · 8 by 30 yrs out
Nearby sold comps map
Loading sold comps map…
Walkable amenities ~0.75 mi
Loading nearby amenities…
Taxation est. · year 1
- Rental income
- $34,140
- − Mortgage interest
- −$11,147
- − Property taxes
- −$2,079
- − Insurance
- −$995
- − Repairs & maintenance
- −$2,731
- − Management
- −$2,731
- − Depreciation
- −$5,789
- Taxable income
- $8,667
- Est. tax owed @ 24.0%
- −$2,080
- After-tax cash flow
- $9,293/yr
For passive investors: Depreciation is non-cash, so a rental often shows a tax loss while cash-flowing — sheltering income. Rental losses are passive: they offset passive income freely, and up to $25,000/yr can offset ordinary (W-2) income if you actively participate and your MAGI is under $100k (phasing out to $0 by $150k); unused losses carry forward. On sale, claimed depreciation is recaptured at up to 25%, and gains may owe capital-gains tax (a 1031 exchange can defer both). Figures are a year-1 estimate at your 24.0% rate — not tax advice; consult a CPA.
Schools (NCES district)
- District
- Trenton Public School District
- NCES district ID
- 3416290
- Math proficiency
- 2% ▼ -8.00%
- Reading proficiency
- 16% ▼ -4.00%
- Median HH income
- $35,078
- Composite
- 7.31/100
- National rank
- #9956
- State rank
- #471 of 472 in NJ
Livability — Trenton
- Score
- 76/100
- State rank
- #133
- US rank
- #3533
Category grades
Schools grade is shown separately in the Schools card above.
Census & demographics
- Census place
- Trenton, NJ
- County
- Mercer County · 327,655 people
- City population
- 177,819
- Metro
- Trenton-Princeton, NJ
- Population (ZIP)
- 15,938
- Household income
- $68,238
- Rent vs Own
- Severe rent burden
- 930.0
Population outlook (Mercer County) Hauer SSP2
- Today (2025)
- 381,395 people
- By 2030
- 384,640 · +0.9%
- By 2040
- 391,431 · +2.6%
- By 2050
- 397,845 · +4.3%
- By 2075
- 417,281 · +9.4%
- By 2100
- 420,327 · +10.2%
Race, ethnicity, and origin ACS 2023
- Neighborhood character
- Diverse neighborhood (Simpson 0.61)
- Race & ethnicity
- Hispanic / Latino 45% Black 43% Two or more races 12% White 8% Asian 1%
- Hispanic origin (detail)
- Mexican 3% Puerto Rican 9% Dominican 11%
- Common ancestry
- Hispanic 5% Swiss 2% Estonian 1%
- Foreign-born
- 32% · Canada, Guatemala, China
- Languages at home
- 51% English-only · Spanish 41% French/Haitian/Cajun 2% Other Indo-European 2%
Political lean MEDSL · Mercer
- 2024 margin
- Solid D (+33.9) · D 65.9% · R 32.0% · Other 2.1%
- 2008→2024 swing
- -2.2pp toward R · 2008: 36.1pp · 2024: 33.9pp
- All cycles
- 2024: D+33.9 2020: D+40.0 2016: D+36.2 2012: D+36.8 2008: D+36.1
Not yet ingested
- Civics
- —
Market trends
- HPI YoY
- ▼ -114.12%
- Current HPI
- 275.8566
- Rent YoY
- —
- Metro
- Trenton-Princeton, NJ
- State GDP YoY
- ▲ 2.05%
- F500 in state
- 34
Industry mix (Fortune 500 HQ in NJ)
| Industry | F500 HQs | Revenue |
|---|---|---|
| Consumer Goods | 3 | $31B |
|
||
| Pharmaceuticals | 2 | $153B |
|
||
| Technology | 2 | $21B |
|
||
| Insurance | 2 | $20B |
|
||
| Healthcare | 2 | $19B |
|
||
| Financial Services | 1 | $70B |
|
||
Price history
-54.8% since first listed25 events — show timeline
- 2026-06-18 Listed $199,000 BRIGHT MLS
- 2026-05-08 Listing Removed — BRIGHT MLS
- 2026-05-03 Price Changed $195,000 BRIGHT MLS
- 2026-03-04 Listed $214,000 BRIGHT MLS
- 2026-02-20 Sold (Public Records) $95,000 Public Records
- 2026-02-20 Sold (Public Records) $95,000 Public Records
- 2026-02-17 Sold (MLS) $95,000 BRIGHT MLS
- 2025-12-08 Pending — BRIGHT MLS
- 2025-12-08 Listing Removed — BRIGHT MLS
- 2025-12-01 Contingent — BRIGHT MLS
- 2025-11-16 Price Changed $110,000 BRIGHT MLS
- 2025-10-08 Listed $119,900 BRIGHT MLS
- 2008-03-20 Listing Removed — BRIGHT MLS
- 2007-09-21 Listed $100,000 BRIGHT MLS
- 2007-07-24 Listing Removed — BRIGHT MLS
- 2007-01-25 Listed $100,000 BRIGHT MLS
- 2007-01-13 Listing Removed — BRIGHT MLS
- 2006-10-19 Listed $74,900 BRIGHT MLS
- 2005-06-27 Sold (Public Records) $29,000 Public Records
- 2005-05-27 Sold (MLS) $29,000 BRIGHT MLS
- 2005-05-10 Sold (Public Records) $29,000 Public Records
- 2005-03-29 Listing Removed — BRIGHT MLS
- 2005-02-23 Listed $29,000 BRIGHT MLS
- 2002-11-04 Sold (Public Records) $440,500 Public Records
- 2002-11-04 Sold (Public Records) $440,500 Public Records
Property tax history
-0.1%/yrLatest (2025): $2,079 · +1.5% YoY. Source: county tax records.
Cash-flow waterfall
monthlySold comps — $/sqft
last 12 mo · ≤1 miLoading sold comps…