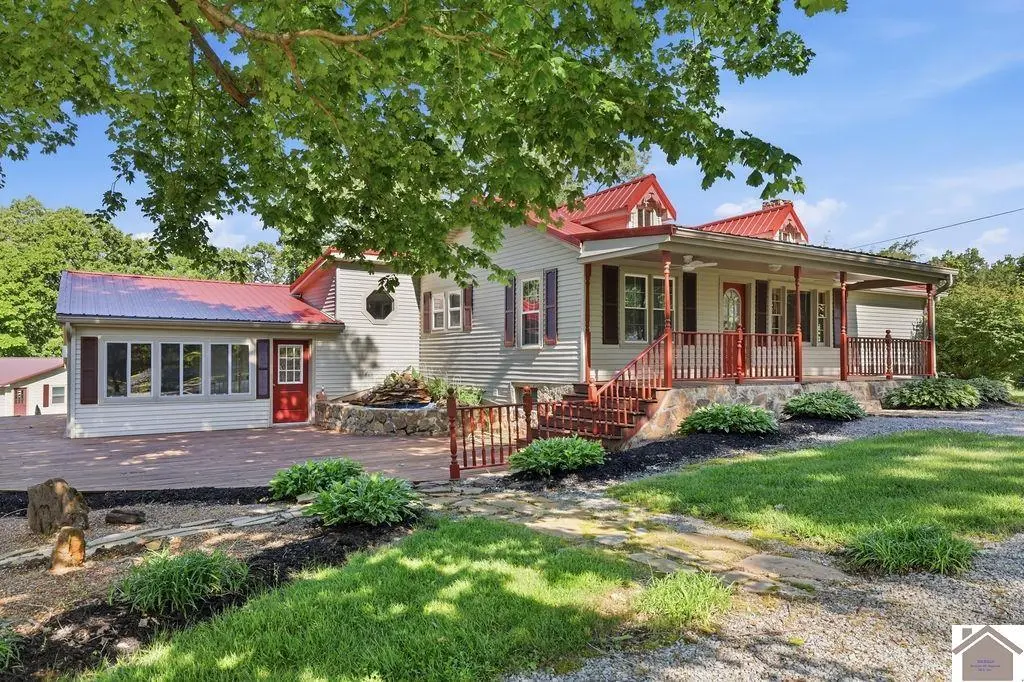
70 BM Blankenship Ln · Hardin, KY
Flood risk 1/10 · Minimal
- FEMA flood zone
- X (unshaded)
- Chance of flooding over 30 yrs
- 0.0%
- Est. flood insurance / yr
- $507 – $1,088
Fire risk 3/10 · Minor
- Est. fire insurance / yr
- $839 – $1,559
Heat risk 5/10 · Moderate
- Hot days now (above 109°F)
- 7 days/yr
- Hot days in 30 yrs
- 20 days/yr
Wind risk 4/10 · Minor
- Chance of severe wind over 30 yrs
- 8.0%
Air-quality risk 1/10 · Minimal
- Unhealthy air days now
- 0 days/yr
- Unhealthy air days in 30 yrs
- 0 days/yr
Risk factors via First Street. Map © Google.
Why this score? — see what drove the D grade
The composite is a weighted blend of 9 inputs, each scored 0–100. Each bar is that input's sub-score; the figure is the points it added to the 100-point composite (weight × sub-score).
- ARV discount +15.0/15.0
- Appreciation +10.0/10.0
- Cash flow +4.9/30.0
- Schools +2.9/10.0
- Livability +2.7/5.0
- Rent growth +2.5/5.0
- Condition / age +2.5/5.0
- 1% rule +0.0/10.0
- DSCR +0.0/10.0
$396,000
🖨 Deal sheet 📄 Offer letter ✓ Due diligence
Listing remarks
Rare and Unique home located right on KY Lake/Jonathan Creek. Enjoy the outdoors with over 4.7 acres that includes a beautiful fully stocked pond with a dock for fishing or gazing. This abuts 54 acres of TVA land connected to the lake, which is great for hunting deer and turkey provides water view year round of the lake. This property features a heated detached garage, a detached carport, a front porch to sit out on and enjoy your lake view, coy pond, a large deck from the walk out basement built to support an above ground pool. Inside you'll find a newly remodeled kitchen, a Mama Bear wood burning stove, a neat loft off of the living room with a ladder access. 2 Bedrooms and one bath upsta
Key facts
- 54 acres of tva land
- Fully stocked pond
- Dock for fishing
Tags
Property features AI
Finance
- Other: Below-grade finished area included; Approximately 4.7-acre lot
Exterior
- Parking: Detached 2-car garage; Carport (1 space); Circular driveway; Gravel driveway
- Utilities: Cable available; Septic tank
- Home design: Single-family residence; Residential property
- Construction: Built with stone and vinyl siding; Metal roof; Slab foundation
- Exterior features: Deck; Outbuilding; Property has a view; Level lot
Interior
- Kitchen: Dishwasher; Cooktop; Refrigerator; Electric water heater
- Flooring: Laminate flooring; Vinyl flooring; Wood flooring
- Bathrooms: 2 full bathrooms
- Heating & cooling: Central air; Ceiling fans; Forced air heating; Electric heating; Wood stove
- Interior features: Living room fireplace; Finished walk-out basement
- Laundry & utility: Washer and dryer (washer/dryer listed as appliances); Laundry in basement
Neighborhood map
What this means for you Summary
Snapshot
- This is a 3-bed/2.0-bath single-family listed at $396k.
Deal economics
- At list price, monthly cash flow is $-945 ($-11k/yr) — negative.
- To cash-flow at today's rent, offer at most $229k (42.1% below list).
- To meet the 1% rule (rent ≥ 1% of price), the offer needs to be $173k (56.4% below list).
- Recommended offer: $173k (56.4% below list) — sets the bar for 1% rule.
Location & tenants
- Location reads 54/100 on livability (#476 in KY) — a working-class tenant base; expect higher turnover. Strengths: cost of living A+, housing A-; Watch: amenities F, commute F, employment F.
- Marshall County (rural): math 29% / reading 38% proficiency, ranked #73 of 165 in KY (top 44%) — families likely to look elsewhere, expect single-tenant / working-renter base with shorter leases.
- Zoned schools: Jonathan Elementary School (math 17% / reading 32%, grade F, #489 of 676 statewide, top 76%, 238 students, 72% FRL); South Marshall Middle (math 21% / reading 39%, grade F, #146 of 217 statewide, top 69%, 462 students, 55% FRL) — zoned schools average 63% FRL vs 43% district-wide (20 pts higher); higher-poverty schools than district average — tighter screening recommended.
- Market conditions: 178 active listings in the ZIP; 121 units permitted in Marshall County in 2024 (5 in 5+ unit buildings).
Forward outlook
- In year one you build about $42k of equity ($3k loan paydown + $40k appreciation (10.0% local appreciation)).
- Marshall County population projected to shrink 9% by 2050 — rents likely to lag national; underwrite the cash flow, not the appreciation.
- By year 2, paydown + projected appreciation supports a ~$68k cash-out refi (75% LTV) — recoverable capital for the next deal without selling this one.
Negotiation context
- It's been on market 32 days — a 3% lower offer ($384k) is reasonable based on typical stale-listing flexibility.
Risks & watch-outs
- Climate carrying-cost: extreme-heat days projected 7→20/yr by 2055 (HVAC capex compounding) — expect insurance premiums to compound above CPI over the hold.
Questions for the listing agent
- What do current leases actually rent for vs. the listed asking? Can we see a recent rent roll and the last 12 months of T-12 income?
- It's been on market 32 days. Have you received any prior offers? Is the seller open to a 56% concession, seller financing, or rate buy-down credit?
- Is there a deadline driving the sale (1031 exchange, divorce, estate, relocation)? That informs how much negotiation room exists.
- Schools are F-rated, which usually means shorter tenancies and higher turnover. Who's the typical renter profile here, and what's been the actual vacancy rate?
- The area grade is low — what's the realistic commute time and amenity access for the typical tenant pool here? Any planned neighborhood developments (good or bad) we should know about?
- What's the average days-on-market for RENTAL listings here right now (not sales)? A rising rental-DOM trend means longer vacancies and softer asking-rent achievability than the comps imply.
- What's the recent tenant-quality profile in this submarket — average credit score on applications, eviction rate, late-payment / NSF rate, and stable-employment percentage? A property-management company in the area should have these aggregated.
- How much new for-sale + rental construction is in the pipeline within 1–3 miles? Heavy new supply typically softens prices + rents 12–24 months out; constrained supply supports both.
Investment metrics
- 1% rule
- 0.44% ✗
- Cap rate
- 3.43%
- Cash-on-cash
- -10.22%
- DSCR
- 0.55
- GRM
- 19.1
CMA / ARV
- ARV (median comp)
- $495,887
- List price
- $396,000
- Delta
- -20.14%
- Verdict
- UNDERPRICED
- Comps
- 3 within 1.0 mi
Projected returns pro-forma
10.0% appreciation · 3.0% rent growth · sell at horizon
- IRR
- 17.1%
- Equity multiple
- 2.40×
- Total profit
- $155,277
- Equity at exit
- $356,748
- IRR
- 16.2%
- Equity multiple
- 5.55×
- Total profit
- $504,101
- Equity at exit
- $769,341
Cash invested: $110,880 (down + closing). Projections, not guarantees.
Landlord ↔ Tenant lean methodology
- Overall (STATE)
- 83 Strongly Landlord-Friendly
- State Kentucky
- 83 Strongly Landlord-Friendly · R+16
- County
- — inherits STATE
- City
- — inherits STATE
ZIP-level market 42025
- Home prices YoY
- 7.1%
- Active inventory
- 178
- Price-to-rent
- 19.1×
Monthly cashflow live
- Estimated rent
- $1,726 medium interval (Pro) →
- Mortgage (P&I)
- −$2,077
- Tax from tax record
- −$67 /mo · $802/yr
- Insurance
- −$165
- HOA
- −$0
- Vacancy / Maint / Mgmt
- −$363
- Net cashflow
- $-945
Break-even live
UW: 25.0% down · 7.5% · 30yr · 1.5% tax · 5.0% vac · 8.0% maint · 8.0% mgmt
Financing live
Cash to close
- Down payment
- $99,000
- Closing costs
- $11,880
- Reserves months
- —
- Total cash needed
- —
Loan-product check · same deal, 3 products live
Conventional
25% down · 7.5% · 30yr
- Down + closing
- —
- Monthly P&I
- —
- Monthly cashflow
- —
- DSCR
- —
- Eligible?
- —
Personal DTI + credit; lowest rate.
DSCR
20% down · 8.5% · 30yr
- Down + closing
- —
- Monthly P&I
- —
- Monthly cashflow
- —
- DSCR
- —
- Eligible?
- —
No personal income docs; deal must DSCR.
Hard money
10% down · 12.0% · 12mo
- Down + closing
- —
- Monthly P&I
- —
- Monthly cashflow
- —
- DSCR
- —
- Eligible?
- —
Short-term bridge; refi at stabilization.
Listing history 10 events
-
2026-06-12statusdays on market $396,000 Pending 32 DOM
-
2026-06-09days on market $396,000 Active 29 DOM
-
2026-06-08days on market $396,000 Active 28 DOM
-
2026-06-07days on market $396,000 Active 27 DOM
-
2026-06-03days on market $396,000 Active 23 DOM
-
2026-06-02days on market $396,000 Active 22 DOM
-
2026-06-01days on market $396,000 Active 21 DOM
-
2026-05-31days on market $396,000 Active 20 DOM
-
2026-05-30days on market $396,000 Active 19 DOM
-
2026-05-07$396,000 Active 770-char remark
ⓘ Source: listings_history table (triggers on properties + properties_extension) + one-shot
backfill from property_details.listing_events for pre-trigger history.
Tax reassessment forecast KY · Resets to sale price
- Current annual tax
- $802 · $67/mo
- Projected year-2 tax
- $3,406 · $284/mo
- Expected delta
- +$2,604/yr (+$217/mo · 324.8%)
ⓘ Screening estimate from a state-policy table — verify with the county assessor before closing.
Climate risk First Street
- Flood 1/10 Low FEMA zone X (unshaded) · 0% chance over 30 yrs
- Wildfire 3/10 Moderate
- Heat 5/10 Major 7 d/yr ≥109°F today · 20 d/yr by 30 yrs out
- Wind 4/10 Moderate 8% chance of damaging wind over 30 yrs
- Air quality 1/10 Low 0 unhealthy d/yr today · 0 by 30 yrs out
Nearby sold comps map
Loading sold comps map…
Walkable amenities ~0.75 mi
Loading nearby amenities…
Taxation est. · year 1
- Rental income
- $20,718
- − Mortgage interest
- −$22,182
- − Property taxes
- −$802
- − Insurance
- −$1,980
- − Repairs & maintenance
- −$1,657
- − Management
- −$1,657
- − Depreciation
- −$11,520
- Taxable loss
- −$19,081
- Est. tax savings @ 24.0%
- +$4,579
- After-tax cash flow
- $-6,755/yr
For passive investors: Depreciation is non-cash, so a rental often shows a tax loss while cash-flowing — sheltering income. Rental losses are passive: they offset passive income freely, and up to $25,000/yr can offset ordinary (W-2) income if you actively participate and your MAGI is under $100k (phasing out to $0 by $150k); unused losses carry forward. On sale, claimed depreciation is recaptured at up to 25%, and gains may owe capital-gains tax (a 1031 exchange can defer both). Figures are a year-1 estimate at your 24.0% rate — not tax advice; consult a CPA.
Schools (NCES district)
- District
- Marshall County
- NCES district ID
- 2103810
- Math proficiency
- 29% ▼ -7.00%
- Reading proficiency
- 38% ▼ -16.00%
- Median HH income
- $45,324
- Composite
- 28.62/100
- National rank
- #6710
- State rank
- #73 of 165 in KY
Livability — Hardin
- Score
- 54/100
- State rank
- #476
- US rank
- #23849
Category grades
Schools grade is shown separately in the Schools card above.
Census & demographics
- Population (ZIP)
- 19,238
Population outlook (Marshall County) Hauer SSP2
- Today (2025)
- 30,647 people
- By 2030
- 30,276 · -1.2%
- By 2040
- 29,232 · -4.6%
- By 2050
- 27,940 · -8.8%
- By 2075
- 25,289 · -17.5%
- By 2100
- 21,188 · -30.9%
Race, ethnicity, and origin ACS 2023
- Neighborhood character
- Predominantly White (95%)
- Race & ethnicity
- White 95% Two or more races 2% Hispanic / Latino 2%
- Common ancestry
- Iranian 2% Slovak 2% Lithuanian 2%
- Foreign-born
- 1% · Canada
- Languages at home
- 98% English-only · Spanish 1%
Political lean MEDSL · Marshall
- 2024 margin
- Solid R (+56.7) · D 21.0% · R 77.7% · Other 1.3%
- 2008→2024 swing
- -32.0pp toward R · 2008: -24.7pp · 2024: -56.7pp
- All cycles
- 2024: R+56.7 2020: R+52.4 2016: R+51.9 2012: R+34.2 2008: R+24.7
Not yet ingested
- Civics
- —
Market trends
- HPI YoY
- ▲ 19.11%
- Current HPI
- 288.75
- Rent YoY
- —
- Metro
- —
- State GDP YoY
- ▲ 1.81%
- F500 in state
- 4
Industry mix (Fortune 500 HQ in KY)
| Industry | F500 HQs | Revenue |
|---|---|---|
| Healthcare | 1 | $118B |
|
||
| Food / Beverage | 1 | $7B |
|
||
Price history
2 events — show timeline
- 2026-06-12 Pending — WKRMLS
- 2026-05-07 Listed $396,000 WKRMLS
Property tax history
+1.5%/yrLatest (2025): $802 · +178.2% YoY. Source: county tax records.
Cash-flow waterfall
monthlySold comps — $/sqft
last 12 mo · ≤1 miLoading sold comps…