 150-Plex
9192 Vanity Fair Dr · Jennings, MO
Flood risk 1/10 · Minimal
- FEMA flood zone
- X (unshaded)
- Chance of flooding over 30 yrs
- 0.0%
- Est. flood insurance / yr
- $507 – $1,088
Fire risk 1/10 · Minimal
- Est. fire insurance / yr
- $1,054 – $1,958
Heat risk 5/10 · Moderate
- Hot days now (above 107°F)
- 7 days/yr
- Hot days in 30 yrs
- 21 days/yr
Wind risk 2/10 · Minimal
- Chance of severe wind over 30 yrs
- 1.0%
Air-quality risk 4/10 · Minor
- Unhealthy air days now
- 4 days/yr
- Unhealthy air days in 30 yrs
- 5 days/yr
Risk factors via First Street. Map © Google.
Why this score? — see what drove the B grade
The composite is a weighted blend of 9 inputs, each scored 0–100. Each bar is that input's sub-score; the figure is the points it added to the 100-point composite (weight × sub-score).
- Cash flow +30.0/30.0
- 1% rule +10.0/10.0
- DSCR +10.0/10.0
- ARV discount +7.5/15.0
- Appreciation +6.9/10.0
- Rent growth +3.7/5.0
- Livability +3.4/5.0
- Condition / age +2.8/5.0
- Schools +0.4/10.0
$7,900,000
🖨 Deal sheet 📄 Offer letter ✓ Due diligence
Multi-family units
County records classify this as Multi-Family (5+ Unit). Listing-text estimate: 150 units. confirmed
5+ unit building — per-unit beds/baths from public records are typically unavailable; the breakdown below (if shown) is an estimate from the listing text.
Listing remarks MLS
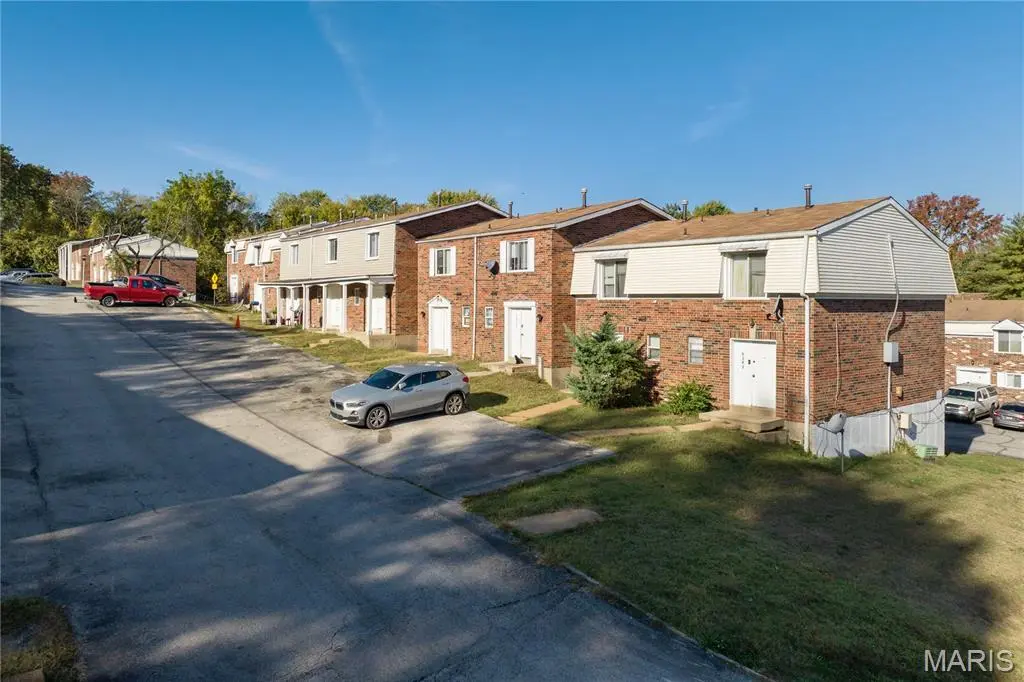
Woodknoll Townhomes is a 150-unit apartment community located in St. Louis, Missouri. Built in 1971, the Property offers an investor the rare opportunity to acquire a stabilized asset with proven operating performance and tremendous upside potential. Most of the units are in classic or near classic condition, allowing new ownership the opportunity to push rents through further continued unit upgrades or increasing in-place rents to market rate. The Property features a mix of 2-bedroom and 3-bedroom units. Unit amenities include full basements with finished entertainment space and utility area with washer/dryer hookups, linen closets, updated flooring, and newer windows.
Key facts
- 7.62 acre lot
- 304 parking spots
- Built 1971
Neighborhood map
What this means for you Summary
Snapshot
- This is a 100×2bd/1ba + 50×3bd/1ba units multifamily listed at $7.90M. Condition is rated average.
Deal economics
- At list price, monthly cash flow is $97k ($1.16M/yr) — positive. Per door: $646/mo.
- The deal already cash-flows at list — no discount required.
- Meets the 1% rule at list price ($192k rent vs $7.90M).
- Recommended offer: $6.95M (12.0% below list) — sets the bar for market timing.
- Cap rate 21.0% vs local median 12.2% in Jennings — top-decile yield for the area; either an underpriced asset or a hidden risk that comps aren't pricing in. Stress-test before assuming the spread holds.
Location & tenants
- Location reads 67/100 on livability (#208 in MO) — a middle-class / working-renter tenant base. Strengths: cost of living A+, commute A-, housing A-; Watch: schools D-, crime F, amenities F.
- Riverview Gardens (suburban): math 2% / reading 9% proficiency, ranked #324 of 324 in MO (top 100%) — low school quality limits family demand, transient renter base, plan for 1-2y turnover; 90% free/reduced lunch — lower-income household profile, screen leases tightly.
- Market conditions: Rents rising fast (+5.0%/yr); 372 active listings in the ZIP; lower-income renter base — watch delinquency; 920 units permitted in St. Louis County in 2024 (250 in 5+ unit buildings).
- At $191,808/mo this rent would consume 5593% of the median local household income ($41k/yr) (locally 3085% of renters already pay >50% of income on rent) — very limited rent-growth headroom before tenants either downsize or default.
Forward outlook
- In year one you build about $354k of equity ($55k loan paydown + $299k appreciation (3.8% local appreciation)).
- At projected returns (3.8% appreciation + 5.0% rent growth), your $2.21M cash investment doubles in ~2 years — after that, you're playing with house money.
- By year 2, paydown + projected appreciation supports a ~$571k cash-out refi (75% LTV) — recoverable capital for the next deal without selling this one.
Negotiation context
- It's been on market 199 days — a 12% lower offer ($6.95M) is reasonable based on typical stale-listing flexibility.
Risks & watch-outs
- Climate carrying-cost: extreme-heat days projected 7→21/yr by 2055 (HVAC capex compounding) — expect insurance premiums to compound above CPI over the hold.
Questions for the listing agent
- It's been on market 199 days. Have you received any prior offers? Is the seller open to a 12% concession, seller financing, or rate buy-down credit?
- Can we see the unit-by-unit rent roll, current vacancy, and any below-market leases? What's the average tenancy length?
- What capital expenditures (roof, boiler, parking lot, exteriors) have been made in the last 5 years, and what's planned in the next 2?
- Built in 1971 — when were the roof, HVAC, electrical panel, plumbing, and water heater last replaced?
- Why hasn't it sold? Are there any deal-killer items the seller is aware of (foundation, flood, title, zoning, code violations)?
- Is there a deadline driving the sale (1031 exchange, divorce, estate, relocation)? That informs how much negotiation room exists.
- Schools are D-rated, which usually means shorter tenancies and higher turnover. Who's the typical renter profile here, and what's been the actual vacancy rate?
- Crime grade is F in this area — have there been break-ins, vandalism, or insurance claims at this property in the last 3 years? What carrier currently insures it and at what premium?
- What's the average days-on-market for RENTAL listings here right now (not sales)? A rising rental-DOM trend means longer vacancies and softer asking-rent achievability than the comps imply.
- What's the recent tenant-quality profile in this submarket — average credit score on applications, eviction rate, late-payment / NSF rate, and stable-employment percentage? A property-management company in the area should have these aggregated.
- How much new apartment / multifamily construction is in the pipeline within 1–3 miles? Heavy new supply (>2% of stock underway) typically softens rents 12–24 months out; light construction supports rent growth.
Investment metrics
- 1% rule
- 2.43% ✓
- Cap rate
- 21.02%
- Cash-on-cash
- 52.59%
- DSCR
- 3.34
- GRM
- 3.4
CMA / ARV
No comps found within radius.
Projected returns pro-forma
3.79% appreciation · 4.97% rent growth · sell at horizon
- IRR
- 60.4%
- Equity multiple
- 4.55×
- Total profit
- $7,851,180
- Equity at exit
- $3,908,826
- IRR
- 60.0%
- Equity multiple
- 9.82×
- Total profit
- $19,515,071
- Equity at exit
- $6,317,334
Cash invested: $2,212,000 (down + closing). Projections, not guarantees.
Landlord ↔ Tenant lean methodology
- Overall (STATE)
- 81 Strongly Landlord-Friendly
- State Missouri
- 81 Strongly Landlord-Friendly · R+10
- County
- — inherits STATE
- City
- — inherits STATE
ZIP-level market 63136
- Home prices YoY
- 0.9%
- Rents YoY
- 5.0%
- Active inventory
- 372
- Price-to-rent
- 523.7×
Monthly cashflow live
- Estimated rent
- $191,808 high interval (Pro) →
- Mortgage (P&I)
- −$41,428
- Tax est. 1.5%
- −$9,875 /mo · $118,500/yr
- Insurance
- −$3,292
- HOA
- −$0
- Vacancy / Maint / Mgmt
- −$40,280
- Net cashflow
- $96,933
Break-even live
150-unit breakdown (identical units grouped — click to expand)
| Units | Beds | Baths | Est. rent |
|---|---|---|---|
| 100× units | 2 | 1 | $125,700 |
| #1 | 2 | 1 | $1,257 |
| #2 | 2 | 1 | $1,257 |
| #3 | 2 | 1 | $1,257 |
| #4 | 2 | 1 | $1,257 |
| #5 | 2 | 1 | $1,257 |
| #6 | 2 | 1 | $1,257 |
| #7 | 2 | 1 | $1,257 |
| #8 | 2 | 1 | $1,257 |
| #9 | 2 | 1 | $1,257 |
| #10 | 2 | 1 | $1,257 |
| #11 | 2 | 1 | $1,257 |
| #12 | 2 | 1 | $1,257 |
| #13 | 2 | 1 | $1,257 |
| #14 | 2 | 1 | $1,257 |
| #15 | 2 | 1 | $1,257 |
| #16 | 2 | 1 | $1,257 |
| #17 | 2 | 1 | $1,257 |
| #18 | 2 | 1 | $1,257 |
| #19 | 2 | 1 | $1,257 |
| #20 | 2 | 1 | $1,257 |
| #21 | 2 | 1 | $1,257 |
| #22 | 2 | 1 | $1,257 |
| #23 | 2 | 1 | $1,257 |
| #24 | 2 | 1 | $1,257 |
| #25 | 2 | 1 | $1,257 |
| #26 | 2 | 1 | $1,257 |
| #27 | 2 | 1 | $1,257 |
| #28 | 2 | 1 | $1,257 |
| #29 | 2 | 1 | $1,257 |
| #30 | 2 | 1 | $1,257 |
| #31 | 2 | 1 | $1,257 |
| #32 | 2 | 1 | $1,257 |
| #33 | 2 | 1 | $1,257 |
| #34 | 2 | 1 | $1,257 |
| #35 | 2 | 1 | $1,257 |
| #36 | 2 | 1 | $1,257 |
| #37 | 2 | 1 | $1,257 |
| #38 | 2 | 1 | $1,257 |
| #39 | 2 | 1 | $1,257 |
| #40 | 2 | 1 | $1,257 |
| #41 | 2 | 1 | $1,257 |
| #42 | 2 | 1 | $1,257 |
| #43 | 2 | 1 | $1,257 |
| #44 | 2 | 1 | $1,257 |
| #45 | 2 | 1 | $1,257 |
| #46 | 2 | 1 | $1,257 |
| #47 | 2 | 1 | $1,257 |
| #48 | 2 | 1 | $1,257 |
| #49 | 2 | 1 | $1,257 |
| #50 | 2 | 1 | $1,257 |
| #51 | 2 | 1 | $1,257 |
| #52 | 2 | 1 | $1,257 |
| #53 | 2 | 1 | $1,257 |
| #54 | 2 | 1 | $1,257 |
| #55 | 2 | 1 | $1,257 |
| #56 | 2 | 1 | $1,257 |
| #57 | 2 | 1 | $1,257 |
| #58 | 2 | 1 | $1,257 |
| #59 | 2 | 1 | $1,257 |
| #60 | 2 | 1 | $1,257 |
| #61 | 2 | 1 | $1,257 |
| #62 | 2 | 1 | $1,257 |
| #63 | 2 | 1 | $1,257 |
| #64 | 2 | 1 | $1,257 |
| #65 | 2 | 1 | $1,257 |
| #66 | 2 | 1 | $1,257 |
| #67 | 2 | 1 | $1,257 |
| #68 | 2 | 1 | $1,257 |
| #69 | 2 | 1 | $1,257 |
| #70 | 2 | 1 | $1,257 |
| #71 | 2 | 1 | $1,257 |
| #72 | 2 | 1 | $1,257 |
| #73 | 2 | 1 | $1,257 |
| #74 | 2 | 1 | $1,257 |
| #75 | 2 | 1 | $1,257 |
| #76 | 2 | 1 | $1,257 |
| #77 | 2 | 1 | $1,257 |
| #78 | 2 | 1 | $1,257 |
| #79 | 2 | 1 | $1,257 |
| #80 | 2 | 1 | $1,257 |
| #81 | 2 | 1 | $1,257 |
| #82 | 2 | 1 | $1,257 |
| #83 | 2 | 1 | $1,257 |
| #84 | 2 | 1 | $1,257 |
| #85 | 2 | 1 | $1,257 |
| #86 | 2 | 1 | $1,257 |
| #87 | 2 | 1 | $1,257 |
| #88 | 2 | 1 | $1,257 |
| #89 | 2 | 1 | $1,257 |
| #90 | 2 | 1 | $1,257 |
| #91 | 2 | 1 | $1,257 |
| #92 | 2 | 1 | $1,257 |
| #93 | 2 | 1 | $1,257 |
| #94 | 2 | 1 | $1,257 |
| #95 | 2 | 1 | $1,257 |
| #96 | 2 | 1 | $1,257 |
| #97 | 2 | 1 | $1,257 |
| #98 | 2 | 1 | $1,257 |
| #99 | 2 | 1 | $1,257 |
| #100 | 2 | 1 | $1,257 |
| 50× units | 3 | 1 | $66,100 |
| #101 | 3 | 1 | $1,322 |
| #102 | 3 | 1 | $1,322 |
| #103 | 3 | 1 | $1,322 |
| #104 | 3 | 1 | $1,322 |
| #105 | 3 | 1 | $1,322 |
| #106 | 3 | 1 | $1,322 |
| #107 | 3 | 1 | $1,322 |
| #108 | 3 | 1 | $1,322 |
| #109 | 3 | 1 | $1,322 |
| #110 | 3 | 1 | $1,322 |
| #111 | 3 | 1 | $1,322 |
| #112 | 3 | 1 | $1,322 |
| #113 | 3 | 1 | $1,322 |
| #114 | 3 | 1 | $1,322 |
| #115 | 3 | 1 | $1,322 |
| #116 | 3 | 1 | $1,322 |
| #117 | 3 | 1 | $1,322 |
| #118 | 3 | 1 | $1,322 |
| #119 | 3 | 1 | $1,322 |
| #120 | 3 | 1 | $1,322 |
| #121 | 3 | 1 | $1,322 |
| #122 | 3 | 1 | $1,322 |
| #123 | 3 | 1 | $1,322 |
| #124 | 3 | 1 | $1,322 |
| #125 | 3 | 1 | $1,322 |
| #126 | 3 | 1 | $1,322 |
| #127 | 3 | 1 | $1,322 |
| #128 | 3 | 1 | $1,322 |
| #129 | 3 | 1 | $1,322 |
| #130 | 3 | 1 | $1,322 |
| #131 | 3 | 1 | $1,322 |
| #132 | 3 | 1 | $1,322 |
| #133 | 3 | 1 | $1,322 |
| #134 | 3 | 1 | $1,322 |
| #135 | 3 | 1 | $1,322 |
| #136 | 3 | 1 | $1,322 |
| #137 | 3 | 1 | $1,322 |
| #138 | 3 | 1 | $1,322 |
| #139 | 3 | 1 | $1,322 |
| #140 | 3 | 1 | $1,322 |
| #141 | 3 | 1 | $1,322 |
| #142 | 3 | 1 | $1,322 |
| #143 | 3 | 1 | $1,322 |
| #144 | 3 | 1 | $1,322 |
| #145 | 3 | 1 | $1,322 |
| #146 | 3 | 1 | $1,322 |
| #147 | 3 | 1 | $1,322 |
| #148 | 3 | 1 | $1,322 |
| #149 | 3 | 1 | $1,322 |
| #150 | 3 | 1 | $1,322 |
| Total (150 units) | $191,808 | ||
UW: 25.0% down · 7.5% · 30yr · 1.5% tax · 5.0% vac · 8.0% maint · 8.0% mgmt
Financing live
Cash to close
- Down payment
- $1,975,000
- Closing costs
- $237,000
- Reserves months
- —
- Total cash needed
- —
Loan-product check · same deal, 3 products live
Conventional
25% down · 7.5% · 30yr
- Down + closing
- —
- Monthly P&I
- —
- Monthly cashflow
- —
- DSCR
- —
- Eligible?
- —
Personal DTI + credit; lowest rate.
DSCR
20% down · 8.5% · 30yr
- Down + closing
- —
- Monthly P&I
- —
- Monthly cashflow
- —
- DSCR
- —
- Eligible?
- —
No personal income docs; deal must DSCR.
Hard money
10% down · 12.0% · 12mo
- Down + closing
- —
- Monthly P&I
- —
- Monthly cashflow
- —
- DSCR
- —
- Eligible?
- —
Short-term bridge; refi at stabilization.
Listing history 16 events
-
2026-06-18days on market $7,900,000 Active 199 DOM
-
2026-06-17days on market $7,900,000 Active 198 DOM
-
2026-06-16days on market $7,900,000 Active 197 DOM
-
2026-06-15days on market $7,900,000 Active 196 DOM
-
2026-06-13days on market $7,900,000 Active 194 DOM
-
2026-06-13days on market $7,900,000 Active 193 DOM
-
2026-06-09days on market $7,900,000 Active 190 DOM
-
2026-06-08days on market $7,900,000 Active 189 DOM
-
2026-06-07days on market $7,900,000 Active 188 DOM
-
2026-06-05days on market $7,900,000 Active 185 DOM
-
2026-06-03days on market $7,900,000 Active 184 DOM
-
2026-06-02days on market $7,900,000 Active 183 DOM
-
2026-06-01days on market $7,900,000 Active 182 DOM
-
2026-05-31days on market $7,900,000 Active 181 DOM
-
2026-03-12price $7,900,000 679-char remark
Show marketing remark (679 chars)
Woodknoll Townhomes is a 150-unit apartment community located in St. Louis, Missouri. Built in 1971, the Property offers an investor the rare opportunity to acquire a stabilized asset with proven operating performance and tremendous upside potential. Most of the units are in classic or near classic condition, allowing new ownership the opportunity to push rents through further continued unit upgrades or increasing in-place rents to market rate. The Property features a mix of 2-bedroom and 3-bedroom units. Unit amenities include full basements with finished entertainment space and utility area with washer/dryer hookups, linen closets, updated flooring, and newer windows.
-
2025-12-01$9,000,000 Active 679-char remark
Show marketing remark (679 chars)
Woodknoll Townhomes is a 150-unit apartment community located in St. Louis, Missouri. Built in 1971, the Property offers an investor the rare opportunity to acquire a stabilized asset with proven operating performance and tremendous upside potential. Most of the units are in classic or near classic condition, allowing new ownership the opportunity to push rents through further continued unit upgrades or increasing in-place rents to market rate. The Property features a mix of 2-bedroom and 3-bedroom units. Unit amenities include full basements with finished entertainment space and utility area with washer/dryer hookups, linen closets, updated flooring, and newer windows.
ⓘ Source: listings_history table (triggers on properties + properties_extension) + one-shot
backfill from property_details.listing_events for pre-trigger history.
Climate risk First Street
- Flood 1/10 Low FEMA zone X (unshaded) · 0% chance over 30 yrs
- Wildfire 1/10 Low
- Heat 5/10 Major 7 d/yr ≥107°F today · 21 d/yr by 30 yrs out
- Wind 2/10 Low 100% chance of damaging wind over 30 yrs
- Air quality 4/10 Moderate 4 unhealthy d/yr today · 5 by 30 yrs out
Nearby sold comps map
Loading sold comps map…
Walkable amenities ~0.75 mi
Loading nearby amenities…
Taxation est. · year 1
- Rental income
- $2,301,696
- − Mortgage interest
- −$442,523
- − Property taxes
- −$118,500
- − Insurance
- −$39,500
- − Repairs & maintenance
- −$184,136
- − Management
- −$184,136
- − Depreciation
- −$229,818
- Taxable income
- $1,103,084
- Est. tax owed @ 24.0%
- −$264,740
- After-tax cash flow
- $898,458/yr
For passive investors: Depreciation is non-cash, so a rental often shows a tax loss while cash-flowing — sheltering income. Rental losses are passive: they offset passive income freely, and up to $25,000/yr can offset ordinary (W-2) income if you actively participate and your MAGI is under $100k (phasing out to $0 by $150k); unused losses carry forward. On sale, claimed depreciation is recaptured at up to 25%, and gains may owe capital-gains tax (a 1031 exchange can defer both). Figures are a year-1 estimate at your 24.0% rate — not tax advice; consult a CPA.
Condition & rehab AI · 12 photos
This multi-family property presents as needing moderate repairs and maintenance, with potential for significant value increase through exterior paint, flooring replacement, and interior paint.
Repairs flagged
- Minor Exterior paint — Paint appears faded in some areas
- Moderate Roof inspection — Roof may need inspection for any potential issues
- Moderate Flooring replacement — Flooring appears worn in some areas
- Moderate Interior paint — Paint appears faded in some areas
- Minor Window cleaning — Windows appear functional but may need cleaning
- Moderate HVAC inspection — No visible issues, but may need inspection
Value-add opportunities
- Both Exterior paint — Fresh paint can improve curb appeal and property value
- Both Flooring replacement — New flooring can improve the living space and increase rental value
- Both Interior paint — Fresh paint can improve the interior and increase resale value
- Rental Window cleaning — Clean windows can improve the property's rental appeal
- Both HVAC inspection and maintenance — A clean and functioning HVAC system can improve comfort and energy efficiency
Renovation cost estimate screening
| Repair item | Severity | Est. cost |
|---|---|---|
| Exterior paint · Paint appears faded in some areas | Minor | $500–3,000 |
| Roof inspection · Roof may need inspection for any potential issues | Moderate | $3,000–15,000 |
| Flooring replacement · Flooring appears worn in some areas | Moderate | $3,000–15,000 |
| Interior paint · Paint appears faded in some areas | Moderate | $3,000–15,000 |
| Window cleaning · Windows appear functional but may need cleaning | Minor | $500–3,000 |
| HVAC inspection · No visible issues, but may need inspection | Moderate | $3,000–15,000 |
| Total estimated repair cost · 6 items | $13,000–66,000 |
Value-add ROI direction
- Both Exterior paint — Fresh paint can improve curb appeal and property value ↑
- Both Flooring replacement — New flooring can improve the living space and increase rental value ↑
- Both Interior paint — Fresh paint can improve the interior and increase resale value ↑
- Rental Window cleaning — Clean windows can improve the property's rental appeal ↑
- Both HVAC inspection and maintenance — A clean and functioning HVAC system can improve comfort and energy efficiency ↑
ⓘ Cost ranges are severity-bucket heuristics (US national rule-of-thumb). Get contractor quotes + a written scope before underwriting a rehab budget.
Schools (NCES district)
- District
- Riverview Gardens
- NCES district ID
- 2926670
- Math proficiency
- 2% ▼ -6.00%
- Reading proficiency
- 9% ▼ -6.00%
- Median HH income
- $32,759
- Composite
- 4.22/100
- National rank
- #10058
- State rank
- #324 of 324 in MO
Livability — Jennings
- Score
- 67/100
- State rank
- #208
- US rank
- #10499
Category grades
Schools grade is shown separately in the Schools card above.
Census & demographics
- County
- Saint Louis County · 888,823 people
- Metro
- St. Louis, MO-IL
- Population (ZIP)
- 40,929
- Household income
- $41,154
- Rent vs Own
- Severe rent burden
- 3085.0
Population outlook (St. Louis County) Hauer SSP2
- Today (2025)
- 1,025,227 people
- By 2030
- 1,028,023 · +0.3%
- By 2040
- 1,020,940 · -0.4%
- By 2050
- 1,007,280 · -1.8%
- By 2075
- 987,277 · -3.7%
- By 2100
- 921,984 · -10.1%
Race, ethnicity, and origin ACS 2023
- Neighborhood character
- Predominantly Black (90%)
- Race & ethnicity
- Black 90% White 5% Two or more races 3%
- Foreign-born
- 1% · Canada
Political lean MEDSL · St. Louis
- 2024 margin
- Strong D (+23.4) · D 60.8% · R 37.4% · Other 1.7%
- 2008→2024 swing
- +3.5pp toward D · 2008: 19.9pp · 2024: 23.4pp
- All cycles
- 2024: D+23.4 2020: D+24.0 2016: D+16.2 2012: D+13.7 2008: D+19.9
Not yet ingested
- Civics
- —
Market trends
- HPI YoY
- ▲ 3.79%
- Current HPI
- 420.28
- Rent YoY
- ▲ 4.97%
- Metro
- St. Louis, MO-IL
- State GDP YoY
- ▲ 1.84%
- F500 in state
- 20
Industry mix (Fortune 500 HQ in MO)
| Industry | F500 HQs | Revenue |
|---|---|---|
| Healthcare | 1 | $163B |
|
||
| Insurance | 1 | $21B |
|
||
| Industrial Technology | 1 | $17B |
|
||
| Retail | 1 | $16B |
|
||
| Industrial Distribution | 1 | $10B |
|
||
| Utilities | 1 | $9B |
|
||
Price history
-12.2% since first listed2 events — show timeline
- 2026-03-12 Price Changed $7,900,000 MARIS as Distributed by MLS Grid
- 2025-12-01 Listed $9,000,000 MARIS as Distributed by MLS Grid
Cash-flow waterfall
monthlySold comps — $/sqft
last 12 mo · ≤1 miLoading sold comps…