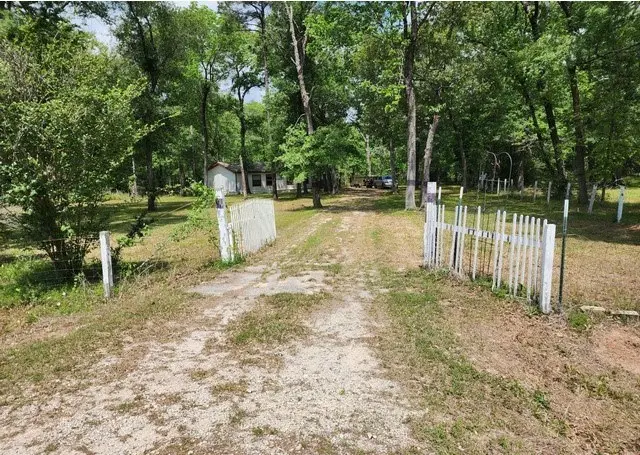
3 Brandon Rd · Huntsville, TX
Flood risk 1/10 · Minimal
- FEMA flood zone
- X (unshaded)
- Chance of flooding over 30 yrs
- 0.0%
- Est. flood insurance / yr
- $507 – $1,088
Fire risk 5/10 · Moderate
- Est. fire insurance / yr
- $1,222 – $2,270
Heat risk 8/10 · Major
- Hot days now (above 110°F)
- 7 days/yr
- Hot days in 30 yrs
- 25 days/yr
Wind risk 8/10 · Major
- Chance of severe wind over 30 yrs
- 98.0%
Air-quality risk 2/10 · Minimal
- Unhealthy air days now
- 0 days/yr
- Unhealthy air days in 30 yrs
- 1 days/yr
Risk factors via First Street. Map © Google.
Why this score? — see what drove the F grade
The composite is a weighted blend of 9 inputs, each scored 0–100. Each bar is that input's sub-score; the figure is the points it added to the 100-point composite (weight × sub-score).
- Cash flow +8.3/30.0
- ARV discount +7.5/15.0
- 1% rule +3.9/10.0
- Rent growth +3.2/5.0
- Livability +3.2/5.0
- Schools +2.6/10.0
- Condition / age +2.5/5.0
- DSCR +2.3/10.0
- Appreciation +0.0/10.0
$174,900
🖨 Deal sheet 📄 Offer letter ✓ Due diligence
Listing remarks
Spacious 11+ acre property offering endless possibilities in a peaceful country setting. The existing 3-bedroom, 2-bath manufactured home features a living room, dining area, breakfast space, and in-home utility room, providing a functional layout for everyday living. The home will need some TLC and cosmetic updates, making it a great opportunity for someone looking to add their personal touch or renovate over time. The true value is in the land—ideal for building your dream home, bringing in a new manufactured home, or creating your own private retreat. Enjoy wide open space, privacy, and that sought-after country feel while still being within reach of nearby amenities. A great oppor
Key facts
- Privacy
- 11 acre property
- Wide open space
Tags
Property features AI
Finance
- Financial info: Lease not considered
Exterior
- Parking: No designated parking
- Utilities: Water, sewer, and power details not specified
- Home design: Residential property; Single-story (all main rooms listed as First floor); Full ownership
- Construction: Built in 1995; Block foundation; Composition roof; Construction materials: Unknown
- Exterior features: Fenced yard (partial fence); Private yard; Shed(s) for storage; Storage area; Lot is cleared, wooded and on a cul-de-sac; Asphalt road access
Interior
- Kitchen: Kitchen with island — 14x12; Breakfast nook — 12x12; Dining room — 13x12
- Bedrooms: Primary bedroom (First floor) — 16x12; Bedroom (First floor) — 12x11; Bedroom (First floor) — 12x10; Space for 3 possible bedrooms
- Flooring: Laminate flooring; Vinyl flooring
- Bathrooms: 2 full bathrooms
- Interior features: Wood-burning fireplace (1); Double vanity; Kitchen island; Soaking tub; Ceiling fans; Combined living/dining area; 8 total rooms
- Laundry & utility: Washer hookup; Electric dryer hookup; Utility room (First floor) — 12x6
Neighborhood map
What this means for you Summary
Snapshot
- This is a 3-bed/2.0-bath manufactured listed at $175k.
Deal economics
- At list price, monthly cash flow is $-158 ($-2k/yr) — negative.
- To cash-flow at today's rent, offer at most $147k (16.0% below list).
- To meet the 1% rule (rent ≥ 1% of price), the offer needs to be $156k (10.7% below list).
- Recommended offer: $147k (16.0% below list) — sets the bar for cash-flow.
- Cap rate 5.2% vs local median 2.6% in Huntsville — top-decile yield for the area; either an underpriced asset or a hidden risk that comps aren't pricing in. Stress-test before assuming the spread holds.
Location & tenants
- Location reads 63/100 on livability (#825 in TX) — a middle-class / working-renter tenant base. Strengths: cost of living A+; Watch: amenities C-, crime D-, commute F.
- Huntsville ISD (town): math 25% / reading 37% proficiency, ranked #621 of 826 in TX (top 75%) — families likely to look elsewhere, expect single-tenant / working-renter base with shorter leases.
- Zoned schools: Scott Johnson El (math 27% / reading 27%, grade F, #2,791 of 4,322 statewide, top 68%, 591 students, 80% FRL); Mance Park Middle (math 26% / reading 25%, grade F, #1,236 of 1,662 statewide, top 76%, 904 students, 74% FRL); Huntsville H S (math 13% / reading 25%, grade F, #1,431 of 1,632 statewide, top 88%, 1,797 students, 68% FRL) — zoned schools average 74% FRL vs 42% district-wide (32 pts higher); higher-poverty schools than district average — tighter screening recommended.
- Market conditions: Rents rising (+2.9%/yr); 518 active listings in the ZIP; 527 units permitted in Walker County in 2024 (0 in 5+ unit buildings).
- This rent runs 34% of the median local income ($56k/yr) — at the standard rent-burdened threshold; future hikes will face affordability resistance.
Forward outlook
- Local home prices are declining (-3.0%/yr); year-one equity from $1k of loan paydown is wiped out by about $5k of value loss. Plan a longer hold.
- Walker County population projected at +29% by 2050 — long-run rental-demand tailwind backs the buy-and-hold thesis.
Negotiation context
- It's been on market 17 days — a 2% lower offer ($172k) is reasonable based on typical stale-listing flexibility.
Risks & watch-outs
- Watch-outs: property tax is 2.8% of price.
- Climate carrying-cost: severe wind risk, 98% chance of damaging wind over 30y; moderate wildfire risk; extreme-heat days projected 7→25/yr by 2055 (HVAC capex compounding) — expect insurance premiums to compound above CPI over the hold.
Questions for the listing agent
- What do current leases actually rent for vs. the listed asking? Can we see a recent rent roll and the last 12 months of T-12 income?
- Property tax is high relative to price — has the assessment been appealed recently, and will the sale trigger a re-assessment?
- Is there a deadline driving the sale (1031 exchange, divorce, estate, relocation)? That informs how much negotiation room exists.
- Schools are D-rated, which usually means shorter tenancies and higher turnover. Who's the typical renter profile here, and what's been the actual vacancy rate?
- Crime grade is D in this area — have there been break-ins, vandalism, or insurance claims at this property in the last 3 years? What carrier currently insures it and at what premium?
- The area grade is low — what's the realistic commute time and amenity access for the typical tenant pool here? Any planned neighborhood developments (good or bad) we should know about?
- What's the average days-on-market for RENTAL listings here right now (not sales)? A rising rental-DOM trend means longer vacancies and softer asking-rent achievability than the comps imply.
- What's the recent tenant-quality profile in this submarket — average credit score on applications, eviction rate, late-payment / NSF rate, and stable-employment percentage? A property-management company in the area should have these aggregated.
- How much new for-sale + rental construction is in the pipeline within 1–3 miles? Heavy new supply typically softens prices + rents 12–24 months out; constrained supply supports both.
Investment metrics
- 1% rule
- 0.89% ✗
- Cap rate
- 5.21%
- Cash-on-cash
- -3.88%
- DSCR
- 0.83
- GRM
- 9.3
CMA / ARV
No comps found within radius.
Projected returns pro-forma
-3.0% appreciation · 2.89% rent growth · sell at horizon
- IRR
- -22.9%
- Equity multiple
- 0.21×
- Total profit
- $-38,468
- Equity at exit
- $26,078
- IRR
- -17.4%
- Equity multiple
- 0.05×
- Total profit
- $-46,643
- Equity at exit
- $15,122
Cash invested: $48,972 (down + closing). Projections, not guarantees.
Landlord ↔ Tenant lean methodology
- Overall (STATE)
- 87 Strongly Landlord-Friendly
- State Texas
- 87 Strongly Landlord-Friendly · R+5
- County
- — inherits STATE
- City
- — inherits STATE
ZIP-level market 77320
- Home prices YoY
- -33.0%
- Rents YoY
- 2.9%
- Active inventory
- 518
- Price-to-rent
- 9.3×
Monthly cashflow live
- Estimated rent
- $1,562 medium interval (Pro) →
- Mortgage (P&I)
- −$917
- Tax from tax record
- −$402 /mo · $4,825/yr
- Insurance
- −$73
- HOA
- −$0
- Vacancy / Maint / Mgmt
- −$328
- Net cashflow
- $-158
Break-even live
UW: 25.0% down · 7.5% · 30yr · 1.5% tax · 5.0% vac · 8.0% maint · 8.0% mgmt
Financing live
Cash to close
- Down payment
- $43,725
- Closing costs
- $5,247
- Reserves months
- —
- Total cash needed
- —
Loan-product check · same deal, 3 products live
Conventional
25% down · 7.5% · 30yr
- Down + closing
- —
- Monthly P&I
- —
- Monthly cashflow
- —
- DSCR
- —
- Eligible?
- —
Personal DTI + credit; lowest rate.
DSCR
20% down · 8.5% · 30yr
- Down + closing
- —
- Monthly P&I
- —
- Monthly cashflow
- —
- DSCR
- —
- Eligible?
- —
No personal income docs; deal must DSCR.
Hard money
10% down · 12.0% · 12mo
- Down + closing
- —
- Monthly P&I
- —
- Monthly cashflow
- —
- DSCR
- —
- Eligible?
- —
Short-term bridge; refi at stabilization.
Listing history 3 events
-
2026-05-11status Pending 748-char remark
-
2026-04-23$174,900 Active 748-char remark
-
2016-12-01soldstatus
ⓘ Source: listings_history table (triggers on properties + properties_extension) + one-shot
backfill from property_details.listing_events for pre-trigger history.
Tax reassessment forecast TX · Resets to sale price
- Current annual tax
- $4,825 · $402/mo
- Projected year-2 tax
- $4,825 · $402/mo
- Expected delta
- $0/yr ($0/mo · 0.0%)
ⓘ Screening estimate from a state-policy table — verify with the county assessor before closing.
Climate risk First Street
- Flood 1/10 Low FEMA zone X (unshaded) · 0% chance over 30 yrs
- Wildfire 5/10 Major
- Heat 8/10 Severe 7 d/yr ≥110°F today · 25 d/yr by 30 yrs out
- Wind 8/10 Severe 98% chance of damaging wind over 30 yrs
- Air quality 2/10 Low 0 unhealthy d/yr today · 1 by 30 yrs out
Nearby sold comps map
Loading sold comps map…
Walkable amenities ~0.75 mi
Loading nearby amenities…
Taxation est. · year 1
- Rental income
- $18,740
- − Mortgage interest
- −$9,797
- − Property taxes
- −$4,825
- − Insurance
- −$874
- − Repairs & maintenance
- −$1,499
- − Management
- −$1,499
- − Depreciation
- −$5,088
- Taxable loss
- −$4,843
- Est. tax savings @ 24.0%
- +$1,162
- After-tax cash flow
- $-739/yr
For passive investors: Depreciation is non-cash, so a rental often shows a tax loss while cash-flowing — sheltering income. Rental losses are passive: they offset passive income freely, and up to $25,000/yr can offset ordinary (W-2) income if you actively participate and your MAGI is under $100k (phasing out to $0 by $150k); unused losses carry forward. On sale, claimed depreciation is recaptured at up to 25%, and gains may owe capital-gains tax (a 1031 exchange can defer both). Figures are a year-1 estimate at your 24.0% rate — not tax advice; consult a CPA.
Schools (NCES district)
- District
- Huntsville ISD
- NCES district ID
- 4824030
- Math proficiency
- 25% ▼ -6.00%
- Reading proficiency
- 37% ▼ -2.00%
- Median HH income
- $36,597
- Composite
- 25.71/100
- National rank
- #7383
- State rank
- #621 of 826 in TX
Livability — Huntsville
- Score
- 63/100
- State rank
- #825
- US rank
- #14909
Category grades
Schools grade is shown separately in the Schools card above.
Census & demographics
- County
- Walker County · 75,669 people
- City population
- 634
- Metro
- Huntsville, TX
- Population (ZIP)
- 38,152
- Household income
- $55,663
- Rent vs Own
- Severe rent burden
- 1030.0
Population outlook (Walker County) Hauer SSP2
- Today (2025)
- 77,602 people
- By 2030
- 82,007 · +5.7%
- By 2040
- 90,436 · +16.5%
- By 2050
- 100,240 · +29.2%
- By 2075
- 123,667 · +59.4%
- By 2100
- 135,073 · +74.1%
Race, ethnicity, and origin ACS 2023
- Neighborhood character
- Diverse neighborhood (Simpson 0.64)
- Race & ethnicity
- White 50% Hispanic / Latino 26% Black 21% Two or more races 15%
- Hispanic origin (detail)
- Mexican 20%
- Common ancestry
- Lithuanian 2% Italian 2% Slovak 2%
- Foreign-born
- 9% · Canada, Vietnam
- Languages at home
- 79% English-only · Spanish 19%
Political lean MEDSL · Walker
- 2024 margin
- Solid R (+40.0) · D 29.6% · R 69.6%
- 2008→2024 swing
- -17.6pp toward R · 2008: -22.4pp · 2024: -40.0pp
- All cycles
- 2024: R+40.0 2020: R+31.7 2016: R+34.5 2012: R+28.4 2008: R+22.4
Not yet ingested
- Civics
- —
Market trends
- HPI YoY
- ▼ -93.48%
- Current HPI
- 190.199
- Rent YoY
- ▲ 2.89%
- Metro
- Huntsville, TX
- State GDP YoY
- ▲ 3.95%
- F500 in state
- 110
Industry mix (Fortune 500 HQ in TX)
| Industry | F500 HQs | Revenue |
|---|---|---|
| Energy | 16 | $1,198B |
|
||
| Technology | 5 | $198B |
|
||
| Engineering / Construction | 4 | $72B |
|
||
| Energy Services | 3 | $60B |
|
||
| Utilities | 3 | $41B |
|
||
| Healthcare | 2 | $330B |
|
||
Price history
4 events — show timeline
- 2026-05-29 Sold (MLS) — HARMLS
- 2026-05-11 Pending — HARMLS
- 2026-04-23 Listed $174,900 HARMLS
- 2016-12-01 Sold (Public Records) — Public Records
Property tax history
+17.6%/yrLatest (2025): $4,825 · +22.1% YoY. Source: county tax records.
Cash-flow waterfall
monthlySold comps — $/sqft
last 12 mo · ≤1 miLoading sold comps…