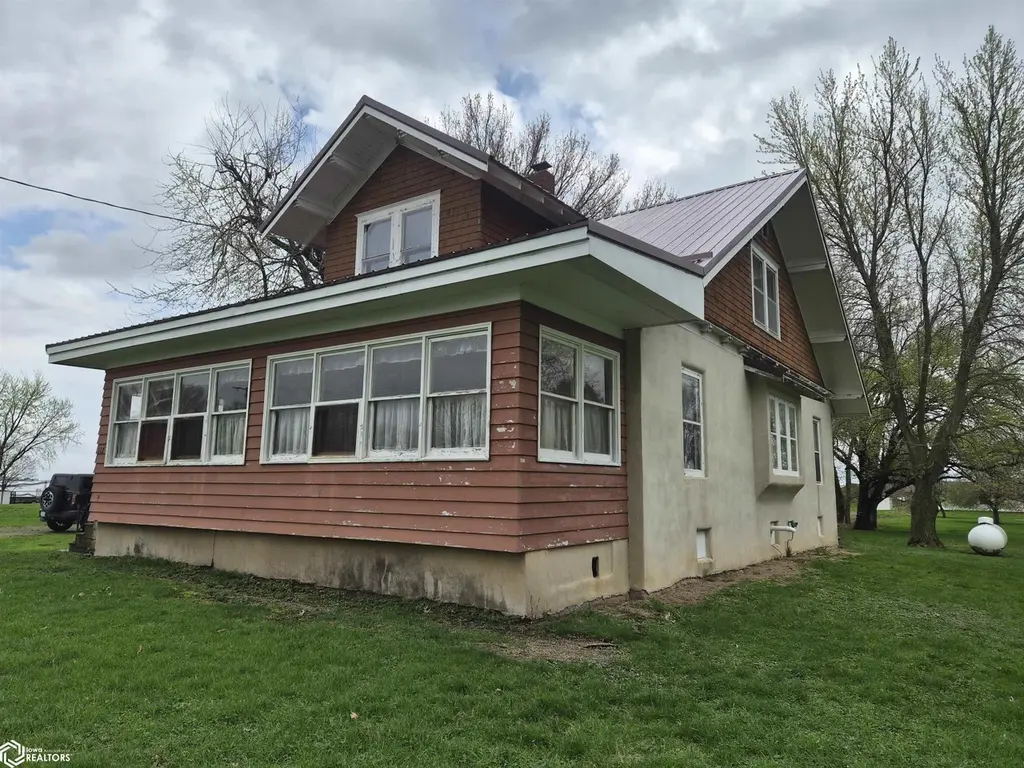
112 E Strait St · Gilman, IA
Flood risk 1/10 · Minimal
- FEMA flood zone
- X (unshaded)
- Chance of flooding over 30 yrs
- 0.0%
- Est. flood insurance / yr
- $473 – $860
Fire risk 1/10 · Minimal
- Est. fire insurance / yr
- $902 – $1,676
Heat risk 3/10 · Minor
- Hot days now (above 102°F)
- 7 days/yr
- Hot days in 30 yrs
- 15 days/yr
Wind risk 2/10 · Minimal
- Chance of severe wind over 30 yrs
- —
Air-quality risk 2/10 · Minimal
- Unhealthy air days now
- 0 days/yr
- Unhealthy air days in 30 yrs
- 1 days/yr
Risk factors via First Street. Map © Google.
Why this score? — see what drove the C+ grade
The composite is a weighted blend of 9 inputs, each scored 0–100. Each bar is that input's sub-score; the figure is the points it added to the 100-point composite (weight × sub-score).
- Cash flow +17.4/30.0
- ARV discount +15.0/15.0
- Appreciation +7.4/10.0
- Schools +5.8/10.0
- DSCR +5.4/10.0
- 1% rule +4.0/10.0
- Livability +3.4/5.0
- Rent growth +2.5/5.0
- Condition / age +2.5/5.0
$135,000
🖨 Deal sheet 📄 Offer letter ✓ Due diligence
Listing remarks MLS
Great Starter home to make it your own. 2 Story home with so much potential. 4 bedrooms 2 Plus baths. Enter the home through the enclosed porch. Hardwood floors through out. Very spacious living room with open staircase to the second floor. Nice sized formal dining room. Kitchen has so much potential. Laundry room and toilet just off the bedroom and access to the garage. Main floor bedroom with full bath. Second floor features 3 very nice sized bedrooms and a Huge bathroom with plenty of storage. Basement has a family room and possible office. Plenty of storage. Home has a newer metal roof, furnace, electrical panel and water manifold system. 2 window unit Ac stays with the home.
Key facts
- Open staircase
- Formal dining room
- Laundry room
Tags
Neighborhood map
What this means for you Summary
Snapshot
- This is a 3-bed/2.0-bath single-family listed at $135k.
Deal economics
- At list price, monthly cash flow is $101 ($1k/yr) — positive.
- The deal already cash-flows at list — no discount required.
- To meet the 1% rule (rent ≥ 1% of price), the offer needs to be $121k (10.1% below list).
- Recommended offer: $121k (10.1% below list) — sets the bar for 1% rule.
Location & tenants
- Location reads 68/100 on livability (#447 in IA) — a middle-class / working-renter tenant base. Strengths: cost of living A+, housing A, employment A-; Watch: amenities F, commute F, health & safety D-.
- East Marshall Community School District (rural): math 63% / reading 73% proficiency, ranked #165 of 289 in IA (top 57%) — acceptable for families but not a draw, mixed tenant base, ~2y average lease.
- Market conditions: 5 active listings in the ZIP; 35 units permitted in Marshall County in 2024 (0 in 5+ unit buildings).
Forward outlook
- In year one you build about $7k of equity ($933 loan paydown + $7k appreciation (4.8% local appreciation)).
- Marshall County population projected at +8% by 2050 — modest demand growth; plan on rents tracking national, not racing it.
- At projected returns (4.8% appreciation + 3.0% rent growth), your $38k cash investment doubles in ~4 years — after that, you're playing with house money.
- By year 5, paydown + projected appreciation supports a ~$32k cash-out refi (75% LTV) — recoverable capital for the next deal without selling this one.
Negotiation context
- It's been on market 64 days — a 6% lower offer ($127k) is reasonable based on typical stale-listing flexibility.
- Current owner paid $56k; list at $135k implies a 141% gain — meaningful room to come down on a strong offer.
Risks & watch-outs
- Watch-outs: built in 1916 — expect roof / HVAC / electrical / plumbing capex.
Questions for the listing agent
- It's been on market 64 days. Have you received any prior offers? Is the seller open to a 10% concession, seller financing, or rate buy-down credit?
- Built in 1916 — when were the roof, HVAC, electrical panel, plumbing, and water heater last replaced?
- Why hasn't it sold? Are there any deal-killer items the seller is aware of (foundation, flood, title, zoning, code violations)?
- Is there a deadline driving the sale (1031 exchange, divorce, estate, relocation)? That informs how much negotiation room exists.
- Schools are B-rated — typically a magnet for longer-tenancy family renters. What's the average tenant stay here, and is there a school-zone premium baked into asking?
- What's the average days-on-market for RENTAL listings here right now (not sales)? A rising rental-DOM trend means longer vacancies and softer asking-rent achievability than the comps imply.
- What's the recent tenant-quality profile in this submarket — average credit score on applications, eviction rate, late-payment / NSF rate, and stable-employment percentage? A property-management company in the area should have these aggregated.
- How much new for-sale + rental construction is in the pipeline within 1–3 miles? Heavy new supply typically softens prices + rents 12–24 months out; constrained supply supports both.
Investment metrics
- 1% rule
- 0.90% ✗
- Cap rate
- 7.19%
- Cash-on-cash
- 3.22%
- DSCR
- 1.14
- GRM
- 9.3
CMA / ARV
- ARV (median comp)
- $166,284
- List price
- $135,000
- Delta
- -18.81%
- Verdict
- UNDERPRICED
- Comps
- 10 within 1.0 mi
Show comp detail 1 sale within ~0.75 mi
| Address | Dist | Beds/Ba | Sqft | Sold | Price | $/sf | Match |
|---|---|---|---|---|---|---|---|
| 104 W Church St | 0.27mi | 3/2.0 | 2,000 (+4%) | 19mo | $195,000 | $98 | 65 |
Match score weights: distance 35% · size 25% · config 20% · recency 20%. Top-matched comps best support the ARV.
Projected returns pro-forma
4.84% appreciation · 3.0% rent growth · sell at horizon
- IRR
- 15.2%
- Equity multiple
- 1.96×
- Total profit
- $36,335
- Equity at exit
- $75,215
- IRR
- 15.8%
- Equity multiple
- 3.77×
- Total profit
- $104,811
- Equity at exit
- $128,759
Cash invested: $37,800 (down + closing). Projections, not guarantees.
Landlord ↔ Tenant lean methodology
- Overall (STATE)
- 83 Strongly Landlord-Friendly
- State Iowa
- 83 Strongly Landlord-Friendly · R+6
- County
- — inherits STATE
- City
- — inherits STATE
ZIP-level market 50106
- Home prices YoY
- 4.1%
- Active inventory
- 5
- Price-to-rent
- 9.3×
Monthly cashflow live
- Estimated rent
- $1,213 medium interval (Pro) →
- Mortgage (P&I)
- −$708
- Tax from tax record
- −$93 /mo · $1,114/yr
- Insurance
- −$56
- HOA
- −$0
- Vacancy / Maint / Mgmt
- −$255
- Net cashflow
- $101
Break-even live
UW: 25.0% down · 7.5% · 30yr · 1.5% tax · 5.0% vac · 8.0% maint · 8.0% mgmt
Financing live
Cash to close
- Down payment
- $33,750
- Closing costs
- $4,050
- Reserves months
- —
- Total cash needed
- —
Loan-product check · same deal, 3 products live
Conventional
25% down · 7.5% · 30yr
- Down + closing
- —
- Monthly P&I
- —
- Monthly cashflow
- —
- DSCR
- —
- Eligible?
- —
Personal DTI + credit; lowest rate.
DSCR
20% down · 8.5% · 30yr
- Down + closing
- —
- Monthly P&I
- —
- Monthly cashflow
- —
- DSCR
- —
- Eligible?
- —
No personal income docs; deal must DSCR.
Hard money
10% down · 12.0% · 12mo
- Down + closing
- —
- Monthly P&I
- —
- Monthly cashflow
- —
- DSCR
- —
- Eligible?
- —
Short-term bridge; refi at stabilization.
Listing history 18 events
-
2026-06-19days on market $135,000 Active 64 DOM
-
2026-06-18days on market $135,000 Active 63 DOM
-
2026-06-17days on market $135,000 Active 62 DOM
-
2026-06-16days on market $135,000 Active 61 DOM
-
2026-06-15days on market $135,000 Active 60 DOM
-
2026-06-14days on market $135,000 Active 58 DOM
-
2026-06-12days on market $135,000 Active 57 DOM
-
2026-06-09days on market $135,000 Active 54 DOM
-
2026-06-08days on market $135,000 Active 53 DOM
-
2026-06-07days on market $135,000 Active 52 DOM
-
2026-06-05days on market $135,000 Active 49 DOM
-
2026-06-03days on market $135,000 Active 48 DOM
-
2026-06-02days on market $135,000 Active 47 DOM
-
2026-06-01days on market $135,000 Active 46 DOM
-
2026-05-31days on market $135,000 Active 45 DOM
-
2026-05-30days on market $135,000 Active 44 DOM
-
2026-04-16$145,000 Active 688-char remark
Show marketing remark (688 chars)
Great Starter home to make it your own. 2 Story home with so much potential. 4 bedrooms 2 Plus baths. Enter the home through the enclosed porch. Hardwood floors through out. Very spacious living room with open staircase to the second floor. Nice sized formal dining room. Kitchen has so much potential. Laundry room and toilet just off the bedroom and access to the garage. Main floor bedroom with full bath. Second floor features 3 very nice sized bedrooms and a Huge bathroom with plenty of storage. Basement has a family room and possible office. Plenty of storage. Home has a newer metal roof, furnace, electrical panel and water manifold system. 2 window unit Ac stays with the home.
-
2014-07-14soldstatus $56,000
ⓘ Source: listings_history table (triggers on properties + properties_extension) + one-shot
backfill from property_details.listing_events for pre-trigger history.
Tax reassessment forecast IA · Partial reset (capped growth)
- Current annual tax
- $1,114 · $93/mo
- Projected year-2 tax
- $1,617 · $135/mo
- Expected delta
- +$503/yr (+$42/mo · 45.1%)
ⓘ Screening estimate from a state-policy table — verify with the county assessor before closing.
Climate risk First Street
- Flood 1/10 Low FEMA zone X (unshaded) · 0% chance over 30 yrs
- Wildfire 1/10 Low
- Heat 3/10 Moderate 7 d/yr ≥102°F today · 15 d/yr by 30 yrs out
- Wind 2/10 Low
- Air quality 2/10 Low 0 unhealthy d/yr today · 1 by 30 yrs out
Nearby sold comps map
Loading sold comps map…
Walkable amenities ~0.75 mi
Loading nearby amenities…
Taxation est. · year 1
- Rental income
- $14,558
- − Mortgage interest
- −$7,562
- − Property taxes
- −$1,114
- − Insurance
- −$675
- − Repairs & maintenance
- −$1,165
- − Management
- −$1,165
- − Depreciation
- −$3,927
- Taxable loss
- −$1,049
- Est. tax savings @ 24.0%
- +$252
- After-tax cash flow
- $1,469/yr
For passive investors: Depreciation is non-cash, so a rental often shows a tax loss while cash-flowing — sheltering income. Rental losses are passive: they offset passive income freely, and up to $25,000/yr can offset ordinary (W-2) income if you actively participate and your MAGI is under $100k (phasing out to $0 by $150k); unused losses carry forward. On sale, claimed depreciation is recaptured at up to 25%, and gains may owe capital-gains tax (a 1031 exchange can defer both). Figures are a year-1 estimate at your 24.0% rate — not tax advice; consult a CPA.
Schools (NCES district)
- District
- East Marshall Community School District
- NCES district ID
- 1900040
- Math proficiency
- 63% ▼ -9.00%
- Reading proficiency
- 73% ▬ 0.00%
- Median HH income
- $55,218
- Composite
- 58.17/100
- National rank
- #1025
- State rank
- #165 of 289 in IA
Livability — Gilman
- Score
- 68/100
- State rank
- #447
- US rank
- #9787
Category grades
Schools grade is shown separately in the Schools card above.
Census & demographics
- Census place
- Gilman, IA
- Population (ZIP)
- 1,121
Population outlook (Marshall County) Hauer SSP2
- Today (2025)
- 41,166 people
- By 2030
- 41,477 · +0.8%
- By 2040
- 42,548 · +3.4%
- By 2050
- 44,472 · +8.0%
- By 2075
- 52,719 · +28.1%
- By 2100
- 60,912 · +48.0%
Race, ethnicity, and origin ACS 2023
- Neighborhood character
- Predominantly White (96%)
- Race & ethnicity
- White 96% Two or more races 3% Hispanic / Latino 3%
- Common ancestry
- Portuguese 8% Italian 6% Slovak 1%
- Foreign-born
- 1% · Canada
- Languages at home
- 99% English-only · Spanish 1%
Political lean MEDSL · Marshall
- 2024 margin
- R (+15.6) · D 41.4% · R 57.0% · Other 1.6%
- 2008→2024 swing
- -24.9pp toward R · 2008: 9.3pp · 2024: -15.6pp
- All cycles
- 2024: R+15.6 2020: R+7.7 2016: R+8.5 2012: D+8.9 2008: D+9.3
Not yet ingested
- Civics
- —
Market trends
- HPI YoY
- ▲ 4.84%
- Current HPI
- 123.0459
- Rent YoY
- —
- Metro
- —
- State GDP YoY
- ▲ 2.48%
- F500 in state
- 4
Industry mix (Fortune 500 HQ in IA)
| Industry | F500 HQs | Revenue |
|---|---|---|
| Financial Services | 1 | $16B |
|
||
| Retail / Convenience | 1 | $15B |
|
||
Price history
+158.9% since first listed2 events — show timeline
- 2026-04-16 Listed $145,000 IAR
- 2014-07-14 Sold (Public Records) $56,000 Public Records
Property tax history
-0.6%/yrLatest (2025): $1,114 · -6.2% YoY. Source: county tax records.
Cash-flow waterfall
monthlySold comps — $/sqft
last 12 mo · ≤1 miLoading sold comps…