 Fourplex
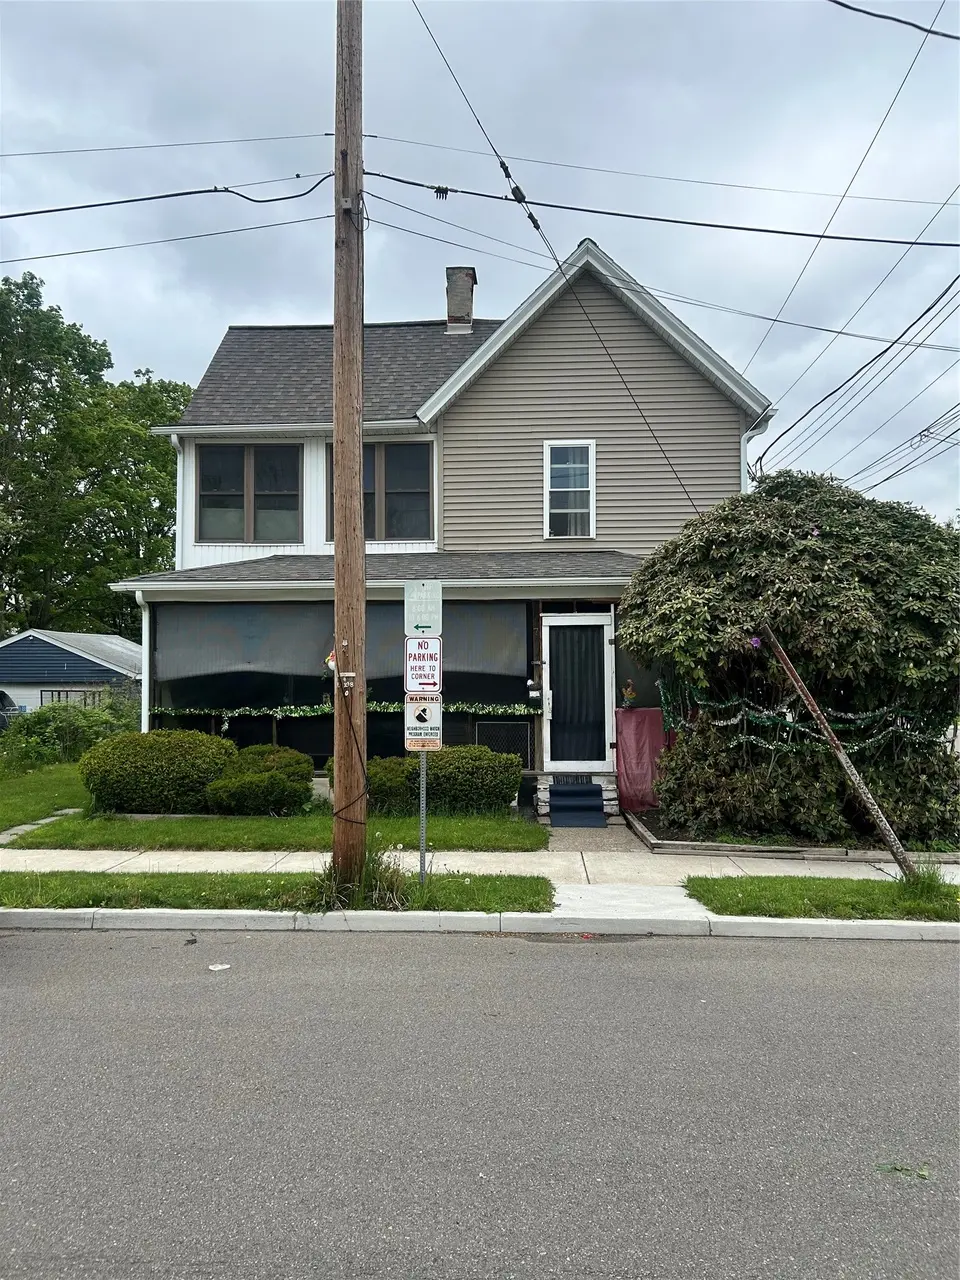
7 Silver St · Binghamton, NY
Flood risk 8/10 · Major
- FEMA flood zone
- X (shaded)
- Chance of flooding over 30 yrs
- 0.78%
- Est. flood insurance / yr
- $507 – $1,088
Fire risk 1/10 · Minimal
- Est. fire insurance / yr
- $691 – $1,283
Heat risk 3/10 · Minor
- Hot days now (above 92°F)
- 8 days/yr
- Hot days in 30 yrs
- 17 days/yr
Wind risk 2/10 · Minimal
- Chance of severe wind over 30 yrs
- 1.0%
Air-quality risk 2/10 · Minimal
- Unhealthy air days now
- 0 days/yr
- Unhealthy air days in 30 yrs
- 1 days/yr
Risk factors via First Street. Map © Google.
Why this score? — see what drove the B+ grade
The composite is a weighted blend of 9 inputs, each scored 0–100. Each bar is that input's sub-score; the figure is the points it added to the 100-point composite (weight × sub-score).
- Cash flow +30.0/30.0
- 1% rule +10.0/10.0
- DSCR +10.0/10.0
- Appreciation +10.0/10.0
- ARV discount +7.5/15.0
- Livability +3.9/5.0
- Schools +3.0/10.0
- Rent growth +2.5/5.0
- Condition / age +2.5/5.0
$225,000
🖨 Deal sheet (PDF) 📄 Offer letter ✓ Due diligence
Multi-family units
County records classify this as Multi-Family (5+ Unit). Listing-text estimate: 4 units. estimate disagrees with records
5+ unit building — per-unit beds/baths from public records are typically unavailable; the breakdown below (if shown) is an estimate from the listing text.
Listing remarks
Beautifully maintained four family home in Binghamton. The property features a spacious double lot, landscaping, well maintained vinyl siding, new windows, separate utilities, double stall detached garage, and a driveway big enough to fit mulitple vehicles. The home is fully occupied and features updates throughout! Two of the units have porches. This home represents a great opportunity for investors! Don't miss out!
Key facts
- Separate utilities
- Double lot
- Vinyl siding
Tags
Property features AI
Finance
- Other: Above-grade finished area reported (value provided in source but not listed here as square footage per instructions)
- Financial info: Current rents listed for units: $725, $500, $750, $725
- HOA & community: No HOA information provided
Exterior
- Parking: Detached garage with driveway (1 garage space)
- Security: No specific security features provided
- Utilities: Public water; Public sewer; Cable available
- Home design: Residential income property; Quadruplex
- Construction: Vinyl siding
- Exterior features: Deck; Enclosed porch; Porch; Screened porch; Level lot
Interior
- Kitchen: No specific kitchen appliance details provided
- Bedrooms: Four separate 1-bedroom units
- Flooring: Carpet; Hardwood; Tile
- Bathrooms: Four full bathrooms (one per unit)
- Heating & cooling: Baseboard heating; Wall/window air conditioning units
- Interior features: High-speed internet; Insulated windows; Electric and gas water heaters; Basement
- Laundry & utility: No specific laundry appliances or locations provided
Neighborhood map
What this means for you Summary
Snapshot
- This is a 4 × 4-bed/4.0-bath units multifamily listed at $225k.
Deal economics
- At list price, monthly cash flow is $2k ($24k/yr) — positive. Per door: $498/mo.
- The deal already cash-flows at list — no discount required.
- Meets the 1% rule at list price ($5k rent vs $225k).
- Cap rate 17.3% vs local median 6.4% in Binghamton — top-decile yield for the area; either an underpriced asset or a hidden risk that comps aren't pricing in. Stress-test before assuming the spread holds.
Location & tenants
- Location reads 78/100 on livability (#174 in NY, #2,710 nationally) — a middle-class / working-renter tenant base. Strengths: amenities A+, commute A+, cost of living A+; Watch: crime F, employment F.
- Binghamton City School District (urban): math 30% / reading 44% proficiency, ranked #557 of 590 in NY (top 94%) — families likely to look elsewhere, expect single-tenant / working-renter base with shorter leases; 61% free/reduced lunch — lower-income household profile, screen leases tightly.
- Zoned schools: Calvin Coolidge School (math 27% / reading 37%, grade F, #1,646 of 2,108 statewide, top 80%, 312 students, 72% FRL).
- Market conditions: 41 active listings in the ZIP; 340 units permitted in Broome County in 2024 (269 in 5+ unit buildings).
Forward outlook
- In year one you build about $24k of equity ($2k loan paydown + $22k appreciation (10.0% local appreciation)).
- Broome County population projected at -13% by 2050 — secular population decline; favor cash flow + early exit over multi-decade hold.
- At projected returns (10.0% appreciation + 3.0% rent growth), your $63k cash investment doubles in ~2 years — after that, you're playing with house money.
- By year 2, paydown + projected appreciation supports a ~$39k cash-out refi (75% LTV) — recoverable capital for the next deal without selling this one.
Negotiation context
- Only 13 days on market — expect competitive offers; lowballing is unlikely to land.
- 3 sale attempts with the ask held roughly flat each time — persistent listings suggest the price (not the market) is what's stuck; bring a comps-based counter.
Risks & watch-outs
- Watch-outs: flood insurance adds $66/mo; built in 1900 — expect roof / HVAC / electrical / plumbing capex.
- Climate carrying-cost: severe flood risk — expect insurance premiums to compound above CPI over the hold.
Questions for the listing agent
- Can we see the unit-by-unit rent roll, current vacancy, and any below-market leases? What's the average tenancy length?
- What capital expenditures (roof, boiler, parking lot, exteriors) have been made in the last 5 years, and what's planned in the next 2?
- Built in 1900 — when were the roof, HVAC, electrical panel, plumbing, and water heater last replaced?
- What's the actual annual flood-insurance premium (NFIP or private), and is the property in a SFHA with mandatory coverage?
- Is there a deadline driving the sale (1031 exchange, divorce, estate, relocation)? That informs how much negotiation room exists.
- Schools are D-rated, which usually means shorter tenancies and higher turnover. Who's the typical renter profile here, and what's been the actual vacancy rate?
- Crime grade is F in this area — have there been break-ins, vandalism, or insurance claims at this property in the last 3 years? What carrier currently insures it and at what premium?
- What's the average days-on-market for RENTAL listings here right now (not sales)? A rising rental-DOM trend means longer vacancies and softer asking-rent achievability than the comps imply.
- What's the recent tenant-quality profile in this submarket — average credit score on applications, eviction rate, late-payment / NSF rate, and stable-employment percentage? A property-management company in the area should have these aggregated.
- How much new apartment / multifamily construction is in the pipeline within 1–3 miles? Heavy new supply (>2% of stock underway) typically softens rents 12–24 months out; light construction supports rent growth.
Investment metrics
- 1% rule
- 2.03% ✓
- Cap rate
- 17.27%
- Cash-on-cash
- 39.19%
- DSCR
- 2.74
- GRM
- 4.1
CMA / ARV
No comps found within radius.
Projected returns pro-forma
10.0% appreciation · 3.0% rent growth · sell at horizon
- IRR
- 53.5%
- Equity multiple
- 4.96×
- Total profit
- $249,449
- Equity at exit
- $202,698
- IRR
- 47.1%
- Equity multiple
- 11.08×
- Total profit
- $635,091
- Equity at exit
- $437,126
Cash invested: $63,000 (down + closing). Projections, not guarantees.
Landlord ↔ Tenant lean methodology
- Overall (STATE)
- 15 Strongly Tenant-Friendly
- State New York
- 15 Strongly Tenant-Friendly · D+10
- County
- — inherits STATE
- City
- — inherits STATE
ZIP-level market 13904
- Home prices YoY
- 17.1%
- Active inventory
- 41
- Price-to-rent
- 16.4×
Monthly cashflow live
- Estimated rent
- $4,573 medium interval (Pro) →
- Mortgage (P&I)
- −$1,180
- Tax from tax record
- −$282 /mo · $3,380/yr
- Insurance
- −$94
- Flood insurance flood zone
- −$66 /mo · $798/yr
- HOA
- −$0
- Vacancy / Maint / Mgmt
- −$960
- Net cashflow
- $1,991
Break-even live
Sensitivity live
| Price | -10% $2,118 | -5% $2,055 | +0% $1,991 | +5% $1,927 | +10% $1,863 |
|---|---|---|---|---|---|
| Rent | -10% $1,630 | -5% $1,810 | +0% $1,991 | +5% $2,171 | +10% $2,352 |
| Rate | -1.0pp $2,104 | -0.5pp $2,048 | base $1,991 | +0.5pp $1,933 | +1.0pp $1,873 |
4-unit breakdown (identical units grouped — click to expand)
| Units | Beds | Baths | Est. rent |
|---|---|---|---|
| 4× units | 4 | 4 | $4,572 |
| #1 | 4 | 4 | $1,143 |
| #2 | 4 | 4 | $1,143 |
| #3 | 4 | 4 | $1,143 |
| #4 | 4 | 4 | $1,143 |
| Total (4 units) | $4,573 | ||
UW: 25.0% down · 7.5% · 30yr · 1.5% tax · 5.0% vac · 8.0% maint · 8.0% mgmt
Financing live
Cash to close
- Down payment
- $56,250
- Closing costs
- $6,750
- Reserves months
- —
- Total cash needed
- —
Loan-product check · same deal, 3 products live
Conventional
25% down · 7.5% · 30yr
- Down + closing
- —
- Monthly P&I
- —
- Monthly cashflow
- —
- DSCR
- —
- Eligible?
- —
Personal DTI + credit; lowest rate.
DSCR
20% down · 8.5% · 30yr
- Down + closing
- —
- Monthly P&I
- —
- Monthly cashflow
- —
- DSCR
- —
- Eligible?
- —
No personal income docs; deal must DSCR.
Hard money
10% down · 12.0% · 12mo
- Down + closing
- —
- Monthly P&I
- —
- Monthly cashflow
- —
- DSCR
- —
- Eligible?
- —
Short-term bridge; refi at stabilization.
Listing history 11 events
-
2026-06-21days on market $225,000 Active 13 DOM
-
2026-06-19days on market $225,000 Active 11 DOM
-
2026-06-18days on market $225,000 Active 10 DOM
-
2026-06-17days on market $225,000 Active 9 DOM
-
2026-06-16days on market $225,000 Active 8 DOM
-
2026-06-15days on market $225,000 Active 7 DOM
-
2026-06-14days on market $225,000 Active 5 DOM
-
2026-06-13days on market $225,000 Active 4 DOM
-
2026-06-10days on market $225,000 Active 2 DOM
-
2026-06-09remarks 422-char remark
-
2026-06-09$225,000 Active 1 DOM
ⓘ Source: listings_history table (triggers on properties + properties_extension) + one-shot
backfill from property_details.listing_events for pre-trigger history.
Tax reassessment forecast NY · Partial reset (capped growth)
- Current annual tax
- $3,380 · $282/mo
- Projected year-2 tax
- $3,591 · $299/mo
- Expected delta
- +$211/yr (+$18/mo · 6.2%)
ⓘ Screening estimate from a state-policy table — verify with the county assessor before closing.
Climate risk First Street
- Flood 8/10 Severe FEMA zone X (shaded) · 78% chance over 30 yrs
- Wildfire 1/10 Low
- Heat 3/10 Moderate 8 d/yr ≥92°F today · 17 d/yr by 30 yrs out
- Wind 2/10 Low 100% chance of damaging wind over 30 yrs
- Air quality 2/10 Low 0 unhealthy d/yr today · 1 by 30 yrs out
Nearby sold comps map
Loading sold comps map…
Walkable amenities ~0.75 mi
Loading nearby amenities…
Taxation est. · year 1
- Rental income
- $54,876
- − Mortgage interest
- −$12,603
- − Property taxes
- −$3,380
- − Insurance
- −$1,922
- − Repairs & maintenance
- −$4,390
- − Management
- −$4,390
- − Depreciation
- −$6,545
- Taxable income
- $21,644
- Est. tax owed @ 24.0%
- −$5,195
- After-tax cash flow
- $18,695/yr
For passive investors: Depreciation is non-cash, so a rental often shows a tax loss while cash-flowing — sheltering income. Rental losses are passive: they offset passive income freely, and up to $25,000/yr can offset ordinary (W-2) income if you actively participate and your MAGI is under $100k (phasing out to $0 by $150k); unused losses carry forward. On sale, claimed depreciation is recaptured at up to 25%, and gains may owe capital-gains tax (a 1031 exchange can defer both). Figures are a year-1 estimate at your 24.0% rate — not tax advice; consult a CPA.
Schools (NCES district)
- District
- Binghamton City School District
- NCES district ID
- 3604870
- Math proficiency
- 30% ▬ 0.00%
- Reading proficiency
- 44% ▲ 15.00%
- Median HH income
- $30,475
- Composite
- 30.09/100
- National rank
- #6342
- State rank
- #557 of 590 in NY
Livability — Binghamton
- Score
- 78/100
- State rank
- #174
- US rank
- #2710
Category grades
Schools grade is shown separately in the Schools card above.
Census & demographics
- Census place
- Binghamton, NY
- City population
- 65,170
- Population (ZIP)
- 9,138
Population outlook (Broome County) Hauer SSP2
- Today (2025)
- 187,989 people
- By 2030
- 183,066 · -2.6%
- By 2040
- 172,228 · -8.4%
- By 2050
- 163,161 · -13.2%
- By 2075
- 153,641 · -18.3%
- By 2100
- 140,851 · -25.1%
Race, ethnicity, and origin ACS 2023
- Neighborhood character
- Predominantly White (73%)
- Race & ethnicity
- White 73% Black 12% Hispanic / Latino 8% Two or more races 5% Asian 3%
- Hispanic origin (detail)
- Puerto Rican 5%
- Common ancestry
- Hispanic 8% Romanian 3% Slovak 2%
- Foreign-born
- 9% · Canada, China
- Languages at home
- 87% English-only · French/Haitian/Cajun 5% Spanish 4% Chinese 2%
Political lean MEDSL · Broome
- 2024 margin
- Toss-up / Even · D 50.2% · R 49.8%
- 2008→2024 swing
- -7.6pp toward R · 2008: 8.0pp · 2024: 0.4pp
- All cycles
- 2024: D+0.4 2020: D+3.5 2016: R+3.7 2012: D+4.6 2008: D+8.0
Not yet ingested
- Civics
- —
Market trends
- HPI YoY
- ▲ 40.85%
- Current HPI
- 280.3184
- Rent YoY
- —
- Metro
- —
- State GDP YoY
- ▲ 2.60%
- F500 in state
- 92
Industry mix (Fortune 500 HQ in NY)
| Industry | F500 HQs | Revenue |
|---|---|---|
| Financial Services | 10 | $950B |
|
||
| Consumer Goods | 9 | $162B |
|
||
| Insurance | 4 | $225B |
|
||
| Telecommunications | 2 | $144B |
|
||
| Pharmaceuticals | 2 | $112B |
|
||
| Media / Entertainment | 2 | $69B |
|
||
Price history
-10.0% since first listed4 events — show timeline
- 2026-06-08 Listed $225,000 GBAOR
- 2025-10-31 Relisted — GBAOR
- 2025-10-31 Price Changed $245,000 GBAOR
- 2025-09-11 Listed $249,900 GBAOR
Property tax history
+0.8%/yrLatest (2025): $3,380 · +0.9% YoY. Source: county tax records.
Cash-flow waterfall
monthlySold comps — $/sqft
last 12 mo · ≤1 miLoading sold comps…