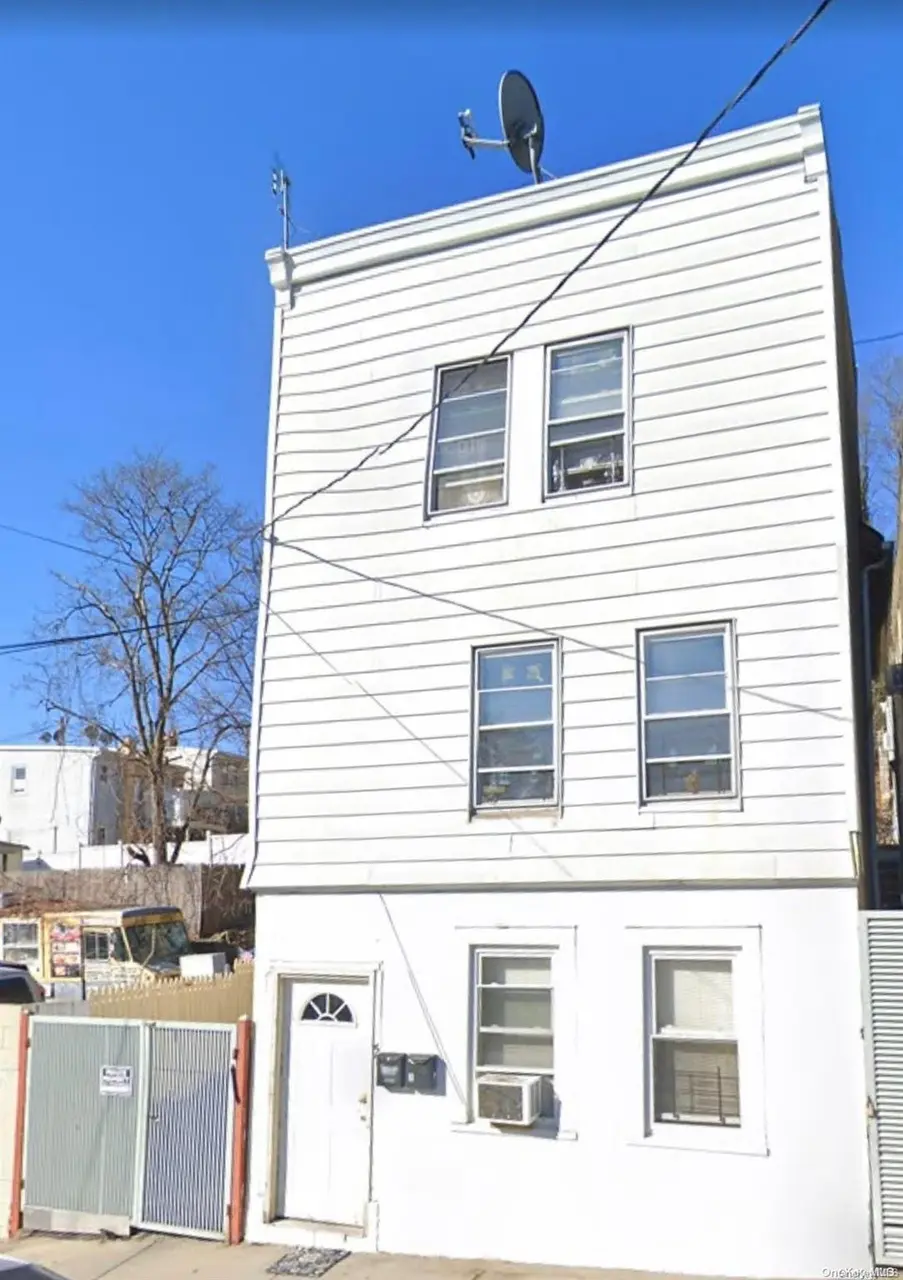
57 Orchard St · Yonkers, NY
Flood risk 1/10 · Minimal
- FEMA flood zone
- X (unshaded)
- Chance of flooding over 30 yrs
- 0.0%
- Est. flood insurance / yr
- $473 – $860
Fire risk 1/10 · Minimal
- Est. fire insurance / yr
- $691 – $1,283
Heat risk 6/10 · Moderate
- Hot days now (above 99°F)
- 7 days/yr
- Hot days in 30 yrs
- 15 days/yr
Wind risk 6/10 · Moderate
- Chance of severe wind over 30 yrs
- 27.0%
Air-quality risk 3/10 · Minor
- Unhealthy air days now
- 3 days/yr
- Unhealthy air days in 30 yrs
- 4 days/yr
Risk factors via First Street. Map © Google.
Why this score? — see what drove the D- grade
The composite is a weighted blend of 9 inputs, each scored 0–100. Each bar is that input's sub-score; the figure is the points it added to the 100-point composite (weight × sub-score).
- ARV discount +11.7/15.0
- Cash flow +8.9/30.0
- Schools +4.1/10.0
- Livability +3.4/5.0
- 1% rule +2.7/10.0
- DSCR +2.5/10.0
- Rent growth +2.5/5.0
- Condition / age +2.5/5.0
- Appreciation +0.0/10.0
$434,999
🖨 Deal sheet (PDF) 📄 Offer letter ✓ Due diligence
Listing remarks
Fantastic 1 Family House, offers great living options, perfect for investment if you looking for that option. 1st. Floor: 2 bedrooms 1 bathroom with shower, 2nd Floor: 1 bedroom one bathroom with bathtub, eat in kitchen, Living room; 3rd floor: 2 bedrooms 1 bathroom with shower. Close to Metro North, buses , close to highways, parks and downtown Yonkers.
Key facts
- 2,853 sq ft lot
- Built 1910
- Listed 262 days
Neighborhood map
What this means for you Summary
Snapshot
- This is a 3-bed/1.0-bath single-family listed at $435k.
Deal economics
- At list price, monthly cash flow is $-349 ($-4k/yr) — negative.
- To cash-flow at today's rent, offer at most $384k (11.6% below list).
- To meet the 1% rule (rent ≥ 1% of price), the offer needs to be $336k (22.7% below list).
- Recommended offer: $336k (22.7% below list) — sets the bar for 1% rule.
Location & tenants
- Location reads 68/100 on livability (#528 in NY) — a middle-class / working-renter tenant base. Strengths: employment A, commute B; Watch: amenities F, cost of living F.
- Yonkers City School District (suburban): math 41% / reading 54% proficiency, ranked #413 of 590 in NY (top 70%) — families likely to look elsewhere, expect single-tenant / working-renter base with shorter leases; 64% free/reduced lunch — lower-income household profile, screen leases tightly.
- Zoned schools: Yonkers High School (math 92% / reading 88%, grade A+, #238 of 1,100 statewide, top 23%, 1,060 students, 76% FRL).
- Zoned-school proficiency averages 90% at this address vs 48% district-wide (+42 pts) — the actual schools serving this property are materially stronger than the Yonkers City School District average implies; a family-tenant draw the district grade alone would hide.
- Market conditions: 76 active listings in the ZIP; 40 comparable units currently listed for rent nearby; rentals lingering (median 46d on market — plan ~5-8 weeks vacancy on turnover, expect pricing pressure); 50% of comp listings sitting > 30 days — soft ceiling on asking rent; solid renter incomes; 954 units permitted in Westchester County in 2024 (649 in 5+ unit buildings).
- This rent runs 45% of the median local income ($90k/yr) — at the standard rent-burdened threshold; future hikes will face affordability resistance.
Forward outlook
- Local home prices are declining (-3.0%/yr); year-one equity from $3k of loan paydown is wiped out by about $13k of value loss. Plan a longer hold.
- Westchester County population projected at +10% by 2050 — modest demand growth; plan on rents tracking national, not racing it.
Negotiation context
- It's been on market 262 days — a 12% lower offer ($383k) is reasonable based on typical stale-listing flexibility.
- 3 sale attempts since 19y ago with the ask held roughly flat each time — persistent listings suggest the price (not the market) is what's stuck; bring a comps-based counter.
Risks & watch-outs
- Watch-outs: built in 1910 — expect roof / HVAC / electrical / plumbing capex.
- Climate carrying-cost: major wind risk, 27% chance of damaging wind over 30y; extreme-heat days projected 7→15/yr by 2055 (HVAC capex compounding) — expect insurance premiums to compound above CPI over the hold.
Questions for the listing agent
- What do current leases actually rent for vs. the listed asking? Can we see a recent rent roll and the last 12 months of T-12 income?
- It's been on market 262 days. Have you received any prior offers? Is the seller open to a 23% concession, seller financing, or rate buy-down credit?
- Built in 1910 — when were the roof, HVAC, electrical panel, plumbing, and water heater last replaced?
- Why hasn't it sold? Are there any deal-killer items the seller is aware of (foundation, flood, title, zoning, code violations)?
- Is there a deadline driving the sale (1031 exchange, divorce, estate, relocation)? That informs how much negotiation room exists.
- The area grade is low — what's the realistic commute time and amenity access for the typical tenant pool here? Any planned neighborhood developments (good or bad) we should know about?
- What's the average days-on-market for RENTAL listings here right now (not sales)? A rising rental-DOM trend means longer vacancies and softer asking-rent achievability than the comps imply.
- What's the recent tenant-quality profile in this submarket — average credit score on applications, eviction rate, late-payment / NSF rate, and stable-employment percentage? A property-management company in the area should have these aggregated.
- How much new for-sale + rental construction is in the pipeline within 1–3 miles? Heavy new supply typically softens prices + rents 12–24 months out; constrained supply supports both.
Investment metrics
- 1% rule
- 0.77% ✗
- Cap rate
- 5.33%
- Cash-on-cash
- -3.44%
- DSCR
- 0.85
- GRM
- 10.8
CMA / ARV
- ARV (on-the-fly)
- $479,624
- Comps found
- 12
Show comp detail 12 sales within ~0.75 mi
| Address | Dist | Beds/Ba | Sqft | Sold | Price | $/sf | Match |
|---|---|---|---|---|---|---|---|
| 62 Vineyard Ave | 0.04mi | 3/3.0 | 1,455 (+9%) | 14mo | $550,000 | $378 | 64 |
| 451 Walnut St | 0.25mi | 3/1.5 | 1,180 (-12%) | 7mo | $520,000 | $441 | 61 |
| 238 Woodland Ave | 0.70mi | 3/2.5 | 1,320 (-1%) | 1mo | $655,000 | $496 | 59 |
| 264 Woodworth Ave | 0.69mi | 3/1.5 | 1,310 (-2%) | 5mo | $470,000 | $359 | 59 |
| 32 Centre St | 0.28mi | 3/2.0 | 1,144 (-14%) | 4mo | $400,000 | $350 | 55 |
| 28 Centre St | 0.29mi | 3/2.0 | 1,144 (-14%) | 7mo | $546,000 | $477 | 52 |
| 36 Linden St | 0.53mi | 4/2.5 (+1) | 1,344 (+1%) | 13mo | $510,000 | $379 | 52 |
| 461 Walnut St | 0.24mi | 3/2.0 | 1,188 (-11%) | 19mo | $315,000 | $265 | 51 |
| 228 Edwards Pl | 0.42mi | 3/2.0 | 1,476 (+10%) | 15mo | $365,000 | $247 | 47 |
| 235 Edwards Pl | 0.43mi | 3/1.5 | 1,176 (-12%) | 14mo | $420,000 | $357 | 46 |
| 45 AKA 47 Portland Pl | 0.74mi | 3/2.0 | 1,523 (+14%) | 4mo | $540,000 | $355 | 35 |
| 49 Poplar St | 0.73mi | 4/1.0 (+1) | 1,200 (-10%) | 16mo | $315,000 | $263 | 30 |
Match score weights: distance 35% · size 25% · config 20% · recency 20%. Top-matched comps best support the ARV.
Projected returns pro-forma
-3.0% appreciation · 3.0% rent growth · sell at horizon
- IRR
- -22.0%
- Equity multiple
- 0.24×
- Total profit
- $-92,677
- Equity at exit
- $64,860
- IRR
- -16.0%
- Equity multiple
- 0.10×
- Total profit
- $-109,131
- Equity at exit
- $37,611
Cash invested: $121,800 (down + closing). Projections, not guarantees.
Landlord ↔ Tenant lean methodology
- Overall (CITY)
- 5 Strongly Tenant-Friendly
- State New York
- 15 Strongly Tenant-Friendly · D+10
- County
- — inherits STATE
- City Yonkers
- 5 Strongly Tenant-Friendly · D+20
ZIP-level market 10703
- Home prices YoY
- -13.2%
- Active inventory
- 76
- Price-to-rent
- 10.8×
Monthly cashflow live
- Estimated rent
- $3,363 high interval (Pro) →
- Mortgage (P&I)
- −$2,281
- Tax est. 1.5%
- −$544 /mo · $6,525/yr
- Insurance
- −$181
- HOA
- −$0
- Vacancy / Maint / Mgmt
- −$706
- Net cashflow
- $-349
Break-even live
Sensitivity live
| Price | -10% $-49 | -5% $-199 | +0% $-349 | +5% $-499 | +10% $-650 |
|---|---|---|---|---|---|
| Rent | -10% $-615 | -5% $-482 | +0% $-349 | +5% $-216 | +10% $-83 |
| Rate | -1.0pp $-130 | -0.5pp $-239 | base $-349 | +0.5pp $-462 | +1.0pp $-577 |
UW: 25.0% down · 7.5% · 30yr · 1.5% tax · 5.0% vac · 8.0% maint · 8.0% mgmt
Financing live
Cash to close
- Down payment
- $108,750
- Closing costs
- $13,050
- Reserves months
- —
- Total cash needed
- —
Loan-product check · same deal, 3 products live
Conventional
25% down · 7.5% · 30yr
- Down + closing
- —
- Monthly P&I
- —
- Monthly cashflow
- —
- DSCR
- —
- Eligible?
- —
Personal DTI + credit; lowest rate.
DSCR
20% down · 8.5% · 30yr
- Down + closing
- —
- Monthly P&I
- —
- Monthly cashflow
- —
- DSCR
- —
- Eligible?
- —
No personal income docs; deal must DSCR.
Hard money
10% down · 12.0% · 12mo
- Down + closing
- —
- Monthly P&I
- —
- Monthly cashflow
- —
- DSCR
- —
- Eligible?
- —
Short-term bridge; refi at stabilization.
Rent comps 40 comps
| Address | Beds | Baths | Sqft | Rent | $/sqft | DOM | Units | Dist |
|---|---|---|---|---|---|---|---|---|
| 4 Ritters Ln Unit 1FL Yonkers, NY | 3.0 | 1.0 | 1100 | $3,300 | $3.00 | 45d | 1 | 0.21mi |
| 82 Morningside Ave Unit 1 Yonkers, NY | 3.0 | 3.5 | 1734 | $4,000 | $2.31 | 26d | 1 | 0.26mi |
| 82 Morningside Ave Unit 2 Yonkers, NY | 3.0 | 2.5 | 1734 | $4,000 | $2.31 | 45d | 1 | 0.26mi |
| 155 Lake Ave Yonkers, NY | 3.0 | 1.0 | 1000 | $3,200 | $3.20 | 18d | 1 | 0.33mi |
| 250 N Broadway Unit 2E Yonkers, NY | 2.0 | 1.0 | 950 | $2,400 | $2.53 | 26d | 1 | 0.44mi |
| 37 Troy Ln Unit 1 Yonkers, NY | 4.0 | 1.5 | 1500 | $4,200 | $2.80 | 9d | 1 | 0.48mi |
| 11 Garfield St Unit 2 Yonkers, NY | 2.0 | 1.0 | 1250 | $2,250 | $1.80 | 17d | 1 | 0.52mi |
| 312 Edwards Pl Unit 1 Yonkers, NY | 3.0 | 1.5 | 1550 | $4,000 | $2.58 | 45d | 1 | 0.57mi |
| 39 Victor St Unit 2 Yonkers, NY | 3.0 | 1.0 | 900 | $2,650 | $2.94 | 45d | 1 | 0.58mi |
| 221 Woodland Ave Yonkers, NY | 2.0 | 1.0 | 1470 | $2,650 | $1.80 | 9d | 1 | 0.63mi |
| 189 Elm St Unit 1 Yonkers, NY | 3.0 | 1.0 | 1000 | $2,650 | $2.65 | 45d | 1 | 0.63mi |
| 237 Woodland Ave Unit 2 Yonkers, NY | 2.0 | 1.0 | 970 | $2,600 | $2.68 | 45d | 1 | 0.66mi |
| 348 Saw Mill River Rd Unit 2 Yonkers, NY | 3.0 | 1.0 | 900 | $3,200 | $3.56 | 26d | 1 | 0.68mi |
| 369 Warburton Ave Unit 4A Yonkers, NY | 3.0 | 1.0 | 950 | $3,500 | $3.68 | 45d | 1 | 0.71mi |
| 369 Warburton Ave Unit 2B Yonkers, NY | 2.0 | 1.0 | 930 | $2,650 | $2.85 | 45d | 1 | 0.71mi |
| 47 Lincoln Ter Yonkers, NY | 3.0 | 2.0 | 1700 | $4,300 | $2.53 | 6d | 1 | 0.72mi |
| 65 Tower Pl Unit 1st floor Yonkers, NY | 2.0 | 1.0 | 1400 | $3,200 | $2.29 | 45d | 1 | 0.75mi |
| 552 N Broadway Yonkers, NY | 2.0 | 1.0 | 1300 | $2,800 | $2.15 | 45d | 1 | 0.81mi |
| 79 Alexander St Yonkers, NY | 3.0 | 1.0–2.5 | 997 | $3,995 | $4.01 | 0d | 1 | 0.83mi |
| 55 Riverside Dr Yonkers, NY | 3.0 | 1.0–3.0 | 944 | $5,367 | $5.68 | 0d | 15 | 0.84mi |
| 57 Alexander St Yonkers, NY | 2.0 | 1.0–2.0 | 765 | $3,690 | $4.82 | 4d | 21 | 0.86mi |
| 39 Spruce St Unit 1 Yonkers, NY | 3.0 | 1.5 | 920 | $3,300 | $3.59 | 45d | 1 | 0.86mi |
| 50 Nepperhan St Yonkers, NY | 3.0 | 1.0–2.0 | 887 | $5,017 | $5.65 | 0d | 19 | 0.87mi |
| 103 Burhans Ave Yonkers, NY | 2.0 | 1.0 | 894 | $2,000 | $2.24 | 45d | 1 | 0.87mi |
| 1 Alexander St Yonkers, NY | 2.0 | 1.0–2.0 | 837 | $4,000 | $4.78 | 9d | 48 | 0.95mi |
| 211 Mary Lou Ave #1 Yonkers, NY | 2.0 | 1.0 | 1138 | $2,475 | $2.17 | 17d | 1 | 0.95mi |
| 66 Main St Yonkers, NY | 2.0 | 1.0–2.0 | 881 | $3,650 | $4.14 | 1d | 6 | 0.97mi |
| 4 Fowler Ave Unit 1 floor Yonkers, NY | 2.0 | 1.0 | 1400 | $2,700 | $1.93 | 45d | 1 | 0.99mi |
| 44 Hudson St Yonkers, NY | 2.0 | 1.0–2.0 | 922 | $4,300 | $4.66 | 9d | 25 | 0.99mi |
| 151 Burhans Ave Unit 1 Yonkers, NY | 3.0 | 1.0 | 1500 | $3,550 | $2.37 | 45d | 1 | 1.01mi |
| 85 Bennett Ave Unit 2 Yonkers, NY | 2.0 | 1.0 | 1000 | $2,500 | $2.50 | 45d | 1 | 1.05mi |
| 246 Stone Ave Yonkers, NY | 3.0 | 1.0 | 900 | $3,300 | $3.67 | 6d | 1 | 1.07mi |
| 703 Palisade Ave Unit Third Floor Yonkers, NY | 2.0 | 1.0 | 900 | $2,000 | $2.22 | 6d | 1 | 1.10mi |
| 740 Palisade Ave Yonkers, NY | 3.0 | 1.0 | 1200 | $2,900 | $2.42 | 26d | 1 | 1.14mi |
| 287 Mary Lou Ave Unit 2 Yonkers, NY | 3.0 | 2.0 | 1400 | $3,500 | $2.50 | 45d | 1 | 1.15mi |
| 52 Groshon Ave Apt 2N Yonkers, NY | 3.0 | 1.0 | 1000 | $2,469 | $2.47 | 45d | 1 | 1.22mi |
| 20 Water Grant St Yonkers, NY | 1.0–2.0 | 1.0–2.0 | 827 | $3,756 | $4.54 | 0d | 21 | 1.24mi |
| 65 Caroline Ave Unit 1L Yonkers, NY | 3.0 | 1.0 | 1050 | $2,700 | $2.57 | 45d | 1 | 1.24mi |
| 278 Mile Square Rd Yonkers, NY | 2.0 | 1.0 | 1000 | $2,650 | $2.65 | 45d | 1 | 1.28mi |
| 594 Yonkers Ave Unit 5 Yonkers, NY | 2.0 | 1.0 | 900 | $2,500 | $2.78 | 45d | 1 | 1.30mi |
Listing history 8 events
-
2024-11-22soldstatus $400,000
-
2024-04-23status Pending
-
2023-11-09status Active
-
2023-08-16status Pending
-
2023-05-11$434,999 Active
-
2009-02-20soldstatus $207,000
-
2008-02-29historical
-
2007-08-31
ⓘ Source: listings_history table (triggers on properties + properties_extension) + one-shot
backfill from property_details.listing_events for pre-trigger history.
Climate risk First Street
- Flood 1/10 Low FEMA zone X (unshaded) · 0% chance over 30 yrs
- Wildfire 1/10 Low
- Heat 6/10 Major 7 d/yr ≥99°F today · 15 d/yr by 30 yrs out
- Wind 6/10 Major 27% chance of damaging wind over 30 yrs
- Air quality 3/10 Moderate 3 unhealthy d/yr today · 4 by 30 yrs out
Nearby sold comps map
Loading sold comps map…
Walkable amenities ~0.75 mi
Loading nearby amenities…
Taxation est. · year 1
- Rental income
- $40,360
- − Mortgage interest
- −$24,367
- − Property taxes
- −$6,525
- − Insurance
- −$2,175
- − Repairs & maintenance
- −$3,229
- − Management
- −$3,229
- − Depreciation
- −$12,655
- Taxable loss
- −$11,819
- Est. tax savings @ 24.0%
- +$2,837
- After-tax cash flow
- $-1,353/yr
For passive investors: Depreciation is non-cash, so a rental often shows a tax loss while cash-flowing — sheltering income. Rental losses are passive: they offset passive income freely, and up to $25,000/yr can offset ordinary (W-2) income if you actively participate and your MAGI is under $100k (phasing out to $0 by $150k); unused losses carry forward. On sale, claimed depreciation is recaptured at up to 25%, and gains may owe capital-gains tax (a 1031 exchange can defer both). Figures are a year-1 estimate at your 24.0% rate — not tax advice; consult a CPA.
Schools (NCES district)
- District
- Yonkers City School District
- NCES district ID
- 3631920
- Math proficiency
- 41% ▼ -1.00%
- Reading proficiency
- 54% ▲ 14.00%
- Median HH income
- $58,042
- Composite
- 41.43/100
- National rank
- #3471
- State rank
- #413 of 590 in NY
Livability — Yonkers
- Score
- 68/100
- State rank
- #528
- US rank
- #9394
Category grades
Schools grade is shown separately in the Schools card above.
Census & demographics
- Census place
- Yonkers, NY
- County
- Westchester County · 709,332 people
- City population
- 212,407
- Metro
- New York-Newark-Jersey City, NY-NJ-PA
- Population (ZIP)
- 22,586
- Household income
- $89,773
- Rent vs Own
- Severe rent burden
- 1216.0
Population outlook (Westchester County) Hauer SSP2
- Today (2025)
- 1,028,035 people
- By 2030
- 1,051,636 · +2.3%
- By 2040
- 1,098,520 · +6.9%
- By 2050
- 1,136,044 · +10.5%
- By 2075
- 1,196,925 · +16.4%
- By 2100
- 1,175,147 · +14.3%
Race, ethnicity, and origin ACS 2023
- Neighborhood character
- Diverse neighborhood (Simpson 0.69)
- Race & ethnicity
- Hispanic / Latino 43% White 30% Black 19% Two or more races 16% Asian 5%
- Hispanic origin (detail)
- Mexican 5% Puerto Rican 9% Dominican 13%
- Common ancestry
- Romanian 4% Russian 2% Subsaharan African 1%
- Foreign-born
- 32% · Canada, Jamaica, China
- Languages at home
- 50% English-only · Spanish 37% Other Indo-European 5% Russian/Polish/Slavic 2%
Political lean MEDSL · Westchester
- 2024 margin
- Strong D (+26.3) · D 63.1% · R 36.9%
- 2008→2024 swing
- -1.3pp toward R · 2008: 27.6pp · 2024: 26.3pp
- All cycles
- 2024: D+26.3 2020: D+36.3 2016: D+32.8 2012: D+22.2 2008: D+27.6
Not yet ingested
- Civics
- —
Market trends
- HPI YoY
- ▼ -47.22%
- Current HPI
- 311.0396
- Rent YoY
- —
- Metro
- New York-Newark-Jersey City, NY-NJ-PA
- State GDP YoY
- ▲ 2.60%
- F500 in state
- 92
Industry mix (Fortune 500 HQ in NY)
| Industry | F500 HQs | Revenue |
|---|---|---|
| Financial Services | 10 | $950B |
|
||
| Consumer Goods | 9 | $162B |
|
||
| Insurance | 4 | $225B |
|
||
| Telecommunications | 2 | $144B |
|
||
| Pharmaceuticals | 2 | $112B |
|
||
| Media / Entertainment | 2 | $69B |
|
||
Price history
+93.2% since first listed8 events — show timeline
- 2024-11-22 Sold (Public Records) $400,000 Public Records
- 2024-04-23 Pending — OneKey® MLS as Distributed by MLS Grid
- 2023-11-09 Relisted — OneKey® MLS as Distributed by MLS Grid
- 2023-08-16 Pending — OneKey® MLS as Distributed by MLS Grid
- 2023-05-11 Listed $434,999 OneKey® MLS as Distributed by MLS Grid
- 2009-02-20 Sold (Public Records) $207,000 Public Records
- 2008-02-29 Delisted — HGMLS
- 2007-08-31 Listed — HGMLS
Property tax history
-24.7%/yrLatest (2025): $758 · +0.8% YoY. Source: county tax records.
Cash-flow waterfall
monthlySold comps — $/sqft
last 12 mo · ≤1 miLoading sold comps…