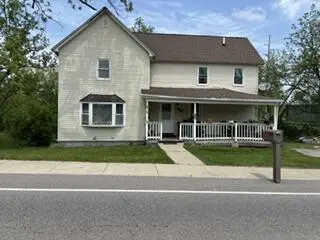
10880 W 93rd Ave · St. John, IN
Flood risk 1/10 · Minimal
- FEMA flood zone
- X (unshaded)
- Chance of flooding over 30 yrs
- 0.0%
- Est. flood insurance / yr
- $473 – $860
Fire risk 1/10 · Minimal
- Est. fire insurance / yr
- $717 – $1,331
Heat risk 3/10 · Minor
- Hot days now (above 101°F)
- 7 days/yr
- Hot days in 30 yrs
- 16 days/yr
Wind risk 2/10 · Minimal
- Chance of severe wind over 30 yrs
- 0.0%
Air-quality risk 2/10 · Minimal
- Unhealthy air days now
- 2 days/yr
- Unhealthy air days in 30 yrs
- 2 days/yr
Risk factors via First Street. Map © Google.
Why this score? — see what drove the D grade
The composite is a weighted blend of 9 inputs, each scored 0–100. Each bar is that input's sub-score; the figure is the points it added to the 100-point composite (weight × sub-score).
- Cash flow +16.3/30.0
- ARV discount +7.5/15.0
- DSCR +5.1/10.0
- Schools +4.5/10.0
- 1% rule +4.0/10.0
- Rent growth +2.5/5.0
- Livability +2.5/5.0
- Condition / age +2.5/5.0
- Appreciation +0.0/10.0
$249,900
🖨 Deal sheet 📄 Offer letter ✓ Due diligence
Listing remarks MLS
REO Property. Property Sold AS-IS W/ O Repair, Warranty or Seller Disclosure. The Listing Broker & Seller assume no responsibility & make no guarantees, warranties or representations as to the availability or accuracy of information contained herein
Key facts
- Updated appliances
- Basement
- Front porches
Tags
Property features AI
Exterior
- Parking: Driveway with gravel surface
- Utilities: Public water; Septic tank; Water connected
- Home design: Two-story home; Built in 1910
- Construction: Has basement (partially finished, walk-out access)
- Exterior features: On waterfront (creek); Trees/woods view; Front porch; Rear porch
Interior
- Kitchen: Range; Refrigerator
- Bedrooms: Primary bedroom; Bedroom 2; Bedroom 3
- Flooring: Hardwood; Tile
- Bathrooms: 2 full bathrooms
- Heating & cooling: Forced air heating; Central air conditioning
- Interior features: Ceiling fans; Country-style kitchen; Eat-in kitchen; Accessible doors; Partially finished walk-out basement
- Laundry & utility: Washer; Dryer
Neighborhood map
What this means for you Summary
Snapshot
- This is a 4-bed/1.0-bath single-family listed at $250k.
Deal economics
- At list price, monthly cash flow is $139 ($2k/yr) — positive.
- The deal already cash-flows at list — no discount required.
- To meet the 1% rule (rent ≥ 1% of price), the offer needs to be $226k (9.8% below list).
- Recommended offer: $226k (9.8% below list) — sets the bar for 1% rule.
- Cap rate 7.0% vs local median 3.6% in St. John — top-decile yield for the area; either an underpriced asset or a hidden risk that comps aren't pricing in. Stress-test before assuming the spread holds.
Location & tenants
- Location reads: area grade D — affects rentability + tenant quality, not the cash-flow math above.
- Lake Central School Corporation (suburban): math 45% / reading 54% proficiency, ranked #41 of 301 in IN (top 14%) — families likely to look elsewhere, expect single-tenant / working-renter base with shorter leases; only 15% free/reduced lunch — higher-income household profile.
- Zoned schools: Lake Central High School (math 46% / reading 74%, grade C+, #46 of 369 statewide, top 13%, 3,069 students, 23% FRL).
- Market conditions: 260 active listings in the ZIP; 1,642 units permitted in Lake County in 2024 (14 in 5+ unit buildings).
Forward outlook
- Local home prices are declining (-3.0%/yr); year-one equity from $2k of loan paydown is wiped out by about $7k of value loss. Plan a longer hold.
- Lake County population projected to shrink 7% by 2050 — rents likely to lag national; underwrite the cash flow, not the appreciation.
Negotiation context
- It's been on market 27 days — a 2% lower offer ($246k) is reasonable based on typical stale-listing flexibility.
- 7 sale attempts since 24y ago; this cycle's ask has dropped $46k (16%) from the opening price — seller is motivated, your offer sets the floor, not the list.
- Current owner paid $43k; list at $250k implies a 479% gain — meaningful room to come down on a strong offer.
Risks & watch-outs
- Watch-outs: built in 1910 — expect roof / HVAC / electrical / plumbing capex.
Questions for the listing agent
- Built in 1910 — when were the roof, HVAC, electrical panel, plumbing, and water heater last replaced?
- Is there a deadline driving the sale (1031 exchange, divorce, estate, relocation)? That informs how much negotiation room exists.
- The area grade is low — what's the realistic commute time and amenity access for the typical tenant pool here? Any planned neighborhood developments (good or bad) we should know about?
- What's the average days-on-market for RENTAL listings here right now (not sales)? A rising rental-DOM trend means longer vacancies and softer asking-rent achievability than the comps imply.
- What's the recent tenant-quality profile in this submarket — average credit score on applications, eviction rate, late-payment / NSF rate, and stable-employment percentage? A property-management company in the area should have these aggregated.
- How much new for-sale + rental construction is in the pipeline within 1–3 miles? Heavy new supply typically softens prices + rents 12–24 months out; constrained supply supports both.
Investment metrics
- 1% rule
- 0.90% ✗
- Cap rate
- 6.96%
- Cash-on-cash
- 2.38%
- DSCR
- 1.11
- GRM
- 9.2
CMA / ARV
- ARV (on-the-fly)
- $102,672
- Comps found
- 1
Show comp detail 1 sale within ~0.75 mi
| Address | Dist | Beds/Ba | Sqft | Sold | Price | $/sf | Match |
|---|---|---|---|---|---|---|---|
| 10450 W 93rd Ave | 0.28mi | 3/2.0 (-1) | 1,664 (+12%) | 23mo | $115,000 | $69 | 39 |
Match score weights: distance 35% · size 25% · config 20% · recency 20%. Top-matched comps best support the ARV.
Projected returns pro-forma
-3.0% appreciation · 3.0% rent growth · sell at horizon
- IRR
- -12.5%
- Equity multiple
- 0.55×
- Total profit
- $-31,665
- Equity at exit
- $37,261
- IRR
- -3.5%
- Equity multiple
- 0.77×
- Total profit
- $-16,253
- Equity at exit
- $21,607
Cash invested: $69,972 (down + closing). Projections, not guarantees.
Landlord ↔ Tenant lean methodology
- Overall (STATE)
- 90 Strongly Landlord-Friendly
- State Indiana
- 90 Strongly Landlord-Friendly · R+11
- County
- — inherits STATE
- City
- — inherits STATE
ZIP-level market 46373
- Home prices YoY
- -23.8%
- Active inventory
- 260
- Price-to-rent
- 9.2×
Monthly cashflow live
- Estimated rent
- $2,255 medium interval (Pro) →
- Mortgage (P&I)
- −$1,311
- Tax from tax record
- −$228 /mo · $2,735/yr
- Insurance
- −$104
- HOA
- −$0
- Vacancy / Maint / Mgmt
- −$474
- Net cashflow
- $139
Break-even live
UW: 25.0% down · 7.5% · 30yr · 1.5% tax · 5.0% vac · 8.0% maint · 8.0% mgmt
Financing live
Cash to close
- Down payment
- $62,475
- Closing costs
- $7,497
- Reserves months
- —
- Total cash needed
- —
Loan-product check · same deal, 3 products live
Conventional
25% down · 7.5% · 30yr
- Down + closing
- —
- Monthly P&I
- —
- Monthly cashflow
- —
- DSCR
- —
- Eligible?
- —
Personal DTI + credit; lowest rate.
DSCR
20% down · 8.5% · 30yr
- Down + closing
- —
- Monthly P&I
- —
- Monthly cashflow
- —
- DSCR
- —
- Eligible?
- —
No personal income docs; deal must DSCR.
Hard money
10% down · 12.0% · 12mo
- Down + closing
- —
- Monthly P&I
- —
- Monthly cashflow
- —
- DSCR
- —
- Eligible?
- —
Short-term bridge; refi at stabilization.
Listing history 24 events
-
2026-06-17days on market $249,900 Active 27 DOM
-
2026-06-16days on market $249,900 Active 26 DOM
-
2026-06-15days on market $249,900 Active 25 DOM
-
2026-06-13days on market $249,900 Active 23 DOM
-
2026-06-09days on market $249,900 Active 19 DOM
-
2026-06-08days on market $249,900 Active 18 DOM
-
2026-06-07days on market $249,900 Active 17 DOM
-
2026-06-04pricedays on market $249,900 Active 14 DOM
-
2026-06-03days on market $295,900 Active 13 DOM
-
2026-06-02days on market $295,900 Active 12 DOM
-
2026-06-01days on market $295,900 Active 11 DOM
-
2026-05-31days on market $295,900 Active 10 DOM
-
2026-05-21$295,900 Active
-
2014-09-12soldstatus $43,144 261-char remark
Show marketing remark (261 chars)
REO Property. Property Sold AS-IS W/ O Repair, Warranty or Seller Disclosure. The Listing Broker & Seller assume no responsibility & make no guarantees, warranties or representations as to the availability or accuracy of information contained herein
-
2013-03-20$35,700 261-char remark
Show marketing remark (261 chars)
REO Property. Property Sold AS-IS W/ O Repair, Warranty or Seller Disclosure. The Listing Broker & Seller assume no responsibility & make no guarantees, warranties or representations as to the availability or accuracy of information contained herein
-
2013-03-11historical
-
2013-02-07$89,900
-
2004-01-01historical
-
2003-11-18$148,900
-
2003-11-03historical
-
2003-09-02$149,900
-
2003-08-20historical
-
2003-05-27$169,900
-
2002-03-11$89,900
ⓘ Source: listings_history table (triggers on properties + properties_extension) + one-shot
backfill from property_details.listing_events for pre-trigger history.
Tax reassessment forecast IN · Partial reset (capped growth)
- Current annual tax
- $2,735 · $228/mo
- Projected year-2 tax
- $2,735 · $228/mo
- Expected delta
- $0/yr ($0/mo · 0.0%)
ⓘ Screening estimate from a state-policy table — verify with the county assessor before closing.
Climate risk First Street
- Flood 1/10 Low FEMA zone X (unshaded) · 0% chance over 30 yrs
- Wildfire 1/10 Low
- Heat 3/10 Moderate 7 d/yr ≥101°F today · 16 d/yr by 30 yrs out
- Wind 2/10 Low 0% chance of damaging wind over 30 yrs
- Air quality 2/10 Low 2 unhealthy d/yr today · 2 by 30 yrs out
Nearby sold comps map
Loading sold comps map…
Walkable amenities ~0.75 mi
Loading nearby amenities…
Taxation est. · year 1
- Rental income
- $27,060
- − Mortgage interest
- −$13,998
- − Property taxes
- −$2,735
- − Insurance
- −$1,250
- − Repairs & maintenance
- −$2,165
- − Management
- −$2,165
- − Depreciation
- −$7,270
- Taxable loss
- −$2,522
- Est. tax savings @ 24.0%
- +$605
- After-tax cash flow
- $2,272/yr
For passive investors: Depreciation is non-cash, so a rental often shows a tax loss while cash-flowing — sheltering income. Rental losses are passive: they offset passive income freely, and up to $25,000/yr can offset ordinary (W-2) income if you actively participate and your MAGI is under $100k (phasing out to $0 by $150k); unused losses carry forward. On sale, claimed depreciation is recaptured at up to 25%, and gains may owe capital-gains tax (a 1031 exchange can defer both). Figures are a year-1 estimate at your 24.0% rate — not tax advice; consult a CPA.
Schools (NCES district)
- District
- Lake Central School Corporation
- NCES district ID
- 1805450
- Math proficiency
- 45% ▼ -9.00%
- Reading proficiency
- 54% ▼ -11.00%
- Median HH income
- $75,957
- Composite
- 44.82/100
- National rank
- #2736
- State rank
- #41 of 301 in IN
Livability — St. John
No livability data for this city. (Only ~50 U.S. cities are tracked.)
Census & demographics
- Census place
- St. John, IN
- City population
- 18,509
- Population (ZIP)
- 18,509
Population outlook (Lake County) Hauer SSP2
- Today (2025)
- 484,026 people
- By 2030
- 478,091 · -1.2%
- By 2040
- 462,974 · -4.3%
- By 2050
- 449,894 · -7.1%
- By 2075
- 436,169 · -9.9%
- By 2100
- 426,607 · -11.9%
Race, ethnicity, and origin ACS 2023
- Neighborhood character
- Predominantly White (82%)
- Race & ethnicity
- White 82% Hispanic / Latino 9% Two or more races 5% Black 3% Asian 2%
- Hispanic origin (detail)
- Mexican 7% Puerto Rican 1%
- Common ancestry
- Romanian 21% Iranian 6% Lithuanian 2%
- Foreign-born
- 6% · Canada
- Languages at home
- 89% English-only · Spanish 5% Russian/Polish/Slavic 4% Other Indo-European 1%
Political lean MEDSL · Lake
- 2024 margin
- Lean D (+5.6) · D 52.1% · R 46.5% · Other 1.5%
- 2008→2024 swing
- -28.6pp toward R · 2008: 34.3pp · 2024: 5.6pp
- All cycles
- 2024: D+5.6 2020: D+15.1 2016: D+20.6 2012: D+31.0 2008: D+34.3
Not yet ingested
- Civics
- —
Market trends
- HPI YoY
- ▼ -69.86%
- Current HPI
- 224.1176
- Rent YoY
- —
- Metro
- —
- State GDP YoY
- ▲ 2.90%
- F500 in state
- 18
Industry mix (Fortune 500 HQ in IN)
| Industry | F500 HQs | Revenue |
|---|---|---|
| Industrial Machinery | 2 | $37B |
|
||
| Healthcare | 1 | $177B |
|
||
| Pharmaceuticals | 1 | $45B |
|
||
| Metals / Steel | 1 | $18B |
|
||
| Agriculture | 1 | $17B |
|
||
| Packaging | 1 | $12B |
|
||
Price history
+229.1% since first listed12 events — show timeline
- 2026-05-21 Listed $295,900 NIRA MLS as Distributed by MLS Grid
- 2014-09-12 Sold (MLS) $43,144 NIRA MLS as Distributed by MLS Grid
- 2013-03-20 Listed $35,700 NIRA MLS as Distributed by MLS Grid
- 2013-03-11 Listing Removed — NIRA MLS as Distributed by MLS Grid
- 2013-02-07 Listed $89,900 NIRA MLS as Distributed by MLS Grid
- 2004-01-01 Listing Removed — NIRA MLS as Distributed by MLS Grid
- 2003-11-18 Listed $148,900 NIRA MLS as Distributed by MLS Grid
- 2003-11-03 Listing Removed — NIRA MLS as Distributed by MLS Grid
- 2003-09-02 Listed $149,900 NIRA MLS as Distributed by MLS Grid
- 2003-08-20 Listing Removed — NIRA MLS as Distributed by MLS Grid
- 2003-05-27 Listed $169,900 NIRA MLS as Distributed by MLS Grid
- 2002-03-11 Listed $89,900 NIRA MLS as Distributed by MLS Grid
Property tax history
-1.2%/yrLatest (2024): $2,735 · +14.3% YoY. Source: county tax records.
Cash-flow waterfall
monthlySold comps — $/sqft
last 12 mo · ≤1 miLoading sold comps…