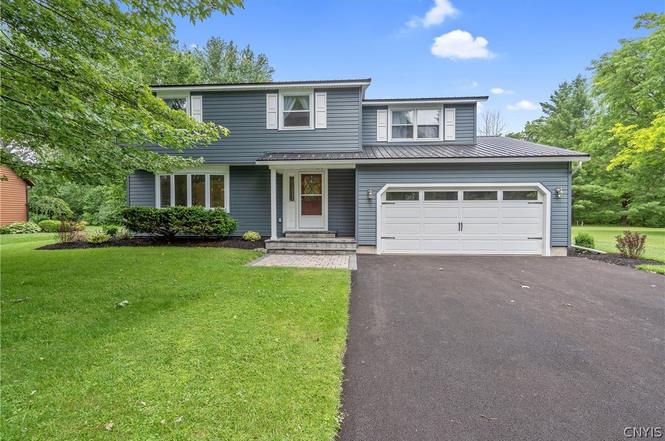
8069 Princess Path · Liverpool, NY
Flood risk 1/10 · Minimal
- FEMA flood zone
- X (unshaded)
- Chance of flooding over 30 yrs
- 0.0%
- Est. flood insurance / yr
- $473 – $860
Fire risk 2/10 · Minimal
- Est. fire insurance / yr
- $691 – $1,283
Heat risk 3/10 · Minor
- Hot days now (above 95°F)
- 7 days/yr
- Hot days in 30 yrs
- 16 days/yr
Wind risk 1/10 · Minimal
- Chance of severe wind over 30 yrs
- 0.0%
Air-quality risk 2/10 · Minimal
- Unhealthy air days now
- 1 days/yr
- Unhealthy air days in 30 yrs
- 1 days/yr
Risk factors via First Street. Map © Google.
Why this score? — see what drove the D grade
The composite is a weighted blend of 9 inputs, each scored 0–100. Each bar is that input's sub-score; the figure is the points it added to the 100-point composite (weight × sub-score).
- ARV discount +11.1/15.0
- Cash flow +10.7/30.0
- Schools +4.3/10.0
- Livability +4.3/5.0
- 1% rule +3.6/10.0
- DSCR +3.1/10.0
- Rent growth +2.5/5.0
- Condition / age +2.5/5.0
- Appreciation +0.0/10.0
$396,000
🖨 Deal sheet 📄 Offer letter ✓ Due diligence
Listing remarks MLS
This spacious home has an open floor plan on the first floor. Large 4 bedrooms, 2 and a half baths a large double shower in the master bath. Open French doors and enter a lovely great room, with 4 sky lights, a beautiful stone wall with granite selves behind the wood stove, Very private back yard, with above ground pool, and deck. Large family room right off eat in kitchen. Formal dinning with beautiful built in corner cabinet. Large formal living room with bay window. A must see! Call listing agent to see today!!!
Key facts
- New 6 panel doors
- New siding
- Pristine landscaping
Tags
Property features AI
Finance
- Other: Lot is rectangular, residential, approximately 0.26 acres (dimensions ~75 x 153); City street frontage
Exterior
- Parking: Attached 2-car garage with garage door opener
- Utilities: Public water connected; Sewer connected; Electricity connected (circuit breakers); High-speed internet available; Cable available
- Home design: Two-story house; Existing construction; Facing direction not specified; Entry level not specified; Property type not specified
- Construction: Vinyl siding; Copper plumbing; Metal roof; Block foundation; Built previously (existing)
- Exterior features: Blacktop driveway; Fully fenced yard; Open patio; Porch; Shed(s) / storage
Interior
- Kitchen: Dishwasher; Electric cooktop; Electric oven; Electric range; Microwave; Refrigerator; Disposal; Eat-in kitchen
- Bedrooms: Bedrooms info not specified
- Flooring: Hardwood; Carpet; Ceramic tile; Luxury vinyl; Varied flooring
- Bathrooms: 2 full bathrooms; 1 half bathroom; 1 main-level bathroom
- Heating & cooling: Gas forced-air heating; Central air conditioning
- Interior features: Ceiling fans; Cathedral ceilings; Separate/formal dining room; Entrance foyer; Eat-in kitchen; Separate/formal living room; Sliding glass doors; Skylights; Primary bedroom with bath
- Laundry & utility: Washer; Dryer; Laundry located in basement
Neighborhood map
What this means for you Summary
Snapshot
- This is a 4-bed/2.5-bath single-family listed at $396k.
Deal economics
- At list price, monthly cash flow is $-187 ($-2k/yr) — negative.
- To cash-flow at today's rent, offer at most $363k (8.4% below list).
- To meet the 1% rule (rent ≥ 1% of price), the offer needs to be $339k (14.4% below list).
- Recommended offer: $339k (14.4% below list) — sets the bar for 1% rule.
Location & tenants
- Location reads 86/100 on livability (#16 in NY, #363 nationally) — a professional / high-income tenant draw. Strengths: commute A+, housing A+, health & safety A+.
- Liverpool Central School District (suburban): math 49% / reading 49% proficiency, ranked #381 of 590 in NY (top 65%) — families likely to look elsewhere, expect single-tenant / working-renter base with shorter leases.
- Market conditions: 96 active listings in the ZIP; 2 comparable units currently listed for rent nearby; solid renter incomes; 616 units permitted in Onondaga County in 2024 (256 in 5+ unit buildings).
- At $3,391/mo this rent would consume 46% of the median local household income ($88k/yr) (locally 733% of renters already pay >50% of income on rent) — very limited rent-growth headroom before tenants either downsize or default.
Forward outlook
- Local home prices are declining (-3.0%/yr); year-one equity from $3k of loan paydown is wiped out by about $12k of value loss. Plan a longer hold.
- Onondaga County population projected to shrink 9% by 2050 — rents likely to lag national; underwrite the cash flow, not the appreciation.
Negotiation context
- Only 2 days on market — expect competitive offers; lowballing is unlikely to land.
- 2 sale attempts since 13y ago with the ask held roughly flat each time — persistent listings suggest the price (not the market) is what's stuck; bring a comps-based counter.
- Current owner paid $170k; list at $396k implies a 133% gain — meaningful room to come down on a strong offer.
Questions for the listing agent
- What do current leases actually rent for vs. the listed asking? Can we see a recent rent roll and the last 12 months of T-12 income?
- Built in 1979 — when were the roof, HVAC, electrical panel, plumbing, and water heater last replaced?
- Is there a deadline driving the sale (1031 exchange, divorce, estate, relocation)? That informs how much negotiation room exists.
- The area grade is low — what's the realistic commute time and amenity access for the typical tenant pool here? Any planned neighborhood developments (good or bad) we should know about?
- What's the average days-on-market for RENTAL listings here right now (not sales)? A rising rental-DOM trend means longer vacancies and softer asking-rent achievability than the comps imply.
- What's the recent tenant-quality profile in this submarket — average credit score on applications, eviction rate, late-payment / NSF rate, and stable-employment percentage? A property-management company in the area should have these aggregated.
- How much new for-sale + rental construction is in the pipeline within 1–3 miles? Heavy new supply typically softens prices + rents 12–24 months out; constrained supply supports both.
Investment metrics
- 1% rule
- 0.86% ✗
- Cap rate
- 5.72%
- Cash-on-cash
- -2.03%
- DSCR
- 0.91
- GRM
- 9.7
CMA / ARV
- ARV (on-the-fly)
- $430,310
- Comps found
- 12
Show comp detail 12 sales within ~0.75 mi
| Address | Dist | Beds/Ba | Sqft | Sold | Price | $/sf | Match |
|---|---|---|---|---|---|---|---|
| 7972 Orion Path | 0.24mi | 3/2.5 (-1) | 2,288 (-2%) | 8mo | $297,970 | $130 | 74 |
| 4316 Tiger Lily Path | 0.28mi | 3/2.5 (-1) | 2,364 (+2%) | 7mo | $584,000 | $247 | 73 |
| 4265 Inverrary Dr | 0.21mi | 3/2.5 (-1) | 2,164 (-7%) | 5mo | $401,000 | $185 | 69 |
| 8013 Ginger Rd | 0.26mi | 4/3.0 | 2,204 (-5%) | 10mo | $430,000 | $195 | 68 |
| 7991 Nutmeg Ln | 0.32mi | 4/2.5 | 2,468 (+6%) | 10mo | $391,000 | $158 | 67 |
| 8055 Princess Path | 0.13mi | 4/2.5 | 2,008 (-14%) | 8mo | $335,000 | $167 | 65 |
| 4302 Cinnamon Path | 0.11mi | 4/2.5 | 1,982 (-15%) | 10mo | $310,000 | $156 | 62 |
| 4262 Cactus Cir | 0.72mi | 4/2.5 | 2,392 (+3%) | 2mo | $401,000 | $168 | 60 |
| 4209 Lucan Rd | 0.35mi | 4/2.5 | 2,047 (-12%) | 5mo | $332,000 | $162 | 60 |
| 4251 Mayfair Cir | 0.52mi | 4/3.5 | 2,501 (+8%) | 4mo | $527,000 | $211 | 56 |
| 8232 Chiffon Path | 0.63mi | 4/3.5 | 2,396 (+3%) | 8mo | $460,000 | $192 | 55 |
| 8187 Trellis Brook Ln | 0.68mi | 3/2.5 (-1) | 2,440 (+5%) | 7mo | $478,375 | $196 | 49 |
Match score weights: distance 35% · size 25% · config 20% · recency 20%. Top-matched comps best support the ARV.
Projected returns pro-forma
-3.0% appreciation · 3.0% rent growth · sell at horizon
- IRR
- -19.6%
- Equity multiple
- 0.31×
- Total profit
- $-75,976
- Equity at exit
- $59,045
- IRR
- -12.3%
- Equity multiple
- 0.27×
- Total profit
- $-81,000
- Equity at exit
- $34,239
Cash invested: $110,880 (down + closing). Projections, not guarantees.
Landlord ↔ Tenant lean methodology
- Overall (STATE)
- 15 Strongly Tenant-Friendly
- State New York
- 15 Strongly Tenant-Friendly · D+10
- County
- — inherits STATE
- City
- — inherits STATE
ZIP-level market 13090
- Active inventory
- 96
- Price-to-rent
- 9.7×
Monthly cashflow live
- Estimated rent
- $3,391 medium interval (Pro) →
- Mortgage (P&I)
- −$2,077
- Tax from tax record
- −$624 /mo · $7,492/yr
- Insurance
- −$165
- HOA
- −$0
- Vacancy / Maint / Mgmt
- −$712
- Net cashflow
- $-187
Break-even live
UW: 25.0% down · 7.5% · 30yr · 1.5% tax · 5.0% vac · 8.0% maint · 8.0% mgmt
Financing live
Cash to close
- Down payment
- $99,000
- Closing costs
- $11,880
- Reserves months
- —
- Total cash needed
- —
Loan-product check · same deal, 3 products live
Conventional
25% down · 7.5% · 30yr
- Down + closing
- —
- Monthly P&I
- —
- Monthly cashflow
- —
- DSCR
- —
- Eligible?
- —
Personal DTI + credit; lowest rate.
DSCR
20% down · 8.5% · 30yr
- Down + closing
- —
- Monthly P&I
- —
- Monthly cashflow
- —
- DSCR
- —
- Eligible?
- —
No personal income docs; deal must DSCR.
Hard money
10% down · 12.0% · 12mo
- Down + closing
- —
- Monthly P&I
- —
- Monthly cashflow
- —
- DSCR
- —
- Eligible?
- —
Short-term bridge; refi at stabilization.
Rent comps 2 comps
| Address | Beds | Baths | Sqft | Rent | $/sqft | DOM | Units | Dist |
|---|---|---|---|---|---|---|---|---|
| 4071 Sesame Path Liverpool, NY | 4.0 | 2.5 | 1928 | $3,200 | $1.66 | 21d | 1 | 0.15mi |
| 8439 Lace Bark Ln Liverpool, NY | 5.0 | 3.0 | 1694 | $2,897 | $1.71 | 13d | 1 | 1.45mi |
Listing history 3 events
-
2026-06-18days on market $396,000 Active 2 DOM
-
2026-06-17remarks 699-char remark
-
2026-06-17$396,000 Active 1 DOM
ⓘ Source: listings_history table (triggers on properties + properties_extension) + one-shot
backfill from property_details.listing_events for pre-trigger history.
Tax reassessment forecast NY · Partial reset (capped growth)
- Current annual tax
- $7,492 · $624/mo
- Projected year-2 tax
- $7,492 · $624/mo
- Expected delta
- $0/yr ($0/mo · -0.0%)
ⓘ Screening estimate from a state-policy table — verify with the county assessor before closing.
Climate risk First Street
- Flood 1/10 Low FEMA zone X (unshaded) · 0% chance over 30 yrs
- Wildfire 2/10 Low
- Heat 3/10 Moderate 7 d/yr ≥95°F today · 16 d/yr by 30 yrs out
- Wind 1/10 Low 0% chance of damaging wind over 30 yrs
- Air quality 2/10 Low 1 unhealthy d/yr today · 1 by 30 yrs out
Nearby sold comps map
Loading sold comps map…
Walkable amenities ~0.75 mi
Loading nearby amenities…
Taxation est. · year 1
- Rental income
- $40,686
- − Mortgage interest
- −$22,182
- − Property taxes
- −$7,492
- − Insurance
- −$1,980
- − Repairs & maintenance
- −$3,255
- − Management
- −$3,255
- − Depreciation
- −$11,520
- Taxable loss
- −$8,997
- Est. tax savings @ 24.0%
- +$2,159
- After-tax cash flow
- $-90/yr
For passive investors: Depreciation is non-cash, so a rental often shows a tax loss while cash-flowing — sheltering income. Rental losses are passive: they offset passive income freely, and up to $25,000/yr can offset ordinary (W-2) income if you actively participate and your MAGI is under $100k (phasing out to $0 by $150k); unused losses carry forward. On sale, claimed depreciation is recaptured at up to 25%, and gains may owe capital-gains tax (a 1031 exchange can defer both). Figures are a year-1 estimate at your 24.0% rate — not tax advice; consult a CPA.
Schools (NCES district)
- District
- Liverpool Central School District
- NCES district ID
- 3617520
- Math proficiency
- 49% ▼ -6.00%
- Reading proficiency
- 49% ▲ 1.00%
- Median HH income
- $59,134
- Composite
- 42.84/100
- National rank
- #3134
- State rank
- #381 of 590 in NY
Livability — Liverpool
- Score
- 86/100
- State rank
- #16
- US rank
- #363
Category grades
Schools grade is shown separately in the Schools card above.
Census & demographics
- County
- Onondaga County · 247,257 people
- City population
- 29,004
- Metro
- Syracuse, NY
- Population (ZIP)
- 29,004
- Household income
- $88,492
- Rent vs Own
- Severe rent burden
- 733.0
Population outlook (Onondaga County) Hauer SSP2
- Today (2025)
- 467,894 people
- By 2030
- 463,381 · -1.0%
- By 2040
- 447,697 · -4.3%
- By 2050
- 426,399 · -8.9%
- By 2075
- 373,661 · -20.1%
- By 2100
- 307,967 · -34.2%
Race, ethnicity, and origin ACS 2023
- Neighborhood character
- Predominantly White (79%)
- Race & ethnicity
- White 79% Two or more races 9% Hispanic / Latino 7% Black 6% Asian 3%
- Hispanic origin (detail)
- Mexican 1% Puerto Rican 4%
- Common ancestry
- Romanian 7% Lithuanian 4% Italian 2%
- Foreign-born
- 6% · Canada, China, South Korea
- Languages at home
- 93% English-only · Other Indo-European 2% Spanish 1% Russian/Polish/Slavic 1%
Political lean MEDSL · Onondaga
- 2024 margin
- D (+17.3) · D 58.6% · R 41.4%
- 2008→2024 swing
- -3.0pp toward R · 2008: 20.3pp · 2024: 17.3pp
- All cycles
- 2024: D+17.3 2020: D+20.6 2016: D+12.8 2012: D+21.1 2008: D+20.3
Not yet ingested
- Civics
- —
Market trends
- HPI YoY
- ▼ -228.53%
- Current HPI
- 320.4989
- Rent YoY
- —
- Metro
- Syracuse, NY
- State GDP YoY
- ▲ 2.60%
- F500 in state
- 92
Industry mix (Fortune 500 HQ in NY)
| Industry | F500 HQs | Revenue |
|---|---|---|
| Financial Services | 10 | $950B |
|
||
| Consumer Goods | 9 | $162B |
|
||
| Insurance | 4 | $225B |
|
||
| Telecommunications | 2 | $144B |
|
||
| Pharmaceuticals | 2 | $112B |
|
||
| Media / Entertainment | 2 | $69B |
|
||
Price history
+126.5% since first listed5 events — show timeline
- 2026-06-16 Listed $396,000 CNYIS
- 2013-11-07 Sold (Public Records) $170,000 Public Records
- 2013-11-07 Listing Removed — CNYIS
- 2013-11-06 Sold (MLS) $170,000 CNYIS
- 2013-07-27 Listed $174,800 CNYIS
Property tax history
+2.9%/yrLatest (2025): $7,492 · +5.4% YoY. Source: county tax records.
Cash-flow waterfall
monthlySold comps — $/sqft
last 12 mo · ≤1 miLoading sold comps…