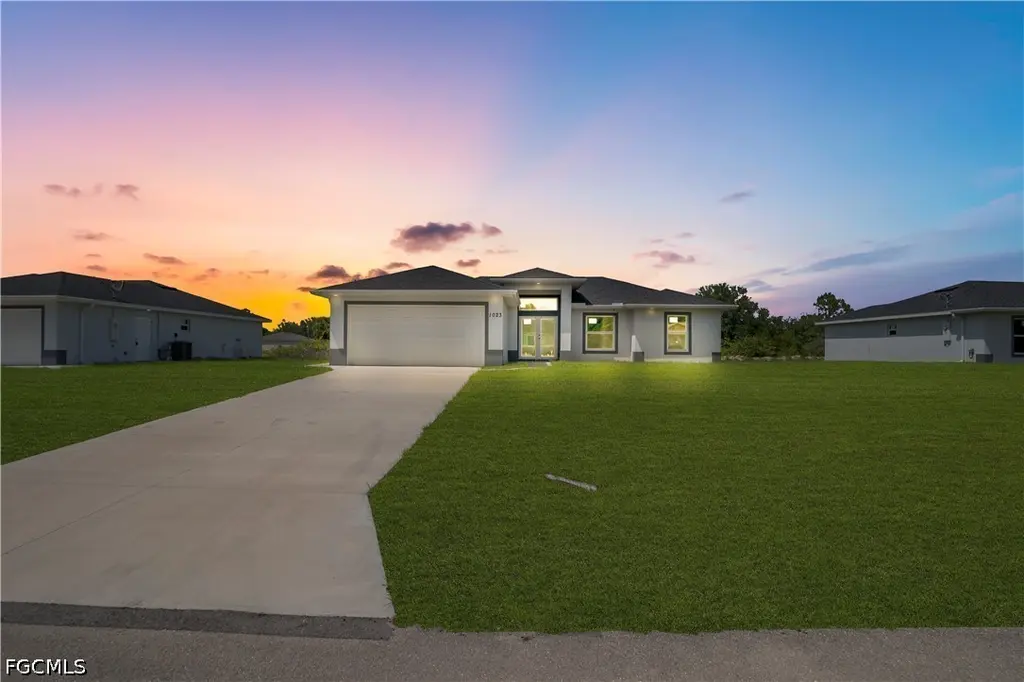
1023 Pilgrim St E · Lehigh Acres, FL
Flood risk No data
- FEMA flood zone
- —
- Chance of flooding over 30 yrs
- —
- Est. flood insurance / yr
- —
Fire risk No data
- Est. fire insurance / yr
- —
Heat risk No data
- Hot days now (above threshold)
- —
- Hot days in 30 yrs
- —
Wind risk No data
- Chance of severe wind over 30 yrs
- —
Air-quality risk No data
- Unhealthy air days now
- —
- Unhealthy air days in 30 yrs
- —
Risk factors via First Street. Map © Google.
Why this score? — see what drove the D grade
The composite is a weighted blend of 9 inputs, each scored 0–100. Each bar is that input's sub-score; the figure is the points it added to the 100-point composite (weight × sub-score).
- Appreciation +10.0/10.0
- Cash flow +8.2/30.0
- ARV discount +7.5/15.0
- Schools +4.1/10.0
- Livability +3.0/5.0
- Condition / age +2.5/5.0
- DSCR +2.2/10.0
- Rent growth +1.3/5.0
- 1% rule +1.2/10.0
$315,000
🖨 Deal sheet (PDF) 📄 Offer letter ✓ Due diligence
Listing remarks
Your Dream Home in Lehigh Acres Awaits!!!!!!!!!! Discover this stunning 1,390 sq. ft. property that perfectly blends comfort, elegance, and functionality—ideal for families seeking a modern and secure lifestyle. Key Features: Impact-resistant windows and doors for peace of mind Porcelain tile flooring. Celling Fans in the Living room and bedrooms. Kitchen and Bathrooms with quartz countertops and stainless-steel appliances Wood cabinets, single vanity in the master bathroom, custom shower and walk-in closet. Coffered ceilings adding style and spaciousness. Extended patio Doble car Garage with extra Side exit door for convenience. A spacious Kitchen-Dining room area ideal for entertain
Key facts
- Quartz countertops
- Custom shower
- Walk in closet
Tags
Property features AI
Finance
- Financial info: Pets allowed
- HOA & community: No association fee
Exterior
- Parking: Attached 2-car garage with garage door opener
- Security: Smoke detector(s)
- Utilities: Cable available; Septic tank; Well water
- Home design: Single-story home; New construction; Faces west
- Construction: Built with block, concrete and stucco; Shingle roof
- Exterior features: Patio and open porch; Security/high-impact doors; Smoke detectors; Rectangular lot; East exposure; Has view
Interior
- Kitchen: Dishwasher; Microwave; Range; Refrigerator
- Bedrooms: Split bedroom layout (bedrooms separated)
- Flooring: Tile floors
- Bathrooms: 2 full bathrooms
- Heating & cooling: Central heating (electric); Central air conditioning (electric); Ceiling fans
- Interior features: Impact glass windows; Coffered ceilings; Living/dining room; Separate shower; Bathtub; Walk-in closets; Split bedroom layout
- Laundry & utility: Washer hookup; Dryer hookup; Inside laundry with laundry tub
Neighborhood map
What this means for you Summary
Snapshot
- This is a 3-bed/2.0-bath land listed at $315k.
Deal economics
- At list price, monthly cash flow is $-299 ($-4k/yr) — negative.
- To cash-flow at today's rent, offer at most $262k (16.8% below list).
- To meet the 1% rule (rent ≥ 1% of price), the offer needs to be $196k (37.7% below list).
- Recommended offer: $196k (37.7% below list) — sets the bar for 1% rule.
Location & tenants
- Location reads 59/100 on livability (#826 in FL) — a working-class tenant base; expect higher turnover. Strengths: cost of living A+, housing A+; Watch: crime C-, employment D+, amenities F.
- Lee (suburban): math 47% / reading 50% proficiency, ranked #42 of 73 in FL (top 58%) — families likely to look elsewhere, expect single-tenant / working-renter base with shorter leases.
- Zoned schools: Veterans Park Academy For The Arts (math 41% / reading 45%, grade F, #1,366 of 2,144 statewide, top 64%, 2,133 students, 36% FRL); Oak Hammock Middle School (math 43% / reading 41%, grade D-, #340 of 571 statewide, top 61%, 1,563 students, 56% FRL); Lehigh Senior High School (math 23% / reading 45%, grade F, #394 of 667 statewide, top 60%, 2,476 students, 57% FRL).
- Market conditions: Rents falling (-4.7%/yr); 2476 active listings in the ZIP; 40 comparable units currently listed for rent nearby; rentals at typical pace (median 22d on market — plan ~3-4 weeks tenant-placement turnaround); 15,411 units permitted in Lee County in 2024 (4,686 in 5+ unit buildings).
- This rent runs 33% of the median local income ($72k/yr) — at the standard rent-burdened threshold; future hikes will face affordability resistance.
Forward outlook
- In year one you build about $34k of equity ($2k loan paydown + $32k appreciation (10.0% local appreciation)).
- Lee County population projected at +44% by 2050 — long-run rental-demand tailwind backs the buy-and-hold thesis.
- By year 2, paydown + projected appreciation supports a ~$54k cash-out refi (75% LTV) — recoverable capital for the next deal without selling this one.
Negotiation context
- Only 9 days on market — expect competitive offers; lowballing is unlikely to land.
- 4 sale attempts with the ask held roughly flat each time — persistent listings suggest the price (not the market) is what's stuck; bring a comps-based counter.
Questions for the listing agent
- What do current leases actually rent for vs. the listed asking? Can we see a recent rent roll and the last 12 months of T-12 income?
- Is there a deadline driving the sale (1031 exchange, divorce, estate, relocation)? That informs how much negotiation room exists.
- Schools are D-rated, which usually means shorter tenancies and higher turnover. Who's the typical renter profile here, and what's been the actual vacancy rate?
- The area grade is low — what's the realistic commute time and amenity access for the typical tenant pool here? Any planned neighborhood developments (good or bad) we should know about?
- What's the average days-on-market for RENTAL listings here right now (not sales)? A rising rental-DOM trend means longer vacancies and softer asking-rent achievability than the comps imply.
- What's the recent tenant-quality profile in this submarket — average credit score on applications, eviction rate, late-payment / NSF rate, and stable-employment percentage? A property-management company in the area should have these aggregated.
- How much new for-sale + rental construction is in the pipeline within 1–3 miles? Heavy new supply typically softens prices + rents 12–24 months out; constrained supply supports both.
Investment metrics
- 1% rule
- 0.62% ✗
- Cap rate
- 5.15%
- Cash-on-cash
- -4.07%
- DSCR
- 0.82
- GRM
- 13.4
CMA / ARV
No comps found within radius.
Projected returns pro-forma
10.0% appreciation · 0.0% rent growth · sell at horizon
- IRR
- 20.7%
- Equity multiple
- 2.66×
- Total profit
- $146,583
- Equity at exit
- $283,777
- IRR
- 18.3%
- Equity multiple
- 5.94×
- Total profit
- $436,011
- Equity at exit
- $611,976
Cash invested: $88,200 (down + closing). Projections, not guarantees.
Landlord ↔ Tenant lean methodology
- Overall (STATE)
- 87 Strongly Landlord-Friendly
- State Florida
- 87 Strongly Landlord-Friendly · R+3
- County
- — inherits STATE
- City
- — inherits STATE
ZIP-level market 33974
- Home prices YoY
- 5.8%
- Rents YoY
- -4.7%
- Active inventory
- 2476
- Price-to-rent
- 13.4×
Monthly cashflow live
- Estimated rent
- $1,962 high interval (Pro) →
- Mortgage (P&I)
- −$1,652
- Tax from tax record
- −$66 /mo · $788/yr
- Insurance
- −$131
- HOA
- −$0
- Vacancy / Maint / Mgmt
- −$412
- Net cashflow
- $-299
Break-even live
Sensitivity live
| Price | -10% $-121 | -5% $-210 | +0% $-299 | +5% $-388 | +10% $-477 |
|---|---|---|---|---|---|
| Rent | -10% $-454 | -5% $-377 | +0% $-299 | +5% $-222 | +10% $-144 |
| Rate | -1.0pp $-141 | -0.5pp $-219 | base $-299 | +0.5pp $-381 | +1.0pp $-464 |
UW: 25.0% down · 7.5% · 30yr · 1.5% tax · 5.0% vac · 8.0% maint · 8.0% mgmt
Financing live
Cash to close
- Down payment
- $78,750
- Closing costs
- $9,450
- Reserves months
- —
- Total cash needed
- —
Loan-product check · same deal, 3 products live
Conventional
25% down · 7.5% · 30yr
- Down + closing
- —
- Monthly P&I
- —
- Monthly cashflow
- —
- DSCR
- —
- Eligible?
- —
Personal DTI + credit; lowest rate.
DSCR
20% down · 8.5% · 30yr
- Down + closing
- —
- Monthly P&I
- —
- Monthly cashflow
- —
- DSCR
- —
- Eligible?
- —
No personal income docs; deal must DSCR.
Hard money
10% down · 12.0% · 12mo
- Down + closing
- —
- Monthly P&I
- —
- Monthly cashflow
- —
- DSCR
- —
- Eligible?
- —
Short-term bridge; refi at stabilization.
Rent comps 40 comps
| Address | Beds | Baths | Sqft | Rent | $/sqft | DOM | Units | Dist |
|---|---|---|---|---|---|---|---|---|
| 538 Cypress Ave S Lehigh Acres, FL | 3.0 | 2.0 | 1055 | $1,699 | $1.61 | 5d | 1 | 0.23mi |
| 538 Flamingo Ave S Lehigh Acres, FL | 3.0 | 2.0 | 1272 | $1,791 | $1.41 | 5d | 1 | 0.30mi |
| 556 Sherwood Ave S Lehigh Acres, FL | 3.0 | 2.0 | 1582 | $2,175 | $1.37 | 25d | 1 | 0.32mi |
| 954 Pilgrim St E Lehigh Acres, FL | 3.0 | 2.0 | 1246 | $1,625 | $1.30 | 4d | 1 | 0.34mi |
| 928 Milwaukee Blvd Lehigh Acres, FL | 4.0 | 2.0 | 1719 | $1,990 | $1.16 | 25d | 1 | 0.51mi |
| 970 Lakeside Dr Lehigh Acres, FL | 3.0 | 2.0 | 1325 | $1,800 | $1.36 | 21d | 1 | 0.60mi |
| 708 Genoa Ave S Lehigh Acres, FL | 3.0 | 2.0 | 1055 | $1,650 | $1.56 | 5d | 1 | 0.61mi |
| 940 Sterling St E Lehigh Acres, FL | 4.0 | 2.0 | 1389 | $1,750 | $1.26 | 5d | 1 | 0.62mi |
| 1018 Kent St E Lehigh Acres, FL | 3.0 | 2.0 | 1600 | $2,000 | $1.25 | 18d | 1 | 0.63mi |
| 1144 Essex St E Lehigh Acres, FL | 3.0 | 2.0 | 1464 | $1,650 | $1.13 | 21d | 1 | 0.66mi |
| 908 Winters St E Lehigh Acres, FL | 3.0 | 2.0 | 1639 | $2,200 | $1.34 | 12d | 1 | 0.66mi |
| 730 Holmes Ave Unit 728 Lehigh Acres, FL | 3.0 | 2.0 | 1080 | $1,500 | $1.39 | 13d | 1 | 0.71mi |
| 635 Hawthorne Ave S Lehigh Acres, FL | 3.0 | 2.0 | 1029 | $1,300 | $1.26 | 23d | 1 | 0.78mi |
| 635 Hawthorne Ave S Lehigh Acres, FL | 3.0 | 2.0 | 1029 | $1,300 | $1.26 | 25d | 1 | 0.78mi |
| 541 Hawthorne Ave S Lehigh Acres, FL | 3.0 | 2.0 | 1634 | $1,921 | $1.18 | 5d | 1 | 0.79mi |
| 886 Milwaukee Blvd Lehigh Acres, FL | 3.0 | 2.0 | 1205 | $1,900 | $1.58 | 25d | 1 | 0.79mi |
| 1147 Antonio St E Lehigh Acres, FL | 3.0 | 2.0 | 1713 | $2,300 | $1.34 | 3d | 1 | 0.80mi |
| 637 Montclair Ave S Lehigh Acres, FL | 3.0 | 2.0 | 1497 | $1,660 | $1.11 | 25d | 1 | 0.81mi |
| 442 Genoa Ave S Lehigh Acres, FL | 4.0 | 2.0 | 1365 | $1,750 | $1.28 | 5d | 1 | 0.82mi |
| 756 Holmes Ave Lehigh Acres, FL | 3.0 | 2.0 | 1100 | $1,450 | $1.32 | 12d | 1 | 0.84mi |
| 761 Kirkman Ave S Lehigh Acres, FL | 3.0 | 2.0 | 1188 | $1,900 | $1.60 | 25d | 1 | 0.86mi |
| 874 Apartment St Lehigh Acres, FL | 3.0 | 2.0 | 1200 | $1,750 | $1.46 | 25d | 1 | 0.87mi |
| 1224 Bayou St Lehigh Acres, FL | 3.0 | 2.0 | 1272 | $1,750 | $1.38 | 25d | 1 | 0.88mi |
| 862 Charles Sise St E Lehigh Acres, FL | 3.0 | 2.0 | 1582 | $2,664 | $1.68 | 25d | 1 | 0.89mi |
| 459 Lackey Ave S Lehigh Acres, FL | 4.0 | 2.0 | 1833 | $1,825 | $1.00 | 4d | 1 | 0.93mi |
| 1248 Hillcrest St E Lehigh Acres, FL | 3.0 | 2.0 | 1055 | $1,650 | $1.56 | 5d | 1 | 1.03mi |
| 462 Lampion Ave S Unit Main house Lehigh Acres, FL | 3.0 | 2.0 | 1089 | $1,600 | $1.47 | 5d | 1 | 1.04mi |
| 763 Puccini Ave S Lehigh Acres, FL | 3.0 | 2.0 | 1055 | $1,699 | $1.61 | 5d | 1 | 1.05mi |
| 1256 Milwaukee Blvd Lehigh Acres, FL | 3.0 | 2.0 | 1084 | $1,800 | $1.66 | 25d | 1 | 1.06mi |
| 947 Grant Blvd Lehigh Acres, FL | 4.0 | 2.0 | 1650 | $2,145 | $1.30 | 25d | 1 | 1.06mi |
| 459 Lockport Ave S Lehigh Acres, FL | 3.0 | 2.0 | 1650 | $2,000 | $1.21 | 25d | 1 | 1.06mi |
| 1260 Milwaukee Blvd Unit 1262 Lehigh Acres, FL | 3.0 | 2.0 | 1084 | $1,750 | $1.61 | 25d | 1 | 1.07mi |
| 708 Godwid Ave S Lehigh Acres, FL | 3.0 | 2.0 | 1758 | $2,150 | $1.22 | 23d | 1 | 1.08mi |
| 710 Godwid Ave S Lehigh Acres, FL | 3.0 | 2.0 | 1758 | $2,150 | $1.22 | 5d | 1 | 1.09mi |
| 710 Godwid Ave S Lehigh Acres, FL | 3.0 | 2.0 | 1758 | $2,150 | $1.22 | 5d | 1 | 1.09mi |
| 710 Godwid Ave S Lehigh Acres, FL | 3.0 | 2.0 | 1758 | $2,150 | $1.22 | 23d | 1 | 1.09mi |
| 1245 Amherst St E Lehigh Acres, FL | 3.0 | 2.0 | 1149 | $1,620 | $1.41 | 16d | 1 | 1.14mi |
| 930 Ainsworth St W Lehigh Acres, FL | 3.0 | 2.0 | 1165 | $1,395 | $1.20 | 18d | 1 | 1.15mi |
| 819 Eisenhower Blvd Unit 819 Lehigh Acres, FL | 3.0 | 2.0 | 1390 | $1,650 | $1.19 | 25d | 1 | 1.16mi |
| 382 McArthur Blvd Lehigh Acres, FL | 3.0 | 2.0 | 1055 | $2,200 | $2.09 | 25d | 1 | 1.17mi |
Listing history 24 events
-
2026-06-22days on market $315,000 Active 9 DOM
-
2026-06-18days on market $315,000 Active 6 DOM
-
2026-06-17days on market $315,000 Active 5 DOM
-
2026-06-16days on market $315,000 Active 4 DOM
-
2026-06-15days on market $315,000 Active 3 DOM
-
2026-06-13days on market $315,000 Active 1 DOM
-
2026-06-10days on market $315,000 Active 5 DOM
-
2026-06-09days on market $315,000 Active 4 DOM
-
2026-06-08days on market $315,000 Active 3 DOM
-
2026-06-07days on market $315,000 Active 2 DOM
-
2026-06-03days on market $315,000 Active 22 DOM
-
2026-06-02days on market $315,000 Active 21 DOM
-
2026-06-01days on market $315,000 Active 20 DOM
-
2026-05-31days on market $315,000 Active 19 DOM
-
2026-05-12$315,000 Active
-
2026-03-15historical
-
2026-01-08$314,999 Active
-
2026-01-05historical
-
2025-12-26price $314,999
-
2025-09-17$329,900 Active
-
2025-08-31historical
-
2025-07-23price $335,000
-
2025-06-25price $339,000
-
2025-05-24$339,900 Active
ⓘ Source: listings_history table (triggers on properties + properties_extension) + one-shot
backfill from property_details.listing_events for pre-trigger history.
Tax reassessment forecast FL · Resets to sale price
- Current annual tax
- $788 · $66/mo
- Projected year-2 tax
- $2,614 · $218/mo
- Expected delta
- +$1,827/yr (+$152/mo · 231.8%)
ⓘ Screening estimate from a state-policy table — verify with the county assessor before closing.
Nearby sold comps map
Loading sold comps map…
Walkable amenities ~0.75 mi
Loading nearby amenities…
Taxation est. · year 1
- Rental income
- $23,539
- − Mortgage interest
- −$17,645
- − Property taxes
- −$788
- − Insurance
- −$1,575
- − Repairs & maintenance
- −$1,883
- − Management
- −$1,883
- − Depreciation
- −$9,164
- Taxable loss
- −$9,399
- Est. tax savings @ 24.0%
- +$2,256
- After-tax cash flow
- $-1,334/yr
For passive investors: Depreciation is non-cash, so a rental often shows a tax loss while cash-flowing — sheltering income. Rental losses are passive: they offset passive income freely, and up to $25,000/yr can offset ordinary (W-2) income if you actively participate and your MAGI is under $100k (phasing out to $0 by $150k); unused losses carry forward. On sale, claimed depreciation is recaptured at up to 25%, and gains may owe capital-gains tax (a 1031 exchange can defer both). Figures are a year-1 estimate at your 24.0% rate — not tax advice; consult a CPA.
Schools (NCES district)
- District
- Lee
- NCES district ID
- 1201080
- Math proficiency
- 47% ▼ -11.00%
- Reading proficiency
- 50% ▼ -4.00%
- Median HH income
- $49,518
- Composite
- 41.49/100
- National rank
- #3458
- State rank
- #42 of 73 in FL
Livability — Lehigh Acres
- Score
- 59/100
- State rank
- #826
- US rank
- #20055
Category grades
Schools grade is shown separately in the Schools card above.
Census & demographics
- Census place
- Lehigh Acres, FL
- County
- Lee County · 788,662 people
- City population
- 130,638
- Metro
- Cape Coral-Fort Myers, FL
- Population (ZIP)
- 19,927
- Household income
- $72,192
- Rent vs Own
- Severe rent burden
- 434.0
Population outlook (Lee County) Hauer SSP2
- Today (2025)
- 871,946 people
- By 2030
- 955,468 · +9.6%
- By 2040
- 1,113,587 · +27.7%
- By 2050
- 1,256,891 · +44.1%
- By 2075
- 1,560,270 · +78.9%
- By 2100
- 1,726,848 · +98.0%
Race, ethnicity, and origin ACS 2023
- Neighborhood character
- Diverse neighborhood (Simpson 0.64)
- Race & ethnicity
- Hispanic / Latino 52% Two or more races 31% White 26% Black 18%
- Hispanic origin (detail)
- Mexican 12% Puerto Rican 7% Cuban 20% Dominican 4%
- Common ancestry
- Hispanic 7% Italian 1% Portuguese 1%
- Foreign-born
- 32% · Canada, Jamaica
- Languages at home
- 48% English-only · Spanish 43% French/Haitian/Cajun 7% Other Indo-European 1%
Political lean MEDSL · Lee
- 2024 margin
- Strong R (+28.4) · D 35.5% · R 63.9%
- 2008→2024 swing
- -18.0pp toward R · 2008: -10.4pp · 2024: -28.4pp
- All cycles
- 2024: R+28.4 2020: R+19.2 2016: R+20.4 2012: R+16.6 2008: R+10.4
Not yet ingested
- Civics
- —
Market trends
- HPI YoY
- ▲ 16.53%
- Current HPI
- 303.3399
- Rent YoY
- ▼ -4.68%
- Metro
- Cape Coral-Fort Myers, FL
- State GDP YoY
- ▲ 3.28%
- F500 in state
- 36
Industry mix (Fortune 500 HQ in FL)
| Industry | F500 HQs | Revenue |
|---|---|---|
| Industrial Technology | 2 | $29B |
|
||
| Insurance | 2 | $17B |
|
||
| Retail | 1 | $60B |
|
||
| Technology Distribution | 1 | $58B |
|
||
| Homebuilding | 1 | $35B |
|
||
| Technology Manufacturing | 1 | $35B |
|
||
Price history
-7.3% since first listed10 events — show timeline
- 2026-05-12 Listed $315,000 FORTMLS
- 2026-03-15 Listing Removed — NAPLESMLS
- 2026-01-08 Listed $314,999 NAPLESMLS
- 2026-01-05 Listing Removed — NAPLESMLS
- 2025-12-26 Price Changed $314,999 NAPLESMLS
- 2025-09-17 Listed $329,900 NAPLESMLS
- 2025-08-31 Listing Removed — MARMLS
- 2025-07-23 Price Changed $335,000 MARMLS
- 2025-06-25 Price Changed $339,000 MARMLS
- 2025-05-24 Listed $339,900 MARMLS
Property tax history
+108.6%/yrLatest (2025): $788 · +108.6% YoY. Source: county tax records.
Cash-flow waterfall
monthlySold comps — $/sqft
last 12 mo · ≤1 miLoading sold comps…