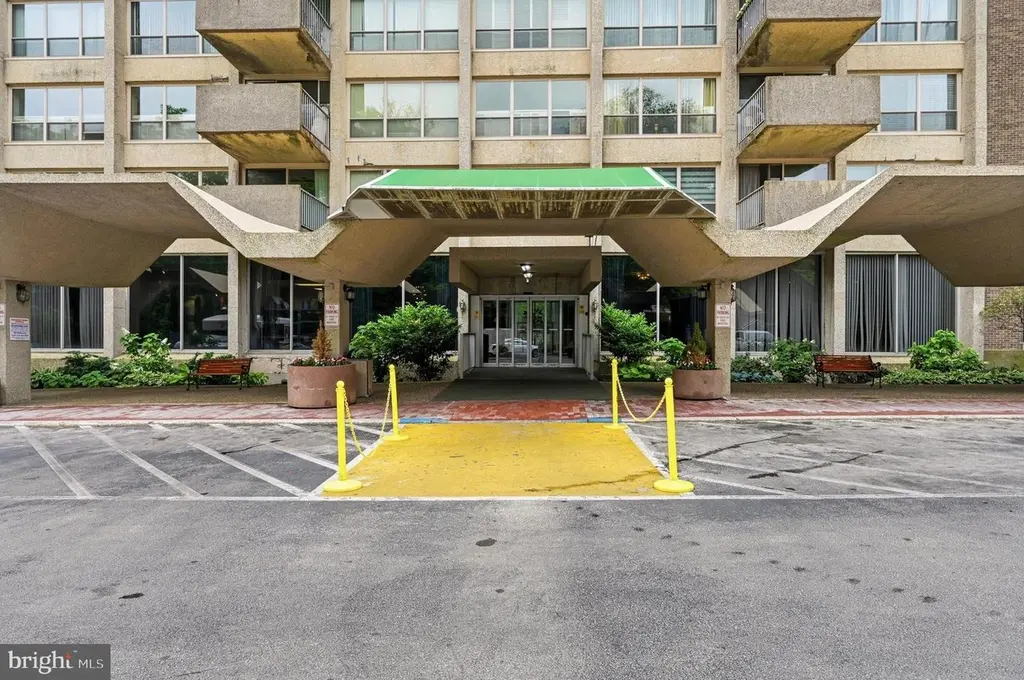
1001 City Ave Unit E-307 · Lower Merion, PA
Flood risk 10/10 · Severe
- FEMA flood zone
- X (unshaded)
- Chance of flooding over 30 yrs
- 0.99%
- Est. flood insurance / yr
- $507 – $1,088
Fire risk 1/10 · Minimal
- Est. fire insurance / yr
- $511 – $949
Heat risk 6/10 · Moderate
- Hot days now (above 103°F)
- 7 days/yr
- Hot days in 30 yrs
- 15 days/yr
Wind risk 6/10 · Moderate
- Chance of severe wind over 30 yrs
- 27.0%
Air-quality risk 4/10 · Minor
- Unhealthy air days now
- 3 days/yr
- Unhealthy air days in 30 yrs
- 6 days/yr
Risk factors via First Street. Map © Google.
Why this score? — see what drove the B- grade
The composite is a weighted blend of 9 inputs, each scored 0–100. Each bar is that input's sub-score; the figure is the points it added to the 100-point composite (weight × sub-score).
- Cash flow +28.1/30.0
- 1% rule +10.0/10.0
- DSCR +10.0/10.0
- ARV discount +7.5/15.0
- Schools +7.3/10.0
- Livability +2.5/5.0
- Condition / age +2.2/5.0
- Rent growth +0.7/5.0
- Appreciation +0.0/10.0
$85,000
🖨 Deal sheet 📄 Offer letter ✓ Due diligence
Listing remarks
This one bedroom two bathroom condominium is priced to sell. A great opportunity make it your own. Great for when guests visit they have their own bathroom. Just add some new flooring, paint and update your kitchen and bathrooms. A wonderful space to call home.
Key facts
- $927 HOA
- Community pool
- Built 1962
Property features AI
Finance
- Other: Property manager present
- Financial info: One-time other fee of $786.24; Ground rent paid annually
- HOA & community: Monthly condo fee of $927; Association recreation fee: $170; Professional on-site management; HOA fees cover air conditioning, electricity, exterior building maintenance, common area maintenance, custodial services, lawn care front and rear, sewer, snow removal, trash, water and bus service; Community amenities include indoor and outdoor pools, elevator, gated community, library, meeting room, tennis courts, playground, transportation service
Exterior
- Parking: Parking lot
- Security: Security gate; On-site concierge; Building security
- Utilities: Public water; Public sewer; Cable TV/internet; Electric hot water
- Home design: Condominium; Building name: Green Hill
- Construction: Brick construction; Above grade and below grade structures
- Exterior features: Community pool; Level entry with ramp access; No tidal water
Interior
- Kitchen: Built-in range; Dishwasher; Garbage disposal; Refrigerator
- Bedrooms: One bedroom on the main level
- Bathrooms: Two full bathrooms on the main level; Two full bathrooms total
- Heating & cooling: Central heating; Natural gas heat; Central air conditioning (electric)
- Interior features: Breakfast area; Elevator; Galley kitchen layout; Full basement
- Laundry & utility: Washer; Dryer
Neighborhood map
What this means for you Summary
Snapshot
- This is a 1-bed/2.0-bath condo listed at $85k. Condition is rated fair.
Deal economics
- At list price, monthly cash flow is $201 ($2k/yr) — positive.
- The deal already cash-flows at list — no discount required.
- Meets the 1% rule at list price ($2k rent vs $85k).
Location & tenants
- Location reads: area grade B — affects rentability + tenant quality, not the cash-flow math above.
- Lower Merion SD (suburban): math 74% / reading 84% proficiency, ranked #3 of 539 in PA (top 1%) — strong family-tenant draw, lease renewals of 3-5y typical; only 7% free/reduced lunch — higher-income household profile.
- Market conditions: Rents falling (-7.2%/yr); 69 active listings in the ZIP; 18 comparable units currently listed for rent nearby; rentals lingering (median 44d on market — plan ~5-8 weeks vacancy on turnover, expect pricing pressure); 50% of comp listings sitting > 30 days — soft ceiling on asking rent; high-income renter base; 1,936 units permitted in Montgomery County in 2024 (530 in 5+ unit buildings).
- This rent is only 15% of the median local income ($186k/yr) — well below the 30% rent-burden line; pricing power to push rent on renewal without tenant pushback.
Forward outlook
- Local home prices are declining (-3.0%/yr); year-one equity from $588 of loan paydown is wiped out by about $3k of value loss. Plan a longer hold.
- Montgomery County population projected at +5% by 2050 — modest demand growth; plan on rents tracking national, not racing it.
Negotiation context
- Only 7 days on market — expect competitive offers; lowballing is unlikely to land.
Risks & watch-outs
- Watch-outs: flood insurance adds $66/mo; HOA is 41% of rent.
- Climate carrying-cost: severe flood risk; major wind risk, 27% chance of damaging wind over 30y; extreme-heat days projected 7→15/yr by 2055 (HVAC capex compounding) — expect insurance premiums to compound above CPI over the hold.
Questions for the listing agent
- Have any recent inspections been done? Can we get a copy of the seller's disclosures and any deferred-maintenance estimates?
- Built in 1962 — when were the roof, HVAC, electrical panel, plumbing, and water heater last replaced?
- What's the actual annual flood-insurance premium (NFIP or private), and is the property in a SFHA with mandatory coverage?
- What does the HOA fee cover, when was the last increase, and are there any pending special assessments or reserve-fund shortfalls?
- Any open or pending special assessments — roof, HVAC, plumbing, elevator, façade? What's the per-unit balance and payoff schedule, and is the seller paying it off at close or rolling it to the buyer?
- Is there a deadline driving the sale (1031 exchange, divorce, estate, relocation)? That informs how much negotiation room exists.
- What's the average days-on-market for RENTAL listings here right now (not sales)? A rising rental-DOM trend means longer vacancies and softer asking-rent achievability than the comps imply.
- What's the recent tenant-quality profile in this submarket — average credit score on applications, eviction rate, late-payment / NSF rate, and stable-employment percentage? A property-management company in the area should have these aggregated.
- How much new apartment / multifamily construction is in the pipeline within 1–3 miles? Heavy new supply (>2% of stock underway) typically softens rents 12–24 months out; light construction supports rent growth.
Investment metrics
- 1% rule
- 2.65% ✓
- Cap rate
- 10.07%
- Cash-on-cash
- 13.51%
- DSCR
- 1.60
- GRM
- 3.1
CMA / ARV
No comps found within radius.
Projected returns pro-forma
-3.0% appreciation · 0.0% rent growth · sell at horizon
- IRR
- -8.5%
- Equity multiple
- 0.71×
- Total profit
- $-6,911
- Equity at exit
- $12,674
- IRR
- -13.7%
- Equity multiple
- 0.48×
- Total profit
- $-12,431
- Equity at exit
- $7,349
Cash invested: $23,800 (down + closing). Projections, not guarantees.
Landlord ↔ Tenant lean methodology
- Overall (STATE)
- 62 Landlord-Friendly
- State Pennsylvania
- 62 Landlord-Friendly · EVEN
- County
- — inherits STATE
- City
- — inherits STATE
ZIP-level market 19096
- Rents YoY
- -7.2%
- Active inventory
- 69
- Price-to-rent
- 3.1×
Monthly cashflow live
- Estimated rent
- $2,256 high interval (Pro) →
- Mortgage (P&I)
- −$446
- Tax est. 1.5%
- −$106 /mo · $1,275/yr
- Insurance
- −$35
- Flood insurance flood zone
- −$66 /mo · $798/yr
- HOA
- −$927
- Vacancy / Maint / Mgmt
- −$474
- Net cashflow
- $201
Break-even live
UW: 25.0% down · 7.5% · 30yr · 1.5% tax · 5.0% vac · 8.0% maint · 8.0% mgmt
Financing live
Cash to close
- Down payment
- $21,250
- Closing costs
- $2,550
- Reserves months
- —
- Total cash needed
- —
Loan-product check · same deal, 3 products live
Conventional
25% down · 7.5% · 30yr
- Down + closing
- —
- Monthly P&I
- —
- Monthly cashflow
- —
- DSCR
- —
- Eligible?
- —
Personal DTI + credit; lowest rate.
DSCR
20% down · 8.5% · 30yr
- Down + closing
- —
- Monthly P&I
- —
- Monthly cashflow
- —
- DSCR
- —
- Eligible?
- —
No personal income docs; deal must DSCR.
Hard money
10% down · 12.0% · 12mo
- Down + closing
- —
- Monthly P&I
- —
- Monthly cashflow
- —
- DSCR
- —
- Eligible?
- —
Short-term bridge; refi at stabilization.
Rent comps 18 comps
| Address | Beds | Baths | Sqft | Rent | $/sqft | DOM | Units | Dist |
|---|---|---|---|---|---|---|---|---|
| 18 Lancaster Ave Wynnewood, PA | 1.0–3.0 | 1.0–3.0 | 1095 | $1,673 | $1.53 | 1d | 14 | 0.30mi |
| 1 Trent Rd Unit 1C Penn Wynne, PA | 1.0 | 1.0 | 800 | $1,425 | $1.78 | 43d | 1 | 0.81mi |
| 250 E Wynnewood Rd Wynnewood, PA | 1.0–2.0 | 1.0 | 780 | $1,895 | $2.43 | 2d | 1 | 1.23mi |
| 625 E Lancaster Ave Wynnewood, PA | 1.0–2.0 | 1.0–2.0 | 1060 | $1,645 | $1.55 | 5d | 5 | 1.24mi |
| 150 E Wynnewood Rd Wynnewood, PA | 1.0–2.0 | 1.0 | 788 | $1,760 | $2.23 | 2d | 15 | 1.24mi |
| 36 N Narberth Ave Unit 1-B Narberth, PA | 1.0 | 2.0 | 1108 | $3,725 | $3.36 | 43d | 1 | 1.33mi |
| 36 N Narberth Ave Unit 1-D Narberth, PA | 1.0 | 1.0 | 678 | $2,050 | $3.02 | 43d | 1 | 1.33mi |
| 36 N Narberth Ave Unit 2-B Narberth, PA | 2.0 | 2.0 | 1035 | $3,375 | $3.26 | 43d | 1 | 1.33mi |
| 36 N Narberth Ave Unit 2-C Narberth, PA | 2.0 | 2.0 | 1110 | $3,645 | $3.28 | 43d | 1 | 1.33mi |
| 203 Haverford Ave Unit 301 Narberth, PA | 1.0 | 1.5 | 906 | $2,945 | $3.25 | 43d | 1 | 1.34mi |
| 203 Haverford Ave Unit 307 Narberth, PA | 2.0 | 2.0 | 1066 | $3,465 | $3.25 | 43d | 1 | 1.34mi |
| 203 Haverford Ave Unit 308 Narberth, PA | 2.0 | 2.0 | 1043 | $3,390 | $3.25 | 43d | 1 | 1.34mi |
| 258 Haverford Ave Narberth, PA | 1.0 | 1.0 | 750 | $2,195 | $2.93 | 43d | 1 | 1.36mi |
| 280 Haverford Ave Narberth, PA | 2.0 | 1.0 | 985 | $2,515 | $2.55 | 1d | 2 | 1.37mi |
| 325 Penn Rd Wynnewood, PA | 1.0–3.0 | 1.0–2.0 | 1184 | $2,262 | $1.91 | 1d | 18 | 1.39mi |
| 200 N Wynnewood Ave Wynnewood, PA | 1.0–3.0 | 1.0–2.0 | 1467 | $2,000 | $1.36 | 1d | 18 | 1.40mi |
| 114 Forrest Ave Narberth, PA | 2.0 | 1.0–2.5 | 1041 | $3,182 | $3.06 | 1d | 7 | 1.40mi |
| 109 Iona Ave Narberth, PA | 1.0 | 1.0 | 550 | $1,589 | $2.89 | 2d | 1 | 1.48mi |
HOA detail condo
- Monthly dues
- $927 · $11,124/yr
- Assessments
- None detected in remarks — confirm with the listing agent.
Listing history 7 events
-
2026-06-18days on market $85,000 Active 7 DOM
-
2026-06-17days on market $85,000 Active 6 DOM
-
2026-06-16days on market $85,000 Active 5 DOM
-
2026-06-15days on market $85,000 Active 4 DOM
-
2026-06-13days on market $85,000 Active 2 DOM
-
2026-06-13remarks 262-char remark
-
2026-06-13$85,000 Active 1 DOM
ⓘ Source: listings_history table (triggers on properties + properties_extension) + one-shot
backfill from property_details.listing_events for pre-trigger history.
Climate risk First Street
- Flood 10/10 Extreme FEMA zone X (unshaded) · 99% chance over 30 yrs
- Wildfire 1/10 Low
- Heat 6/10 Major 7 d/yr ≥103°F today · 15 d/yr by 30 yrs out
- Wind 6/10 Major 27% chance of damaging wind over 30 yrs
- Air quality 4/10 Moderate 3 unhealthy d/yr today · 6 by 30 yrs out
Nearby sold comps map
Loading sold comps map…
Walkable amenities ~0.75 mi
Loading nearby amenities…
Taxation est. · year 1
- Rental income
- $27,073
- − Mortgage interest
- −$4,761
- − Property taxes
- −$1,275
- − Insurance
- −$1,222
- − Repairs & maintenance
- −$2,166
- − Management
- −$2,166
- − HOA
- −$11,124
- − Depreciation
- −$2,473
- Taxable income
- $1,886
- Est. tax owed @ 24.0%
- −$453
- After-tax cash flow
- $1,965/yr
For passive investors: Depreciation is non-cash, so a rental often shows a tax loss while cash-flowing — sheltering income. Rental losses are passive: they offset passive income freely, and up to $25,000/yr can offset ordinary (W-2) income if you actively participate and your MAGI is under $100k (phasing out to $0 by $150k); unused losses carry forward. On sale, claimed depreciation is recaptured at up to 25%, and gains may owe capital-gains tax (a 1031 exchange can defer both). Figures are a year-1 estimate at your 24.0% rate — not tax advice; consult a CPA.
Condition & rehab AI · 13 photos
This one-bedroom condominium requires moderate renovations, including paint, flooring, and kitchen/bathroom updates, to improve its condition and value.
Repairs flagged
- Major Paint — Significant chipping and fading
- Major Flooring — Worn parquet flooring
- Major Kitchen appliances — Outdated and possibly non-functional
- Major Bathroom fixtures — Worn and outdated
- Moderate Exterior siding — Weathered and aged
Value-add opportunities
- Both Paint and flooring updates — Enhances curb appeal and interior aesthetics
- Both Kitchen and bathroom updates — Improves functionality and modernizes the space
- Both Exterior siding repair — Enhances curb appeal and property value
Renovation cost estimate screening
| Repair item | Severity | Est. cost |
|---|---|---|
| Paint · Significant chipping and fading | Major | $15,000–50,000 |
| Flooring · Worn parquet flooring | Major | $15,000–50,000 |
| Kitchen appliances · Outdated and possibly non-functional | Major | $15,000–50,000 |
| Bathroom fixtures · Worn and outdated | Major | $15,000–50,000 |
| Exterior siding · Weathered and aged | Moderate | $3,000–15,000 |
| Total estimated repair cost · 5 items | $63,000–215,000 |
Value-add ROI direction
- Both Paint and flooring updates — Enhances curb appeal and interior aesthetics ↑
- Both Kitchen and bathroom updates — Improves functionality and modernizes the space ↑
- Both Exterior siding repair — Enhances curb appeal and property value ↑
ⓘ Cost ranges are severity-bucket heuristics (US national rule-of-thumb). Get contractor quotes + a written scope before underwriting a rehab budget.
Schools (NCES district)
- District
- Lower Merion SD
- NCES district ID
- 4214160
- Math proficiency
- 74% ▼ -5.00%
- Reading proficiency
- 84% ▼ -4.00%
- Median HH income
- $113,035
- Composite
- 72.82/100
- National rank
- #194
- State rank
- #3 of 539 in PA
Livability — Lower Merion
No livability data for this city. (Only ~50 U.S. cities are tracked.)
Census & demographics
- Census place
- Penn Wynne, PA
- County
- Montgomery County · 712,331 people
- Metro
- Philadelphia-Camden-Wilmington, PA-NJ-DE-MD
- Population (ZIP)
- 15,249
- Household income
- $186,277
- Rent vs Own
- Severe rent burden
- 114.0
Population outlook (Montgomery County) Hauer SSP2
- Today (2025)
- 856,074 people
- By 2030
- 870,887 · +1.7%
- By 2040
- 891,195 · +4.1%
- By 2050
- 896,417 · +4.7%
- By 2075
- 903,212 · +5.5%
- By 2100
- 843,240 · -1.5%
Race, ethnicity, and origin ACS 2023
- Neighborhood character
- Predominantly White (73%)
- Race & ethnicity
- White 73% Asian 11% Two or more races 9% Hispanic / Latino 5% Black 4%
- Common ancestry
- Scotch-Irish 7% Romanian 6% Italian 3%
- Foreign-born
- 15% · China, Canada, South Korea
- Languages at home
- 80% English-only · Chinese 5% Other Indo-European 3% Spanish 3%
Political lean MEDSL · Montgomery
- 2024 margin
- Strong D (+22.8) · D 60.9% · R 38.1% · Other 1.1%
- 2008→2024 swing
- +2.0pp toward D · 2008: 20.8pp · 2024: 22.8pp
- All cycles
- 2024: D+22.8 2020: D+26.3 2016: D+21.1 2012: D+14.3 2008: D+20.8
Not yet ingested
- Civics
- —
Market trends
- HPI YoY
- ▼ -334.68%
- Current HPI
- 315.5669
- Rent YoY
- ▼ -7.21%
- Metro
- Philadelphia-Camden-Wilmington, PA-NJ-DE-MD
- State GDP YoY
- ▲ 1.68%
- F500 in state
- 34
Industry mix (Fortune 500 HQ in PA)
| Industry | F500 HQs | Revenue |
|---|---|---|
| Healthcare | 2 | $309B |
|
||
| Insurance | 2 | $27B |
|
||
| Telecommunications / Media | 1 | $124B |
|
||
| Industrial Distribution | 1 | $22B |
|
||
| Financial Services | 1 | $20B |
|
||
| Chemicals / Materials | 1 | $18B |
|
||
Price history
1 event — show timeline
- 2026-06-11 Listed $85,000 BRIGHT MLS
Cash-flow waterfall
monthlySold comps — $/sqft
last 12 mo · ≤1 miLoading sold comps…