 🏗️ New Construction
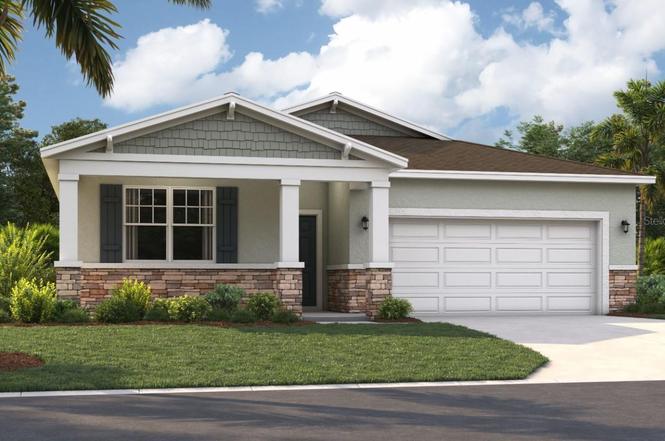
1116 Clay Blvd · Tavares, FL
Flood risk No data
- FEMA flood zone
- —
- Chance of flooding over 30 yrs
- —
- Est. flood insurance / yr
- —
Fire risk No data
- Est. fire insurance / yr
- —
Heat risk No data
- Hot days now (above threshold)
- —
- Hot days in 30 yrs
- —
Wind risk No data
- Chance of severe wind over 30 yrs
- —
Air-quality risk No data
- Unhealthy air days now
- —
- Unhealthy air days in 30 yrs
- —
Risk factors via First Street. Map © Google.
Why this score? — see what drove the D- grade
The composite is a weighted blend of 9 inputs, each scored 0–100. Each bar is that input's sub-score; the figure is the points it added to the 100-point composite (weight × sub-score).
- Cash flow +10.3/30.0
- ARV discount +7.5/15.0
- Schools +4.2/10.0
- Livability +3.8/5.0
- Rent growth +3.5/5.0
- DSCR +2.9/10.0
- Condition / age +2.5/5.0
- 1% rule +1.9/10.0
- Appreciation +0.0/10.0
$354,490
🖨 Deal sheet (PDF) 📄 Offer letter ✓ Due diligence
Listing remarks
One or more photo(s) has been virtually staged. Under Construction. Avalon Park Tavares is a picturesque living, working, and leisure community featuring tree-lined streets, waterways, and small-town charm. Stanley Martin Homes offers affordable living and modern townhome design, blending comfort and style with the timeless appeal of this unique neighborhood. As part of this 155-acre community, homeowners will enjoy commercial and recreational spaces with a focus on the health and well-being of its residents. Nestled in the serene landscape of Lake Hermosa, Avalon Park Tavares fosters a lifestyle where homeowners feel connected to their neighbors and involved in their community. Market Stre
Key facts
- Open concept kitchen
- Dining area
- Acres of parks
Tags
Neighborhood map
What this means for you Summary
Snapshot
- This is a 4-bed/2.0-bath land listed at $354k.
Deal economics
- At list price, monthly cash flow is $-196 ($-2k/yr) — negative.
- To cash-flow at today's rent, offer at most $320k (9.8% below list).
- To meet the 1% rule (rent ≥ 1% of price), the offer needs to be $246k (30.6% below list).
- Recommended offer: $246k (30.6% below list) — sets the bar for 1% rule.
- Cap rate 5.6% vs local median 4.5% in Tavares — meaningfully above typical; check what's discounted (condition, days-on-market, listing class) to confirm the premium yield is real.
Location & tenants
- Location reads 76/100 on livability (#220 in FL, #3,464 nationally) — a middle-class / working-renter tenant base. Strengths: crime A+, cost of living A+, housing A+; Watch: employment D, amenities F, commute F.
- Lake (suburban): math 49% / reading 50% proficiency, ranked #37 of 73 in FL (top 51%) — families likely to look elsewhere, expect single-tenant / working-renter base with shorter leases.
- Zoned schools: Eustis Elementary School (math 52% / reading 47%, grade D, #1,088 of 2,144 statewide, top 53%, 358 students, 65% FRL); Eustis Middle School (math 45% / reading 41%, grade D-, #331 of 571 statewide, top 59%, 824 students, 57% FRL); Eustis High School (math 33% / reading 40%, grade F, #351 of 667 statewide, top 54%, 1,368 students, 45% FRL).
- Market conditions: Rents rising fast (+4.0%/yr); 507 active listings in the ZIP; 20 comparable units currently listed for rent nearby; rentals at typical pace (median 20d on market — plan ~3-4 weeks tenant-placement turnaround); 4,799 units permitted in Lake County in 2024 (814 in 5+ unit buildings).
- At $2,462/mo this rent would consume 47% of the median local household income ($63k/yr) (locally 586% of renters already pay >50% of income on rent) — very limited rent-growth headroom before tenants either downsize or default.
Forward outlook
- Local home prices are declining (-3.0%/yr); year-one equity from $2k of loan paydown is wiped out by about $11k of value loss. Plan a longer hold.
- Lake County population projected at +37% by 2050 — long-run rental-demand tailwind backs the buy-and-hold thesis.
Negotiation context
- It's been on market 143 days — a 12% lower offer ($312k) is reasonable based on typical stale-listing flexibility.
Questions for the listing agent
- What do current leases actually rent for vs. the listed asking? Can we see a recent rent roll and the last 12 months of T-12 income?
- It's been on market 143 days. Have you received any prior offers? Is the seller open to a 31% concession, seller financing, or rate buy-down credit?
- What does the HOA fee cover, when was the last increase, and are there any pending special assessments or reserve-fund shortfalls?
- Why hasn't it sold? Are there any deal-killer items the seller is aware of (foundation, flood, title, zoning, code violations)?
- Is there a deadline driving the sale (1031 exchange, divorce, estate, relocation)? That informs how much negotiation room exists.
- The area grade is low — what's the realistic commute time and amenity access for the typical tenant pool here? Any planned neighborhood developments (good or bad) we should know about?
- What's the average days-on-market for RENTAL listings here right now (not sales)? A rising rental-DOM trend means longer vacancies and softer asking-rent achievability than the comps imply.
- What's the recent tenant-quality profile in this submarket — average credit score on applications, eviction rate, late-payment / NSF rate, and stable-employment percentage? A property-management company in the area should have these aggregated.
- How much new for-sale + rental construction is in the pipeline within 1–3 miles? Heavy new supply typically softens prices + rents 12–24 months out; constrained supply supports both.
Investment metrics
- 1% rule
- 0.69% ✗
- Cap rate
- 5.63%
- Cash-on-cash
- -2.37%
- DSCR
- 0.89
- GRM
- 12.0
CMA / ARV
No comps found within radius.
Projected returns pro-forma
-3.0% appreciation · 4.05% rent growth · sell at horizon
- IRR
- -19.3%
- Equity multiple
- 0.32×
- Total profit
- $-67,463
- Equity at exit
- $52,856
- IRR
- -10.3%
- Equity multiple
- 0.35×
- Total profit
- $-64,440
- Equity at exit
- $30,650
Cash invested: $99,257 (down + closing). Projections, not guarantees.
Landlord ↔ Tenant lean methodology
- Overall (STATE)
- 87 Strongly Landlord-Friendly
- State Florida
- 87 Strongly Landlord-Friendly · R+3
- County
- — inherits STATE
- City
- — inherits STATE
ZIP-level market 32778
- Home prices YoY
- -23.4%
- Rents YoY
- 4.0%
- Active inventory
- 507
- Price-to-rent
- 12.0×
Monthly cashflow live
- Estimated rent
- $2,462 high interval (Pro) →
- Mortgage (P&I)
- −$1,859
- Tax from tax record
- −$60 /mo · $724/yr
- Insurance
- −$148
- HOA
- −$74
- Vacancy / Maint / Mgmt
- −$517
- Net cashflow
- $-196
Break-even live
Sensitivity live
| Price | -10% $4 | -5% $-96 | +0% $-196 | +5% $-701 | +10% $-824 |
|---|---|---|---|---|---|
| Rent | -10% $-391 | -5% $-293 | +0% $-196 | +5% $-99 | +10% $-2 |
| Rate | -1.0pp $-18 | -0.5pp $-106 | base $-196 | +0.5pp $-288 | +1.0pp $-382 |
UW: 25.0% down · 7.5% · 30yr · 1.5% tax · 5.0% vac · 8.0% maint · 8.0% mgmt
Financing live
Cash to close
- Down payment
- $88,622
- Closing costs
- $10,635
- Reserves months
- —
- Total cash needed
- —
Loan-product check · same deal, 3 products live
Conventional
25% down · 7.5% · 30yr
- Down + closing
- —
- Monthly P&I
- —
- Monthly cashflow
- —
- DSCR
- —
- Eligible?
- —
Personal DTI + credit; lowest rate.
DSCR
20% down · 8.5% · 30yr
- Down + closing
- —
- Monthly P&I
- —
- Monthly cashflow
- —
- DSCR
- —
- Eligible?
- —
No personal income docs; deal must DSCR.
Hard money
10% down · 12.0% · 12mo
- Down + closing
- —
- Monthly P&I
- —
- Monthly cashflow
- —
- DSCR
- —
- Eligible?
- —
Short-term bridge; refi at stabilization.
Rent comps 20 comps
| Address | Beds | Baths | Sqft | Rent | $/sqft | DOM | Units | Dist |
|---|---|---|---|---|---|---|---|---|
| 4229 Evernia Rd Tavares, FL | 3.0 | 2.0 | 1504 | $2,100 | $1.40 | 7d | 1 | 0.10mi |
| 3437 Nettle Loop Tavares, FL | 4.0 | 2.0 | 1665 | $2,060 | $1.24 | 25d | 1 | 0.16mi |
| 3443 Nettle Loop Tavares, FL | 5.0 | 3.0 | 2447 | $2,295 | $0.94 | 23d | 1 | 0.19mi |
| 3422 Salvia Ct Tavares, FL | 4.0 | 2.0 | 1839 | $2,299 | $1.25 | 25d | 1 | 0.20mi |
| 3422 Salvia Ct Tavares, FL | 4.0 | 2.0 | 1839 | $2,299 | $1.25 | 22d | 1 | 0.20mi |
| 3031 Jessamine Dr Tavares, FL | 3.0 | 2.5 | 1451 | $2,016 | $1.39 | 7d | 1 | 0.39mi |
| 3039 Tansy St Tavares, FL | 4.0 | 2.5 | 2296 | $2,600 | $1.13 | 5d | 1 | 0.48mi |
| 1105 Fig St Tavares, FL | 4.0 | 3.0 | 2200 | $2,600 | $1.18 | 14d | 1 | 0.55mi |
| 1105 Fig St Tavares, FL | 4.0 | 3.0 | 2200 | $2,600 | $1.18 | 16d | 1 | 0.55mi |
| 3342 Landing View Tavares, FL | 3.0 | 2.0 | 1690 | $1,995 | $1.18 | 5d | 1 | 0.58mi |
| 2698 Rowan St Tavares, FL | 3.0 | 2.0 | 1614 | $2,399 | $1.49 | 4d | 1 | 0.58mi |
| 131 W Atwater Ave Eustis, FL | 3.0 | 1.0 | 1400 | $2,100 | $1.50 | 25d | 1 | 0.69mi |
| 131 W Atwater Ave Eustis, FL | 4.0 | 2.0 | 2614 | $2,900 | $1.11 | 14d | 1 | 0.69mi |
| 507 Lakeshore Dr Eustis, FL | 3.0 | 2.0 | 1806 | $4,350 | $2.41 | 25d | 1 | 0.93mi |
| 902 S Grove St Eustis, FL | 3.0 | 1.0 | 1389 | $1,350 | $0.97 | 25d | 1 | 1.00mi |
| 336 Ryans Ridge Ave Eustis, FL | 4.0 | 2.0 | 1317 | $2,000 | $1.52 | 25d | 1 | 1.03mi |
| 408 E Idlewild Ave Eustis, FL | 4.0 | 2.5 | 1863 | $2,349 | $1.26 | 18d | 1 | 1.05mi |
| 1411 S Mary St Eustis, FL | 3.0 | 2.0 | 1580 | $1,950 | $1.23 | 12d | 1 | 1.16mi |
| 116 Dewitt Ct Unit 116 Eustis, FL | 3.0 | 2.0 | 1296 | $1,850 | $1.43 | 19d | 1 | 1.37mi |
| 116 Dewitt Ct Eustis, FL | 3.0 | 2.0 | 1299 | $1,890 | $1.45 | 25d | 1 | 1.37mi |
HOA detail
- Monthly dues
- $74 · $888/yr
- Likely covers
- water
Listing history 6 events
-
2026-04-23status Pending
-
2026-03-25price $354,490
-
2026-01-17price $359,490
-
2026-01-13price $344,490
-
2026-01-06price $339,490
-
2025-12-01$349,490 Active
ⓘ Source: listings_history table (triggers on properties + properties_extension) + one-shot
backfill from property_details.listing_events for pre-trigger history.
Tax reassessment forecast FL · Resets to sale price
- Current annual tax
- $724 · $60/mo
- Projected year-2 tax
- $2,942 · $245/mo
- Expected delta
- +$2,218/yr (+$185/mo · 306.4%)
ⓘ Screening estimate from a state-policy table — verify with the county assessor before closing.
Nearby sold comps map
Loading sold comps map…
Walkable amenities ~0.75 mi
Loading nearby amenities…
Taxation est. · year 1
- Rental income
- $29,541
- − Mortgage interest
- −$19,857
- − Property taxes
- −$724
- − Insurance
- −$1,772
- − Repairs & maintenance
- −$2,363
- − Management
- −$2,363
- − HOA
- −$888
- − Depreciation
- −$10,312
- Taxable loss
- −$8,739
- Est. tax savings @ 24.0%
- +$2,097
- After-tax cash flow
- $-257/yr
For passive investors: Depreciation is non-cash, so a rental often shows a tax loss while cash-flowing — sheltering income. Rental losses are passive: they offset passive income freely, and up to $25,000/yr can offset ordinary (W-2) income if you actively participate and your MAGI is under $100k (phasing out to $0 by $150k); unused losses carry forward. On sale, claimed depreciation is recaptured at up to 25%, and gains may owe capital-gains tax (a 1031 exchange can defer both). Figures are a year-1 estimate at your 24.0% rate — not tax advice; consult a CPA.
Schools (NCES district)
- District
- Lake
- NCES district ID
- 1201050
- Math proficiency
- 49% ▼ -7.00%
- Reading proficiency
- 50% ▼ -4.00%
- Median HH income
- $46,632
- Composite
- 42.05/100
- National rank
- #3327
- State rank
- #37 of 73 in FL
Livability — Tavares
- Score
- 76/100
- State rank
- #220
- US rank
- #3464
Category grades
Schools grade is shown separately in the Schools card above.
Census & demographics
- Census place
- Tavares, FL
- County
- Lake County · 364,602 people
- City population
- 25,042
- Metro
- Orlando-Kissimmee-Sanford, FL
- Population (ZIP)
- 25,042
- Household income
- $63,472
- Rent vs Own
- Severe rent burden
- 586.0
Population outlook (Lake County) Hauer SSP2
- Today (2025)
- 386,640 people
- By 2030
- 417,107 · +7.9%
- By 2040
- 476,676 · +23.3%
- By 2050
- 531,296 · +37.4%
- By 2075
- 648,303 · +67.7%
- By 2100
- 698,530 · +80.7%
Race, ethnicity, and origin ACS 2023
- Neighborhood character
- Predominantly White (72%)
- Race & ethnicity
- White 72% Hispanic / Latino 14% Two or more races 8% Black 8% Asian 2%
- Hispanic origin (detail)
- Mexican 1% Puerto Rican 7% Cuban 2% Dominican 1%
- Common ancestry
- Romanian 4% Italian 3% Slovak 2%
- Foreign-born
- 9% · Canada, Dominican Republic, Jamaica
- Languages at home
- 85% English-only · Spanish 11% Other Indo-European 2% Other Asian/Pacific 1%
Political lean MEDSL · Lake
- 2024 margin
- Strong R (+24.7) · D 37.3% · R 62.0%
- 2008→2024 swing
- -11.2pp toward R · 2008: -13.5pp · 2024: -24.7pp
- All cycles
- 2024: R+24.7 2020: R+20.0 2016: R+23.1 2012: R+17.1 2008: R+13.5
Not yet ingested
- Civics
- —
Market trends
- HPI YoY
- ▼ -88.07%
- Current HPI
- 288.7123
- Rent YoY
- ▲ 4.05%
- Metro
- Orlando-Kissimmee-Sanford, FL
- State GDP YoY
- ▲ 3.28%
- F500 in state
- 36
Industry mix (Fortune 500 HQ in FL)
| Industry | F500 HQs | Revenue |
|---|---|---|
| Industrial Technology | 2 | $29B |
|
||
| Insurance | 2 | $17B |
|
||
| Retail | 1 | $60B |
|
||
| Technology Distribution | 1 | $58B |
|
||
| Homebuilding | 1 | $35B |
|
||
| Technology Manufacturing | 1 | $35B |
|
||
Price history
+1.4% since first listed6 events — show timeline
- 2026-04-23 Pending — Stellar MLS as Distributed by MLS Grid
- 2026-03-25 Price Changed $354,490 Stellar MLS as Distributed by MLS Grid
- 2026-01-17 Price Changed $359,490 Stellar MLS as Distributed by MLS Grid
- 2026-01-13 Price Changed $344,490 Stellar MLS as Distributed by MLS Grid
- 2026-01-06 Price Changed $339,490 Stellar MLS as Distributed by MLS Grid
- 2025-12-01 Listed $349,490 Stellar MLS as Distributed by MLS Grid
Cash-flow waterfall
monthlySold comps — $/sqft
last 12 mo · ≤1 miLoading sold comps…