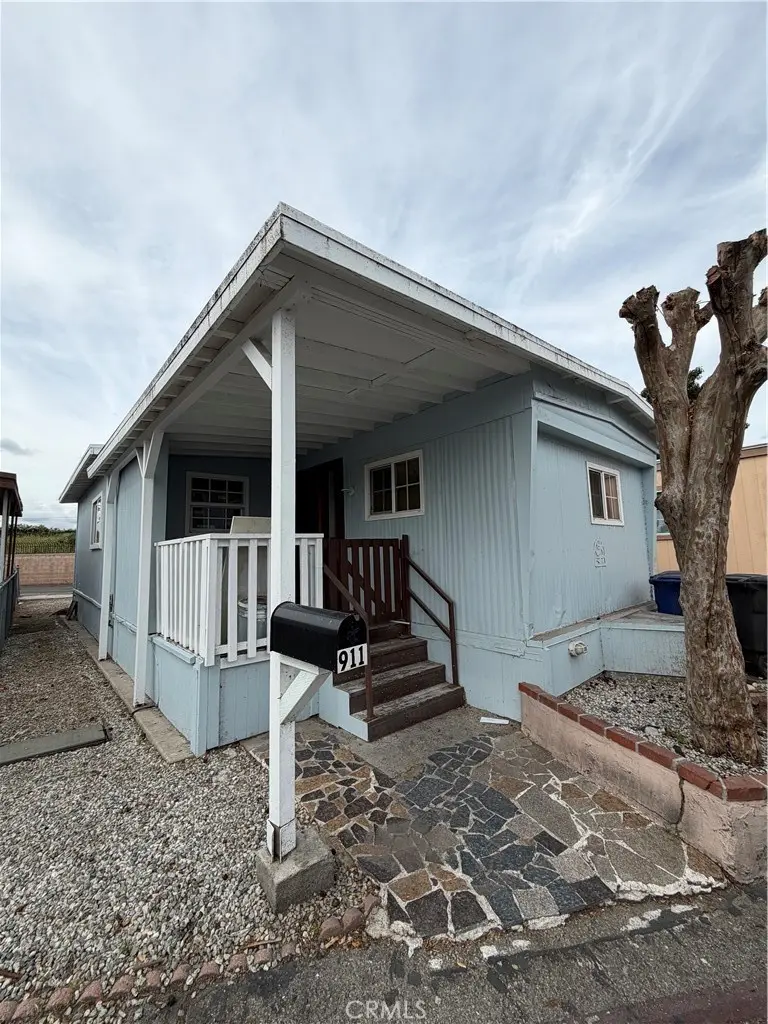
6475 S Atlantic Ave #911 · Long Beach, CA
Flood risk 4/10 · Minor
- FEMA flood zone
- X
- Chance of flooding over 30 yrs
- 0.2%
- Est. flood insurance / yr
- $507 – $1,088
Fire risk 1/10 · Minimal
- Est. fire insurance / yr
- $659 – $1,223
Heat risk 4/10 · Minor
- Hot days now (above 90°F)
- 6 days/yr
- Hot days in 30 yrs
- 19 days/yr
Wind risk 1/10 · Minimal
- Chance of severe wind over 30 yrs
- —
Air-quality risk 6/10 · Moderate
- Unhealthy air days now
- 10 days/yr
- Unhealthy air days in 30 yrs
- 10 days/yr
Risk factors via First Street. Map © Google.
Why this score? — see what drove the B grade
The composite is a weighted blend of 9 inputs, each scored 0–100. Each bar is that input's sub-score; the figure is the points it added to the 100-point composite (weight × sub-score).
- Cash flow +30.0/30.0
- ARV discount +11.4/15.0
- 1% rule +10.0/10.0
- DSCR +10.0/10.0
- Schools +3.7/10.0
- Livability +3.4/5.0
- Rent growth +3.0/5.0
- Condition / age +2.5/5.0
- Appreciation +0.0/10.0
$180,000
🖨 Deal sheet 📄 Offer letter ✓ Due diligence
Listing remarks MLS
This beautifully renovated home in the sought-after Villa Park community has been transformed from top to bottom. Step inside to discover a bright, open-concept floor plan featuring brand-new, high-end flooring and a designer-inspired kitchen with sleek cabinetry and ample counter space. Enough parking for 3 vehicles: two in the driveway and one in the back. Located in a secure, 24-hour guard-gated community, you'll enjoy fantastic amenities including a sparkling swimming pool, clubhouse, and guest parking. Conveniently located near the 91 and 710 freeways, shopping, and schools.
Key facts
- Clubhouse
- High-end flooring
- Community pool
Tags
Neighborhood map
What this means for you Summary
Snapshot
- This is a 4-bed/2.0-bath manufactured listed at $180k.
Deal economics
- At list price, monthly cash flow is $2k ($19k/yr) — positive.
- The deal already cash-flows at list — no discount required.
- Meets the 1% rule at list price ($4k rent vs $180k).
- Recommended offer: $158k (12.0% below list) — sets the bar for market timing.
- Cap rate 16.9% vs local median 1.9% in Long Beach — top-decile yield for the area; either an underpriced asset or a hidden risk that comps aren't pricing in. Stress-test before assuming the spread holds.
Location & tenants
- Location reads 67/100 on livability (#319 in CA) — a middle-class / working-renter tenant base. Strengths: amenities A+, commute A+, employment B+; Watch: health & safety C-, crime F, cost of living F.
- Long Beach Unified (urban): math 34% / reading 50% proficiency, ranked #216 of 517 in CA (top 42%) — families likely to look elsewhere, expect single-tenant / working-renter base with shorter leases.
- Market conditions: Rents rising (+1.9%/yr); 100 active listings in the ZIP; 11 comparable units currently listed for rent nearby; rentals at typical pace (median 21d on market — plan ~3-4 weeks tenant-placement turnaround); 45% of comp listings sitting > 30 days — soft ceiling on asking rent; 19,697 units permitted in Los Angeles County in 2024 (9,426 in 5+ unit buildings).
- At $3,582/mo this rent would consume 59% of the median local household income ($73k/yr) (locally 4834% of renters already pay >50% of income on rent) — very limited rent-growth headroom before tenants either downsize or default.
Forward outlook
- Local home prices are declining (-3.0%/yr); year-one equity from $1k of loan paydown is wiped out by about $5k of value loss. Plan a longer hold.
- Los Angeles County population projected at +9% by 2050 — modest demand growth; plan on rents tracking national, not racing it.
- At projected returns (-3.0% appreciation + 1.9% rent growth), your $50k cash investment doubles in ~4 years — after that, you're playing with house money.
Negotiation context
- It's been on market 140 days — a 12% lower offer ($158k) is reasonable based on typical stale-listing flexibility.
- 2 sale attempts since 9y ago; this cycle's ask has dropped $20k (10%) from the opening price — seller is motivated, your offer sets the floor, not the list.
Questions for the listing agent
- It's been on market 140 days. Have you received any prior offers? Is the seller open to a 12% concession, seller financing, or rate buy-down credit?
- Built in 1966 — when were the roof, HVAC, electrical panel, plumbing, and water heater last replaced?
- Why hasn't it sold? Are there any deal-killer items the seller is aware of (foundation, flood, title, zoning, code violations)?
- Is there a deadline driving the sale (1031 exchange, divorce, estate, relocation)? That informs how much negotiation room exists.
- Crime grade is F in this area — have there been break-ins, vandalism, or insurance claims at this property in the last 3 years? What carrier currently insures it and at what premium?
- What's the average days-on-market for RENTAL listings here right now (not sales)? A rising rental-DOM trend means longer vacancies and softer asking-rent achievability than the comps imply.
- What's the recent tenant-quality profile in this submarket — average credit score on applications, eviction rate, late-payment / NSF rate, and stable-employment percentage? A property-management company in the area should have these aggregated.
- How much new for-sale + rental construction is in the pipeline within 1–3 miles? Heavy new supply typically softens prices + rents 12–24 months out; constrained supply supports both.
Investment metrics
- 1% rule
- 1.99% ✓
- Cap rate
- 16.87%
- Cash-on-cash
- 37.76%
- DSCR
- 2.68
- GRM
- 4.2
CMA / ARV
- ARV (median comp)
- $197,042
- List price
- $180,000
- Delta
- -8.65%
- Verdict
- FAIR
- Comps
- 3 within 1.0 mi
Show comp detail 5 sales within ~0.75 mi
| Address | Dist | Beds/Ba | Sqft | Sold | Price | $/sf | Match |
|---|---|---|---|---|---|---|---|
| 6475 Atlantic Ave #815 | 0.00mi | 4/2.0 | 1,140 (-1%) | 3mo | $200,000 | $175 | 96 |
| 6475 Atlantic #353 | 0.12mi | 3/2.0 (-1) | 1,080 (-6%) | 7mo | $200,000 | $185 | 73 |
| 907 Paradise Ln | 0.12mi | 3/2.0 (-1) | 1,250 (+8%) | 13mo | $188,888 | $151 | 64 |
| 6475 Atlantic Ave #731 | 0.15mi | 4/1.0 | 1,200 (+4%) | 22mo | $189,500 | $158 | 63 |
| 6475 Atlantic Ave #748 | 0.12mi | 3/2.0 (-1) | 1,320 (+15%) | 23mo | $255,000 | $193 | 46 |
Match score weights: distance 35% · size 25% · config 20% · recency 20%. Top-matched comps best support the ARV.
Projected returns pro-forma
-3.0% appreciation · 1.95% rent growth · sell at horizon
- IRR
- 32.6%
- Equity multiple
- 2.35×
- Total profit
- $68,146
- Equity at exit
- $26,839
- IRR
- 39.0%
- Equity multiple
- 4.46×
- Total profit
- $174,573
- Equity at exit
- $15,563
Cash invested: $50,400 (down + closing). Projections, not guarantees.
Landlord ↔ Tenant lean methodology
- Overall (STATE)
- 18 Strongly Tenant-Friendly
- State California
- 18 Strongly Tenant-Friendly · D+13
- County
- — inherits STATE
- City
- — inherits STATE
ZIP-level market 90805
- Rents YoY
- 1.9%
- Active inventory
- 100
- Price-to-rent
- 4.2×
Monthly cashflow live
- Estimated rent
- $3,582 high interval (Pro) →
- Mortgage (P&I)
- −$944
- Tax est. 1.5%
- −$225 /mo · $2,700/yr
- Insurance
- −$75
- HOA
- −$0
- Vacancy / Maint / Mgmt
- −$752
- Net cashflow
- $1,586
Break-even live
UW: 25.0% down · 7.5% · 30yr · 1.5% tax · 5.0% vac · 8.0% maint · 8.0% mgmt
Financing live
Cash to close
- Down payment
- $45,000
- Closing costs
- $5,400
- Reserves months
- —
- Total cash needed
- —
Loan-product check · same deal, 3 products live
Conventional
25% down · 7.5% · 30yr
- Down + closing
- —
- Monthly P&I
- —
- Monthly cashflow
- —
- DSCR
- —
- Eligible?
- —
Personal DTI + credit; lowest rate.
DSCR
20% down · 8.5% · 30yr
- Down + closing
- —
- Monthly P&I
- —
- Monthly cashflow
- —
- DSCR
- —
- Eligible?
- —
No personal income docs; deal must DSCR.
Hard money
10% down · 12.0% · 12mo
- Down + closing
- —
- Monthly P&I
- —
- Monthly cashflow
- —
- DSCR
- —
- Eligible?
- —
Short-term bridge; refi at stabilization.
Rent comps 11 comps
| Address | Beds | Baths | Sqft | Rent | $/sqft | DOM | Units | Dist |
|---|---|---|---|---|---|---|---|---|
| 6651 Millmark Ave Long Beach, CA | 4.0 | 2.0 | 1440 | $3,750 | $2.60 | 44d | 1 | 0.36mi |
| 6327 California Ave Long Beach, CA | 4.0 | 2.5 | 1400 | $4,450 | $3.18 | 44d | 1 | 0.45mi |
| 6327 California Ave Long Beach, CA | 4.0 | 3.0 | 1400 | $4,500 | $3.21 | 1d | 1 | 0.45mi |
| 195 E Hullett St Long Beach, CA | 3.0 | 1.0 | 725 | $2,595 | $3.58 | 17d | 1 | 0.70mi |
| 6765 Lemon Ave Long Beach, CA | 3.0 | 2.0 | 1197 | $3,800 | $3.17 | 3d | 1 | 0.71mi |
| 1011 E 56th St Long Beach, CA | 3.0 | 2.0 | 1200 | $2,800 | $2.33 | 17d | 1 | 1.00mi |
| 515 E 55th St Long Beach, CA | 3.0 | 1.0 | 900 | $3,200 | $3.56 | 21d | 1 | 1.02mi |
| 6045 Cherry Ave Unit 1 Long Beach, CA | 3.0 | 1.0 | 1095 | $2,850 | $2.60 | 13d | 1 | 1.22mi |
| 410 E Plymouth St Long Beach, CA | 3.0 | 1.5 | 1276 | $3,549 | $2.78 | 44d | 1 | 1.23mi |
| 5479 Orange Ave Unit 5479 Long Beach, CA | 3.0 | 1.0 | 1117 | $3,150 | $2.82 | 44d | 1 | 1.24mi |
| 1523 E Market St Long Beach, CA | 4.0 | 2.0 | 1200 | $4,000 | $3.33 | 44d | 1 | 1.43mi |
Listing history 20 events
-
2026-06-18days on market $180,000 Active 140 DOM
-
2026-06-17price $180,000 Active 139 DOM
-
2026-06-17days on market $200,000 Active 139 DOM
-
2026-06-16days on market $200,000 Active 138 DOM
-
2026-06-15days on market $200,000 Active 137 DOM
-
2026-06-13days on market $200,000 Active 135 DOM
-
2026-06-13days on market $200,000 Active 134 DOM
-
2026-06-09days on market $200,000 Active 131 DOM
-
2026-06-08days on market $200,000 Active 130 DOM
-
2026-06-07days on market $200,000 Active 129 DOM
-
2026-06-04days on market $200,000 Active 126 DOM
-
2026-06-03days on market $200,000 Active 125 DOM
-
2026-06-02days on market $200,000 Active 124 DOM
-
2026-06-01days on market $200,000 Active 123 DOM
-
2026-05-31days on market $200,000 Active 122 DOM
-
2026-01-29$200,000 Active 586-char remark
Show marketing remark (586 chars)
This beautifully renovated home in the sought-after Villa Park community has been transformed from top to bottom. Step inside to discover a bright, open-concept floor plan featuring brand-new, high-end flooring and a designer-inspired kitchen with sleek cabinetry and ample counter space. Enough parking for 3 vehicles: two in the driveway and one in the back. Located in a secure, 24-hour guard-gated community, you'll enjoy fantastic amenities including a sparkling swimming pool, clubhouse, and guest parking. Conveniently located near the 91 and 710 freeways, shopping, and schools.
-
2017-10-14status Pending Sale
-
2017-10-14historical Hold Do Not Show
-
2017-10-11price $30,000
-
2017-10-02$40,000 Active
ⓘ Source: listings_history table (triggers on properties + properties_extension) + one-shot
backfill from property_details.listing_events for pre-trigger history.
Climate risk First Street
- Flood 4/10 Moderate FEMA zone X · 20% chance over 30 yrs
- Wildfire 1/10 Low
- Heat 4/10 Moderate 6 d/yr ≥90°F today · 19 d/yr by 30 yrs out
- Wind 1/10 Low
- Air quality 6/10 Major 10 unhealthy d/yr today · 10 by 30 yrs out
Nearby sold comps map
Loading sold comps map…
Walkable amenities ~0.75 mi
Loading nearby amenities…
Taxation est. · year 1
- Rental income
- $42,984
- − Mortgage interest
- −$10,083
- − Property taxes
- −$2,700
- − Insurance
- −$900
- − Repairs & maintenance
- −$3,439
- − Management
- −$3,439
- − Depreciation
- −$5,236
- Taxable income
- $17,188
- Est. tax owed @ 24.0%
- −$4,125
- After-tax cash flow
- $14,905/yr
For passive investors: Depreciation is non-cash, so a rental often shows a tax loss while cash-flowing — sheltering income. Rental losses are passive: they offset passive income freely, and up to $25,000/yr can offset ordinary (W-2) income if you actively participate and your MAGI is under $100k (phasing out to $0 by $150k); unused losses carry forward. On sale, claimed depreciation is recaptured at up to 25%, and gains may owe capital-gains tax (a 1031 exchange can defer both). Figures are a year-1 estimate at your 24.0% rate — not tax advice; consult a CPA.
Schools (NCES district)
- District
- Long Beach Unified
- NCES district ID
- 0622500
- Math proficiency
- 34% ▼ -11.00%
- Reading proficiency
- 50% ▼ -4.00%
- Median HH income
- $56,092
- Composite
- 36.67/100
- National rank
- #4607
- State rank
- #216 of 517 in CA
Livability — Long Beach
- Score
- 67/100
- State rank
- #319
- US rank
- #10758
Category grades
Schools grade is shown separately in the Schools card above.
Census & demographics
- Census place
- Long Beach, CA
- County
- Los Angeles County · 9,444,647 people
- City population
- 466,088
- Metro
- Los Angeles-Long Beach-Anaheim, CA
- Population (ZIP)
- 92,402
- Household income
- $73,415
- Rent vs Own
- Severe rent burden
- 4834.0
Population outlook (Los Angeles County) Hauer SSP2
- Today (2025)
- 10,940,515 people
- By 2030
- 11,256,481 · +2.9%
- By 2040
- 11,729,929 · +7.2%
- By 2050
- 11,948,407 · +9.2%
- By 2075
- 11,818,114 · +8.0%
- By 2100
- 10,842,928 · -0.9%
Race, ethnicity, and origin ACS 2023
- Neighborhood character
- Diverse neighborhood (Simpson 0.60)
- Race & ethnicity
- Hispanic / Latino 59% Black 18% Two or more races 16% Asian 11% White 8% Native American 2%
- Hispanic origin (detail)
- Mexican 48%
- Common ancestry
- Lithuanian 1% Slovak 1%
- Foreign-born
- 30% · Canada, Vietnam
- Languages at home
- 41% English-only · Spanish 49% Other Asian/Pacific 5% Tagalog/Filipino 2%
Political lean MEDSL · Los Angeles
- 2024 margin
- Solid D (+32.9) · D 64.8% · R 31.9% · Other 3.3%
- 2008→2024 swing
- -7.4pp toward R · 2008: 40.4pp · 2024: 32.9pp
- All cycles
- 2024: D+32.9 2020: D+44.2 2016: D+48.0 2012: D+40.0 2008: D+40.4
Not yet ingested
- Civics
- —
Market trends
- HPI YoY
- ▼ -817.43%
- Current HPI
- 456.7913
- Rent YoY
- ▲ 1.95%
- Metro
- Los Angeles-Long Beach-Anaheim, CA
- State GDP YoY
- ▲ 3.21%
- F500 in state
- 116
Industry mix (Fortune 500 HQ in CA)
| Industry | F500 HQs | Revenue |
|---|---|---|
| Technology | 27 | $1,492B |
|
||
| Financial Services | 3 | $174B |
|
||
| Retail | 3 | $44B |
|
||
| Insurance | 3 | $26B |
|
||
| Media / Entertainment | 2 | $115B |
|
||
| Pharmaceuticals / Biotech | 2 | $62B |
|
||
Price history
+400.0% since first listed5 events — show timeline
- 2026-01-29 Listed $200,000 CRMLS
- 2017-10-14 Pending — CRMLS
- 2017-10-14 Delisted — CRMLS
- 2017-10-11 Price Changed $30,000 CRMLS
- 2017-10-02 Listed $40,000 CRMLS
Cash-flow waterfall
monthlySold comps — $/sqft
last 12 mo · ≤1 miLoading sold comps…