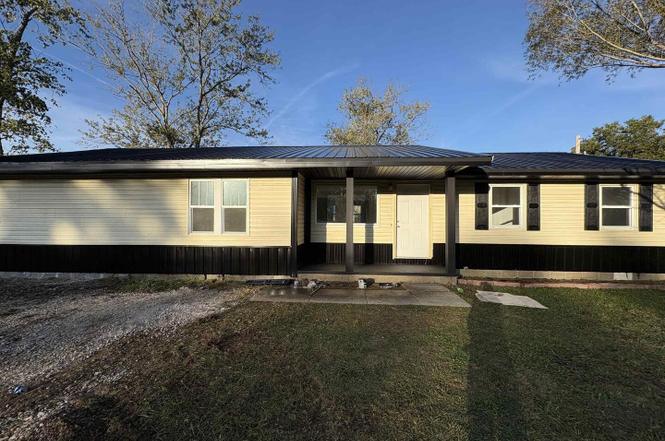
3305 Selmaville Rd · Salem, IL
Flood risk 1/10 · Minimal
- FEMA flood zone
- X (unshaded)
- Chance of flooding over 30 yrs
- 0.0%
- Est. flood insurance / yr
- $473 – $860
Fire risk 1/10 · Minimal
- Est. fire insurance / yr
- $804 – $1,492
Heat risk 4/10 · Minor
- Hot days now (above 106°F)
- 7 days/yr
- Hot days in 30 yrs
- 20 days/yr
Wind risk 2/10 · Minimal
- Chance of severe wind over 30 yrs
- 2.0%
Air-quality risk 2/10 · Minimal
- Unhealthy air days now
- 1 days/yr
- Unhealthy air days in 30 yrs
- 2 days/yr
Risk factors via First Street. Map © Google.
Why this score? — see what drove the F grade
The composite is a weighted blend of 9 inputs, each scored 0–100. Each bar is that input's sub-score; the figure is the points it added to the 100-point composite (weight × sub-score).
- Cash flow +8.5/30.0
- Livability +3.4/5.0
- Schools +2.6/10.0
- Rent growth +2.5/5.0
- Condition / age +2.5/5.0
- DSCR +2.3/10.0
- 1% rule +2.0/10.0
- ARV discount +0.0/15.0
- Appreciation +0.0/10.0
$159,900
🖨 Deal sheet 📄 Offer letter ✓ Due diligence
Listing remarks MLS
3 bedroom home, country setting. With some TLC this would make a great family home in a K-8 school district none
Key facts
- Huge walk-in closet
- Spacious kitchen
- New countertops
Tags
Property features AI
Finance
- Other: Fee simple ownership; Not rebuilt; Possession at closing
- Financial info: No special service area
Exterior
- Parking: Gravel parking
- Utilities: Public water; Septic tank sewer; 100 Amp electrical service
- Home design: Detached single-family home; One-story
- Construction: Built 41–50 years ago; Vinyl siding with frame construction; Foundation: Other
- Exterior features: Lot dimensions approximately 100 x 260; Lot smaller than 0.25 acre; Lot features listed as other
Interior
- Kitchen: Kitchen on main level (13 x 17) with laminate flooring
- Bedrooms: 4 bedrooms (all on the main level); Bedroom dimensions include 11 x 11, 11 x 10, and 17 x 21; Master bedroom 11 x 11
- Flooring: Carpet in living room and bedrooms; Laminate in kitchen
- Bathrooms: 2 full bathrooms
- Heating & cooling: Central air; Heating: Other
- Interior features: Egress window in basement
Neighborhood map
What this means for you Summary
Snapshot
- This is a 4-bed/2.0-bath single-family listed at $160k.
Deal economics
- At list price, monthly cash flow is $-141 ($-2k/yr) — negative.
- To cash-flow at today's rent, offer at most $135k (15.5% below list).
- To meet the 1% rule (rent ≥ 1% of price), the offer needs to be $112k (29.7% below list).
- Recommended offer: $112k (29.7% below list) — sets the bar for 1% rule.
Location & tenants
- Location reads 68/100 on livability (#467 in IL) — a middle-class / working-renter tenant base. Strengths: cost of living A+, housing A+, health & safety A+; Watch: schools D, amenities F, commute F.
- Salem Chsd 600 (town): math 25% / reading 30% proficiency, ranked #571 of 919 in IL (top 62%) — low school quality limits family demand, transient renter base, plan for 1-2y turnover.
- Market conditions: 48 active listings in the ZIP; 2 units permitted in Marion County in 2024 (0 in 5+ unit buildings).
Forward outlook
- Local home prices are declining (-3.0%/yr); year-one equity from $1k of loan paydown is wiped out by about $5k of value loss. Plan a longer hold.
- Marion County population projected at -20% by 2050 — secular population decline; favor cash flow + early exit over multi-decade hold.
Negotiation context
- It's been on market 45 days — a 3% lower offer ($155k) is reasonable based on typical stale-listing flexibility.
- 6 sale attempts since 9y ago; this cycle's ask is 435% above the opening price — seller raised mid-cycle; expect resistance to lowballs.
- Current owner paid $30k; list at $160k implies a 433% gain — meaningful room to come down on a strong offer.
Questions for the listing agent
- What do current leases actually rent for vs. the listed asking? Can we see a recent rent roll and the last 12 months of T-12 income?
- It's been on market 45 days. Have you received any prior offers? Is the seller open to a 30% concession, seller financing, or rate buy-down credit?
- Built in 1975 — when were the roof, HVAC, electrical panel, plumbing, and water heater last replaced?
- Is there a deadline driving the sale (1031 exchange, divorce, estate, relocation)? That informs how much negotiation room exists.
- Schools are D-rated, which usually means shorter tenancies and higher turnover. Who's the typical renter profile here, and what's been the actual vacancy rate?
- The area grade is low — what's the realistic commute time and amenity access for the typical tenant pool here? Any planned neighborhood developments (good or bad) we should know about?
- What's the average days-on-market for RENTAL listings here right now (not sales)? A rising rental-DOM trend means longer vacancies and softer asking-rent achievability than the comps imply.
- What's the recent tenant-quality profile in this submarket — average credit score on applications, eviction rate, late-payment / NSF rate, and stable-employment percentage? A property-management company in the area should have these aggregated.
- How much new for-sale + rental construction is in the pipeline within 1–3 miles? Heavy new supply typically softens prices + rents 12–24 months out; constrained supply supports both.
Investment metrics
- 1% rule
- 0.70% ✗
- Cap rate
- 5.24%
- Cash-on-cash
- -3.77%
- DSCR
- 0.83
- GRM
- 11.9
CMA / ARV
- ARV (on-the-fly)
- $130,869
- Comps found
- 1
Show comp detail 1 sale within ~0.75 mi
| Address | Dist | Beds/Ba | Sqft | Sold | Price | $/sf | Match |
|---|---|---|---|---|---|---|---|
| 3287 Selmaville Rd Rd | 0.03mi | 3/1.5 (-1) | 990 (-1%) | 3mo | $130,000 | $131 | 88 |
Match score weights: distance 35% · size 25% · config 20% · recency 20%. Top-matched comps best support the ARV.
Projected returns pro-forma
-3.0% appreciation · 3.0% rent growth · sell at horizon
- IRR
- -22.7%
- Equity multiple
- 0.22×
- Total profit
- $-34,895
- Equity at exit
- $23,842
- IRR
- -17.0%
- Equity multiple
- 0.06×
- Total profit
- $-42,039
- Equity at exit
- $13,825
Cash invested: $44,772 (down + closing). Projections, not guarantees.
Landlord ↔ Tenant lean methodology
- Overall (STATE)
- 43 Moderately Tenant-Leaning
- State Illinois
- 43 Moderately Tenant-Leaning · D+7
- County
- — inherits STATE
- City
- — inherits STATE
ZIP-level market 62881
- Home prices YoY
- -28.0%
- Active inventory
- 48
- Price-to-rent
- 11.9×
Monthly cashflow live
- Estimated rent
- $1,124 medium interval (Pro) →
- Mortgage (P&I)
- −$839
- Tax from tax record
- −$123 /mo · $1,479/yr
- Insurance
- −$67
- HOA
- −$0
- Vacancy / Maint / Mgmt
- −$236
- Net cashflow
- $-141
Break-even live
UW: 25.0% down · 7.5% · 30yr · 1.5% tax · 5.0% vac · 8.0% maint · 8.0% mgmt
Financing live
Cash to close
- Down payment
- $39,975
- Closing costs
- $4,797
- Reserves months
- —
- Total cash needed
- —
Loan-product check · same deal, 3 products live
Conventional
25% down · 7.5% · 30yr
- Down + closing
- —
- Monthly P&I
- —
- Monthly cashflow
- —
- DSCR
- —
- Eligible?
- —
Personal DTI + credit; lowest rate.
DSCR
20% down · 8.5% · 30yr
- Down + closing
- —
- Monthly P&I
- —
- Monthly cashflow
- —
- DSCR
- —
- Eligible?
- —
No personal income docs; deal must DSCR.
Hard money
10% down · 12.0% · 12mo
- Down + closing
- —
- Monthly P&I
- —
- Monthly cashflow
- —
- DSCR
- —
- Eligible?
- —
Short-term bridge; refi at stabilization.
Listing history 16 events
-
2026-05-04status Pending
-
2026-05-01status Active
-
2026-04-23historical
-
2026-04-07status Active
-
2026-01-12status Pending
-
2025-12-16price
-
2025-12-16status Active
-
2025-12-16historical
-
2025-11-26historical Under Contract
-
2025-11-15price
-
2025-10-23Active
-
2017-07-18soldstatus $30,000 112-char remark
Show marketing remark (112 chars)
3 bedroom home, country setting. With some TLC this would make a great family home in a K-8 school district none
-
2017-07-18soldstatus $30,000 112-char remark
Show marketing remark (112 chars)
3 bedroom home, country setting. With some TLC this would make a great family home in a K-8 school district none
-
2017-07-18soldstatus
Show marketing remark (112 chars)
3 bedroom home, country setting. With some TLC this would make a great family home in a K-8 school district none
-
2017-04-15$29,900 112-char remark
Show marketing remark (112 chars)
3 bedroom home, country setting. With some TLC this would make a great family home in a K-8 school district none
-
2017-04-15$29,900 112-char remark
Show marketing remark (112 chars)
3 bedroom home, country setting. With some TLC this would make a great family home in a K-8 school district none
ⓘ Source: listings_history table (triggers on properties + properties_extension) + one-shot
backfill from property_details.listing_events for pre-trigger history.
Tax reassessment forecast IL · Partial reset (capped growth)
- Current annual tax
- $1,479 · $123/mo
- Projected year-2 tax
- $2,554 · $213/mo
- Expected delta
- +$1,075/yr (+$90/mo · 72.7%)
ⓘ Screening estimate from a state-policy table — verify with the county assessor before closing.
Climate risk First Street
- Flood 1/10 Low FEMA zone X (unshaded) · 0% chance over 30 yrs
- Wildfire 1/10 Low
- Heat 4/10 Moderate 7 d/yr ≥106°F today · 20 d/yr by 30 yrs out
- Wind 2/10 Low 2% chance of damaging wind over 30 yrs
- Air quality 2/10 Low 1 unhealthy d/yr today · 2 by 30 yrs out
Nearby sold comps map
Loading sold comps map…
Walkable amenities ~0.75 mi
Loading nearby amenities…
Taxation est. · year 1
- Rental income
- $13,486
- − Mortgage interest
- −$8,957
- − Property taxes
- −$1,479
- − Insurance
- −$800
- − Repairs & maintenance
- −$1,079
- − Management
- −$1,079
- − Depreciation
- −$4,652
- Taxable loss
- −$4,559
- Est. tax savings @ 24.0%
- +$1,094
- After-tax cash flow
- $-593/yr
For passive investors: Depreciation is non-cash, so a rental often shows a tax loss while cash-flowing — sheltering income. Rental losses are passive: they offset passive income freely, and up to $25,000/yr can offset ordinary (W-2) income if you actively participate and your MAGI is under $100k (phasing out to $0 by $150k); unused losses carry forward. On sale, claimed depreciation is recaptured at up to 25%, and gains may owe capital-gains tax (a 1031 exchange can defer both). Figures are a year-1 estimate at your 24.0% rate — not tax advice; consult a CPA.
Schools (NCES district)
- District
- Salem Chsd 600
- NCES district ID
- 1735190
- Math proficiency
- 25% ▲ 10.00%
- Reading proficiency
- 30% ▲ 5.00%
- Median HH income
- $39,305
- Composite
- 26.04/100
- National rank
- #12738
- State rank
- #571 of 919 in IL
Livability — Salem
- Score
- 68/100
- State rank
- #467
- US rank
- #9634
Category grades
Schools grade is shown separately in the Schools card above.
Census & demographics
- City population
- 11,218
- Population (ZIP)
- 11,218
Population outlook (Marion County) Hauer SSP2
- Today (2025)
- 36,071 people
- By 2030
- 34,598 · -4.1%
- By 2040
- 31,754 · -12.0%
- By 2050
- 28,912 · -19.8%
- By 2075
- 22,527 · -37.5%
- By 2100
- 16,455 · -54.4%
Race, ethnicity, and origin ACS 2023
- Neighborhood character
- Predominantly White (93%)
- Race & ethnicity
- White 93% Black 3% Two or more races 2%
- Common ancestry
- Romanian 2% Italian 2% Iranian 2%
- Foreign-born
- 1%
- Languages at home
- 99% English-only · Spanish 1%
Political lean MEDSL · Marion
- 2024 margin
- Solid R (+49.5) · D 24.6% · R 74.1% · Other 1.4%
- 2008→2024 swing
- -47.5pp toward R · 2008: -2.0pp · 2024: -49.5pp
- All cycles
- 2024: R+49.5 2020: R+46.6 2016: R+44.9 2012: R+19.2 2008: R+2.0
Not yet ingested
- Civics
- —
Market trends
- HPI YoY
- ▼ -63.16%
- Current HPI
- 162.55
- Rent YoY
- —
- Metro
- —
- State GDP YoY
- ▲ 1.59%
- F500 in state
- 60
Industry mix (Fortune 500 HQ in IL)
| Industry | F500 HQs | Revenue |
|---|---|---|
| Insurance | 4 | $201B |
|
||
| Consumer Goods | 4 | $87B |
|
||
| Industrial Machinery | 3 | $64B |
|
||
| Healthcare | 2 | $55B |
|
||
| Retail / Pharmacy | 1 | $148B |
|
||
| Agriculture / Food | 1 | $86B |
|
||
Price history
+0.3% since first listed16 events — show timeline
- 2026-05-04 Pending — MRED as Distributed by MLS Grid
- 2026-05-01 Relisted — MRED as Distributed by MLS Grid
- 2026-04-23 Listing Removed — MRED as Distributed by MLS Grid
- 2026-04-07 Relisted — MRED as Distributed by MLS Grid
- 2026-01-12 Pending — MRED as Distributed by MLS Grid
- 2025-12-16 Price Changed — RMLSA as Distributed by MLS Grid
- 2025-12-16 Relisted — RMLSA as Distributed by MLS Grid
- 2025-12-16 Listing Removed — RMLSA as Distributed by MLS Grid
- 2025-11-26 Contingent — RMLSA as Distributed by MLS Grid
- 2025-11-15 Price Changed — RMLSA as Distributed by MLS Grid
- 2025-10-23 Listed — RMLSA as Distributed by MLS Grid
- 2017-07-18 Sold (MLS) — MARIS as Distributed by MLS Grid
- 2017-07-18 Sold (MLS) $30,000 RMLSA as Distributed by MLS Grid
- 2017-07-18 Sold (MLS) $30,000 MRED as Distributed by MLS Grid
- 2017-04-15 Listed $29,900 RMLSA as Distributed by MLS Grid
- 2017-04-15 Listed $29,900 MRED as Distributed by MLS Grid
Property tax history
-0.3%/yrLatest (2024): $1,479 · -2.0% YoY. Source: county tax records.
Cash-flow waterfall
monthlySold comps — $/sqft
last 12 mo · ≤1 miLoading sold comps…