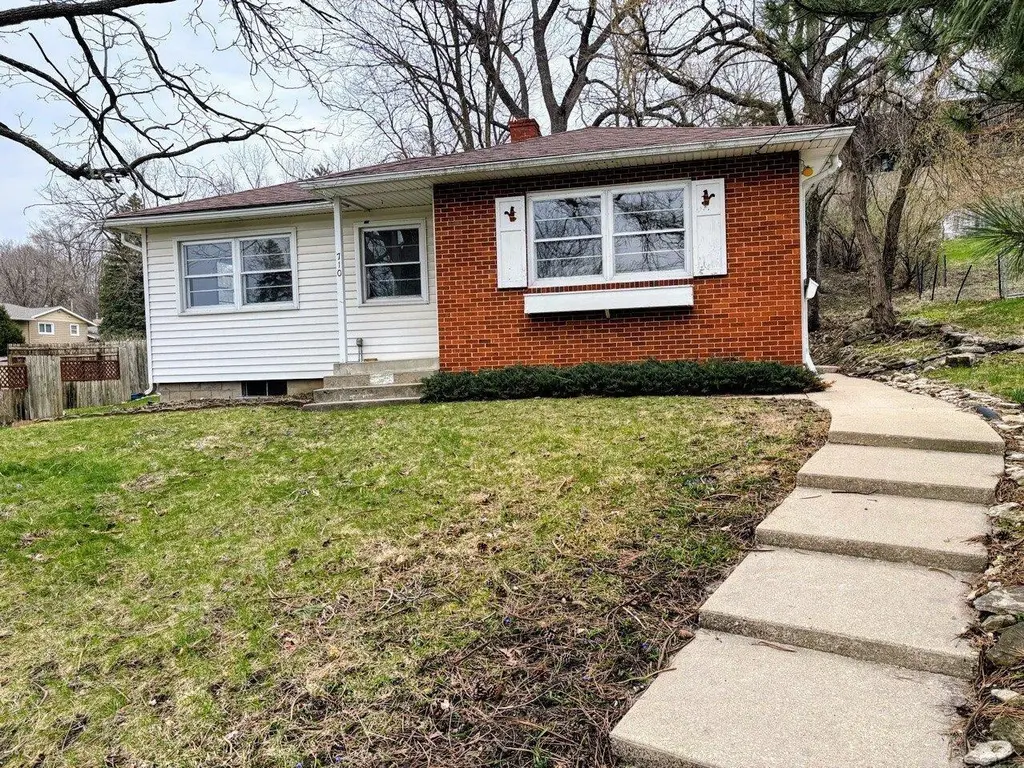
710 Pine St · Decorah, IA
Flood risk 1/10 · Minimal
- FEMA flood zone
- —
- Chance of flooding over 30 yrs
- 0.0%
- Est. flood insurance / yr
- —
Fire risk 1/10 · Minimal
- Est. fire insurance / yr
- $902 – $1,676
Heat risk 2/10 · Minimal
- Hot days now (above 100°F)
- 7 days/yr
- Hot days in 30 yrs
- 15 days/yr
Wind risk 2/10 · Minimal
- Chance of severe wind over 30 yrs
- —
Air-quality risk 1/10 · Minimal
- Unhealthy air days now
- 0 days/yr
- Unhealthy air days in 30 yrs
- 0 days/yr
Risk factors via First Street. Map © Google.
Why this score? — see what drove the F grade
The composite is a weighted blend of 9 inputs, each scored 0–100. Each bar is that input's sub-score; the figure is the points it added to the 100-point composite (weight × sub-score).
- Cash flow +10.9/30.0
- Schools +7.0/10.0
- Livability +4.2/5.0
- 1% rule +3.3/10.0
- DSCR +3.2/10.0
- Rent growth +2.5/5.0
- Condition / age +2.5/5.0
- ARV discount +0.0/15.0
- Appreciation +0.0/10.0
$149,000
🖨 Deal sheet 📄 Offer letter ✓ Due diligence
Listing remarks
This Decorah home has plenty of potential for someone ready to put their own touch on it. The hardwood floors add character and charm, and the layout offers 2 bedrooms plus a bonus room that would work well as an office, nursery, or flex space. With an unfinished basement and a location close to downtown Decorah, this property is a great opportunity for a buyer looking for value, potential, and the chance to make a home their own. The property is being sold as-is and priced at $149,000. Call today to view this home.
Key facts
- Unfinished basement
- Hardwood floors
- 8,580 sq ft lot
Tags
Neighborhood map
What this means for you Summary
Snapshot
- This is a 2-bed/1.0-bath single-family listed at $149k.
Deal economics
- At list price, monthly cash flow is $-65 ($-775/yr) — negative.
- To cash-flow at today's rent, offer at most $138k (7.7% below list).
- To meet the 1% rule (rent ≥ 1% of price), the offer needs to be $123k (17.2% below list).
- Recommended offer: $123k (17.2% below list) — sets the bar for 1% rule.
- Cap rate 5.8% vs local median 3.4% in Decorah — top-decile yield for the area; either an underpriced asset or a hidden risk that comps aren't pricing in. Stress-test before assuming the spread holds.
Location & tenants
- Location reads 85/100 on livability (#16 in IA, #499 nationally) — a professional / high-income tenant draw. Strengths: crime A+, cost of living A+, housing A+; Watch: amenities F, commute F.
- Decorah Community School District (town): math 80% / reading 84% proficiency, ranked #21 of 289 in IA (top 7%) — strong family-tenant draw, lease renewals of 3-5y typical; only 18% free/reduced lunch — higher-income household profile.
- Zoned schools: Decorah Middle School (math 77% / reading 83%, grade A+, #32 of 246 statewide, top 13%, 461 students, 26% FRL); Decorah High School (math 85% / reading 92%, grade A, #3 of 336 statewide, top 1%, 576 students, 22% FRL).
- Market conditions: 75 active listings in the ZIP; 49 units permitted in Winneshiek County in 2024 (0 in 5+ unit buildings).
Forward outlook
- Local home prices are declining (-3.0%/yr); year-one equity from $1k of loan paydown is wiped out by about $4k of value loss. Plan a longer hold.
- Winneshiek County population projected at -15% by 2050 — secular population decline; favor cash flow + early exit over multi-decade hold.
Negotiation context
- Only 1 days on market — expect competitive offers; lowballing is unlikely to land.
Risks & watch-outs
- Watch-outs: built in 1950 — expect roof / HVAC / electrical / plumbing capex.
Questions for the listing agent
- What do current leases actually rent for vs. the listed asking? Can we see a recent rent roll and the last 12 months of T-12 income?
- Built in 1950 — when were the roof, HVAC, electrical panel, plumbing, and water heater last replaced?
- Is there a deadline driving the sale (1031 exchange, divorce, estate, relocation)? That informs how much negotiation room exists.
- Schools are A-rated — typically a magnet for longer-tenancy family renters. What's the average tenant stay here, and is there a school-zone premium baked into asking?
- The area grade is low — what's the realistic commute time and amenity access for the typical tenant pool here? Any planned neighborhood developments (good or bad) we should know about?
- What's the average days-on-market for RENTAL listings here right now (not sales)? A rising rental-DOM trend means longer vacancies and softer asking-rent achievability than the comps imply.
- What's the recent tenant-quality profile in this submarket — average credit score on applications, eviction rate, late-payment / NSF rate, and stable-employment percentage? A property-management company in the area should have these aggregated.
- How much new for-sale + rental construction is in the pipeline within 1–3 miles? Heavy new supply typically softens prices + rents 12–24 months out; constrained supply supports both.
Investment metrics
- 1% rule
- 0.83% ✗
- Cap rate
- 5.77%
- Cash-on-cash
- -1.86%
- DSCR
- 0.92
- GRM
- 10.1
CMA / ARV
- ARV (on-the-fly)
- $117,177
- Comps found
- 7
Show comp detail 7 sales within ~0.75 mi
| Address | Dist | Beds/Ba | Sqft | Sold | Price | $/sf | Match |
|---|---|---|---|---|---|---|---|
| 710 Pine St | 0.00mi | 2/2.0 | 843 (0%) | 1mo | $145,000 | $172 | 96 |
| 201 St. Lawrence St | 0.16mi | 2/1.0 | 828 (-2%) | 7mo | $55,600 | $67 | 83 |
| 614 Day St | 0.09mi | 2/1.0 | 768 (-9%) | 2mo | $95,000 | $124 | 80 |
| 204 Day St | 0.37mi | 2/1.0 | 938 (+11%) | 9mo | $135,000 | $144 | 56 |
| 309 Day St | 0.27mi | 3/1.0 (+1) | 968 (+15%) | 8mo | $75,000 | $77 | 51 |
| 602 Oak St | 0.33mi | 2/1.0 | 968 (+15%) | 14mo | $134,900 | $139 | 48 |
| 714 South Ave Ave | 0.65mi | 1/1.0 (-1) | 716 (-15%) | 6mo | $170,000 | $237 | 35 |
Match score weights: distance 35% · size 25% · config 20% · recency 20%. Top-matched comps best support the ARV.
Projected returns pro-forma
-3.0% appreciation · 3.0% rent growth · sell at horizon
- IRR
- -19.3%
- Equity multiple
- 0.32×
- Total profit
- $-28,231
- Equity at exit
- $22,216
- IRR
- -12.0%
- Equity multiple
- 0.29×
- Total profit
- $-29,776
- Equity at exit
- $12,883
Cash invested: $41,720 (down + closing). Projections, not guarantees.
Landlord ↔ Tenant lean methodology
- Overall (STATE)
- 83 Strongly Landlord-Friendly
- State Iowa
- 83 Strongly Landlord-Friendly · R+6
- County
- — inherits STATE
- City
- — inherits STATE
ZIP-level market 52101
- Home prices YoY
- -26.7%
- Active inventory
- 75
- Price-to-rent
- 10.1×
Monthly cashflow live
- Estimated rent
- $1,234 medium interval (Pro) →
- Mortgage (P&I)
- −$781
- Tax from tax record
- −$196 /mo · $2,354/yr
- Insurance
- −$62
- HOA
- −$0
- Vacancy / Maint / Mgmt
- −$259
- Net cashflow
- $-65
Break-even live
UW: 25.0% down · 7.5% · 30yr · 1.5% tax · 5.0% vac · 8.0% maint · 8.0% mgmt
Financing live
Cash to close
- Down payment
- $37,250
- Closing costs
- $4,470
- Reserves months
- —
- Total cash needed
- —
Loan-product check · same deal, 3 products live
Conventional
25% down · 7.5% · 30yr
- Down + closing
- —
- Monthly P&I
- —
- Monthly cashflow
- —
- DSCR
- —
- Eligible?
- —
Personal DTI + credit; lowest rate.
DSCR
20% down · 8.5% · 30yr
- Down + closing
- —
- Monthly P&I
- —
- Monthly cashflow
- —
- DSCR
- —
- Eligible?
- —
No personal income docs; deal must DSCR.
Hard money
10% down · 12.0% · 12mo
- Down + closing
- —
- Monthly P&I
- —
- Monthly cashflow
- —
- DSCR
- —
- Eligible?
- —
Short-term bridge; refi at stabilization.
Listing history 2 events
-
2026-04-14status Pending
-
2026-04-13$149,000 Active
ⓘ Source: listings_history table (triggers on properties + properties_extension) + one-shot
backfill from property_details.listing_events for pre-trigger history.
Tax reassessment forecast IA · Partial reset (capped growth)
- Current annual tax
- $2,354 · $196/mo
- Projected year-2 tax
- $2,354 · $196/mo
- Expected delta
- $0/yr ($0/mo · 0.0%)
ⓘ Screening estimate from a state-policy table — verify with the county assessor before closing.
Climate risk First Street
- Flood 1/10 Low 0% chance over 30 yrs
- Wildfire 1/10 Low
- Heat 2/10 Low 7 d/yr ≥100°F today · 15 d/yr by 30 yrs out
- Wind 2/10 Low
- Air quality 1/10 Low 0 unhealthy d/yr today · 0 by 30 yrs out
Nearby sold comps map
Loading sold comps map…
Walkable amenities ~0.75 mi
Loading nearby amenities…
Taxation est. · year 1
- Rental income
- $14,811
- − Mortgage interest
- −$8,346
- − Property taxes
- −$2,354
- − Insurance
- −$745
- − Repairs & maintenance
- −$1,185
- − Management
- −$1,185
- − Depreciation
- −$4,335
- Taxable loss
- −$3,338
- Est. tax savings @ 24.0%
- +$801
- After-tax cash flow
- $27/yr
For passive investors: Depreciation is non-cash, so a rental often shows a tax loss while cash-flowing — sheltering income. Rental losses are passive: they offset passive income freely, and up to $25,000/yr can offset ordinary (W-2) income if you actively participate and your MAGI is under $100k (phasing out to $0 by $150k); unused losses carry forward. On sale, claimed depreciation is recaptured at up to 25%, and gains may owe capital-gains tax (a 1031 exchange can defer both). Figures are a year-1 estimate at your 24.0% rate — not tax advice; consult a CPA.
Schools (NCES district)
- District
- Decorah Community School District
- NCES district ID
- 1908730
- Math proficiency
- 80% ▼ -4.00%
- Reading proficiency
- 84% ▬ 0.00%
- Median HH income
- $54,304
- Composite
- 69.72/100
- National rank
- #294
- State rank
- #21 of 289 in IA
Livability — Decorah
- Score
- 85/100
- State rank
- #16
- US rank
- #499
Category grades
Schools grade is shown separately in the Schools card above.
Census & demographics
- Census place
- Decorah, IA
- County
- Winneshiek County · 12,706 people
- City population
- 12,706
- Metro
- nan
- Population (ZIP)
- 12,706
- Household income
- $73,484
- Rent vs Own
- Severe rent burden
- 207.0
Population outlook (Winneshiek County) Hauer SSP2
- Today (2025)
- 20,379 people
- By 2030
- 19,937 · -2.2%
- By 2040
- 18,697 · -8.3%
- By 2050
- 17,392 · -14.7%
- By 2075
- 14,921 · -26.8%
- By 2100
- 12,836 · -37.0%
Race, ethnicity, and origin ACS 2023
- Neighborhood character
- Predominantly White (95%)
- Race & ethnicity
- White 95% Two or more races 2% Hispanic / Latino 2%
- Common ancestry
- Portuguese 25% Iranian 1% Lithuanian 1%
- Foreign-born
- 3% · Canada
- Languages at home
- 96% English-only · Spanish 1% Other Asian/Pacific 1%
Political lean MEDSL · Winneshiek
- 2024 margin
- Lean R (+9.3) · D 44.6% · R 53.9% · Other 1.5%
- 2008→2024 swing
- -31.9pp toward R · 2008: 22.7pp · 2024: -9.3pp
- All cycles
- 2024: R+9.3 2020: R+5.1 2016: R+0.8 2012: D+14.8 2008: D+22.7
Not yet ingested
- Civics
- —
Market trends
- HPI YoY
- ▼ -69.20%
- Current HPI
- 189.63
- Rent YoY
- —
- Metro
- nan
- State GDP YoY
- ▲ 2.48%
- F500 in state
- 4
Industry mix (Fortune 500 HQ in IA)
| Industry | F500 HQs | Revenue |
|---|---|---|
| Financial Services | 1 | $16B |
|
||
| Retail / Convenience | 1 | $15B |
|
||
Price history
2 events — show timeline
- 2026-04-14 Pending — NEIRBR as distributed by MLS GRID
- 2026-04-13 Listed $149,000 NEIRBR as distributed by MLS GRID
Property tax history
+4.2%/yrLatest (2025): $2,354 · +4.2% YoY. Source: county tax records.
Cash-flow waterfall
monthlySold comps — $/sqft
last 12 mo · ≤1 miLoading sold comps…