33036 Maple Ln · Running Springs, CA
Flood risk 1/10 · Minimal
- FEMA flood zone
- X (unshaded)
- Chance of flooding over 30 yrs
- 0.0%
- Est. flood insurance / yr
- $473 – $860
Fire risk 8/10 · Major
- Est. fire insurance / yr
- $659 – $1,223
Heat risk 1/10 · Minimal
- Hot days now (above 83°F)
- 1 days/yr
- Hot days in 30 yrs
- 2 days/yr
Wind risk 1/10 · Minimal
- Chance of severe wind over 30 yrs
- —
Air-quality risk 10/10 · Severe
- Unhealthy air days now
- 35 days/yr
- Unhealthy air days in 30 yrs
- 45 days/yr
Risk factors via First Street. Map © Google.
Why this score? — see what drove the D+ grade
The composite is a weighted blend of 9 inputs, each scored 0–100. Each bar is that input's sub-score; the figure is the points it added to the 100-point composite (weight × sub-score).
- ARV discount +15.0/15.0
- Cash flow +13.9/30.0
- DSCR +4.2/10.0
- Livability +3.3/5.0
- Appreciation +3.0/10.0
- 1% rule +2.9/10.0
- Rent growth +2.5/5.0
- Condition / age +2.5/5.0
- Schools +2.1/10.0
$299,000
🖨 Deal sheet (PDF) 📄 Offer letter ✓ Due diligence
Listing remarks MLS
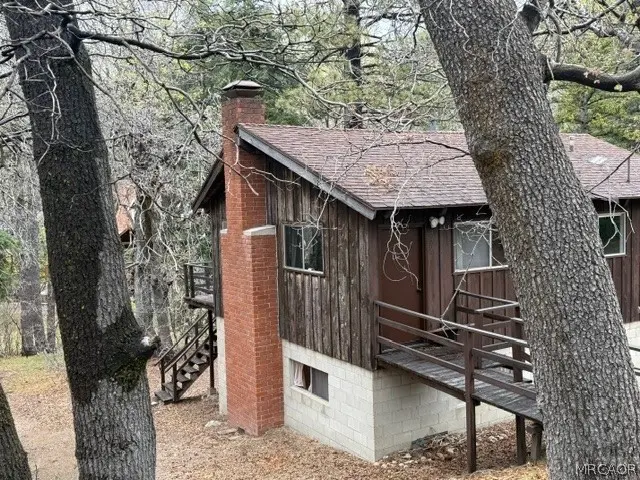
Back on the Market. Priced to sell! One of the best locations! Just steps to the lake. Peaceful natural settings, Cabin offers 4 bedrooms and 2 baths perfect for a large family, one bedroom and one bath on main floor with just over 1300 square feet of living space. Cabin offers perfect blend of rustic warmth, the floor plan is filled with natural light and centered around a classic brick wood burning fireplace located in the living room adding warmth and ambiance to the main living area-perfect for cozy mountain evenings. The main level master bedroom provides convenance and ease of living, while downstairs you will find 3 more bedrooms and a full bath offering plenty of space for family and guest. Step outside to enjoy wooden decks overlooking the property with tall pines and oak trees. Whether hosting gatherings on warm summer nights or enjoying a quiet morning in the mountain fresh air. Green Valley Lake is the highest mountain community located in the San Bernardino Mountains "Above the Clouds" Lake offers boating, fishing and swimming along with miles of hiking and biking trails.
Key facts
- Steps to the lake
- Wooden decks
- 7,920 sq ft lot
Tags
Property features AI
Finance
- Other: One unit (single-family); No common walls; No ADU; Elevation approximately 7,000 feet; Living area and year-built sourced from assessor
Exterior
- Parking: Off-street parking; Unpaved driveway
- Utilities: Public sewer; District/public water
- Home design: House; Two stories; Entry at street level; Has view
- Construction: Composition roof; Finished basement
- Exterior features: Front porch; Wood exterior elements; Deck; Has patio; Mountainous setting; Lake nearby; BLM/National Forest nearby; Biking, hiking, fishing, and hunting recreational opportunities
Interior
- Kitchen: Gas cooktop; Gas range; Gas oven; Microwave; Gas water heater
- Bedrooms: Main floor bedroom (1 on main level)
- Bathrooms: 2 full bathrooms; 1 bathroom on main level
- Heating & cooling: Forced air heating; Wood-burning fireplace in living room
- Interior features: Beamed ceilings; High (9+ ft) ceilings; Ceiling fan; Living room deck attached; Formica counters; Furnished
- Laundry & utility: Laundry room inside; Individual laundry room; Washer included; Dryer included; Washer hookup; Gas dryer hookup
Neighborhood map
What this means for you Summary
Snapshot
- This is a 4-bed/2.0-bath single-family listed at $299k.
Deal economics
- At list price, monthly cash flow is $34 ($403/yr) — positive.
- The deal already cash-flows at list — no discount required.
- To meet the 1% rule (rent ≥ 1% of price), the offer needs to be $235k (21.4% below list).
- Recommended offer: $235k (21.4% below list) — sets the bar for 1% rule.
- Cap rate 6.4% vs local median 3.9% in Running Springs — top-decile yield for the area; either an underpriced asset or a hidden risk that comps aren't pricing in. Stress-test before assuming the spread holds.
Location & tenants
- Location reads 66/100 on livability (#333 in CA) — a middle-class / working-renter tenant base. Strengths: housing A+, employment A-; Watch: crime C-, amenities F, cost of living F.
- Rim Of The World Unified (town): math 13% / reading 34% proficiency, ranked #415 of 517 in CA (top 80%) — low school quality limits family demand, transient renter base, plan for 1-2y turnover.
- Zoned schools: Charles Hoffman Elementary (295 students, 54% FRL); Mary P. Henck Intermediate (math 13% / reading 36%, grade F, #277 of 498 statewide, top 73%, 585 students, 61% FRL); Rim of The World Senior High (math 12% / reading 32%, grade F, #950 of 1,170 statewide, top 82%, 917 students, 52% FRL).
- Market conditions: 57 active listings in the ZIP; 5,458 units permitted in San Bernardino County in 2024 (1,500 in 5+ unit buildings).
Forward outlook
- Local home prices are declining (-3.0%/yr); year-one equity from $2k of loan paydown is wiped out by about $9k of value loss. Plan a longer hold.
- San Bernardino County population projected at +15% by 2050 — modest demand growth; plan on rents tracking national, not racing it.
Negotiation context
- It's been on market 23 days — a 2% lower offer ($295k) is reasonable based on typical stale-listing flexibility.
- 5 sale attempts with the ask held roughly flat each time — persistent listings suggest the price (not the market) is what's stuck; bring a comps-based counter.
Risks & watch-outs
- Climate carrying-cost: severe wildfire risk — expect insurance premiums to compound above CPI over the hold.
Questions for the listing agent
- Built in 1963 — when were the roof, HVAC, electrical panel, plumbing, and water heater last replaced?
- Is there a deadline driving the sale (1031 exchange, divorce, estate, relocation)? That informs how much negotiation room exists.
- Schools are D-rated, which usually means shorter tenancies and higher turnover. Who's the typical renter profile here, and what's been the actual vacancy rate?
- The area grade is low — what's the realistic commute time and amenity access for the typical tenant pool here? Any planned neighborhood developments (good or bad) we should know about?
- What's the average days-on-market for RENTAL listings here right now (not sales)? A rising rental-DOM trend means longer vacancies and softer asking-rent achievability than the comps imply.
- What's the recent tenant-quality profile in this submarket — average credit score on applications, eviction rate, late-payment / NSF rate, and stable-employment percentage? A property-management company in the area should have these aggregated.
- How much new for-sale + rental construction is in the pipeline within 1–3 miles? Heavy new supply typically softens prices + rents 12–24 months out; constrained supply supports both.
Investment metrics
- 1% rule
- 0.79% ✗
- Cap rate
- 6.43%
- Cash-on-cash
- 0.48%
- DSCR
- 1.02
- GRM
- 10.6
CMA / ARV
- ARV (median comp)
- $409,773
- List price
- $299,000
- Delta
- -27.03%
- Verdict
- UNDERPRICED
- Comps
- 20 within 1.0 mi
Show comp detail 12 sales within ~0.75 mi
| Address | Dist | Beds/Ba | Sqft | Sold | Price | $/sf | Match |
|---|---|---|---|---|---|---|---|
| 32953 Juniper Ln | 0.12mi | 3/1.0 (-1) | 1,294 (-2%) | 11mo | $340,000 | $263 | 72 |
| 33019 Juniper Ln | 0.04mi | 3/2.0 (-1) | 1,500 (+14%) | 7mo | $414,000 | $276 | 65 |
| 33007 Spruce Dr | 0.16mi | 3/2.0 (-1) | 1,507 (+14%) | 3mo | $315,000 | $209 | 61 |
| 33436 Bluebird | 0.51mi | 3/2.0 (-1) | 1,231 (-7%) | 1mo | $368,000 | $299 | 60 |
| 33254 Wild Rose Dr | 0.29mi | 3/1.5 (-1) | 1,440 (+9%) | 8mo | $285,000 | $198 | 58 |
| 33474 Angeles Dr | 0.58mi | 3/2.0 (-1) | 1,224 (-7%) | 2mo | $239,500 | $196 | 54 |
| 33435 Falling Leaf Dr | 0.56mi | 3/1.5 (-1) | 1,220 (-8%) | 2mo | $347,000 | $284 | 52 |
| 33389 Wild Cherry Dr | 0.46mi | 3/2.0 (-1) | 1,479 (+12%) | 4mo | $410,000 | $277 | 51 |
| 33298 Holcomb Creek Dr | 0.44mi | 3/1.5 (-1) | 1,200 (-9%) | 13mo | $385,000 | $321 | 46 |
| 33236 Juniper Ln | 0.28mi | 4/2.5 | 1,512 (+14%) | 18mo | $365,000 | $241 | 46 |
| 33469 Squirrel Dr | 0.57mi | 3/1.5 (-1) | 1,196 (-9%) | 10mo | $337,000 | $282 | 43 |
| 32514 San Antonio Dr | 0.66mi | 3/2.0 (-1) | 1,376 (+4%) | 19mo | $235,000 | $171 | 41 |
Match score weights: distance 35% · size 25% · config 20% · recency 20%. Top-matched comps best support the ARV.
Projected returns pro-forma
-3.0% appreciation · 3.0% rent growth · sell at horizon
- IRR
- -15.6%
- Equity multiple
- 0.45×
- Total profit
- $-46,428
- Equity at exit
- $44,582
- IRR
- -7.2%
- Equity multiple
- 0.54×
- Total profit
- $-38,140
- Equity at exit
- $25,852
Cash invested: $83,720 (down + closing). Projections, not guarantees.
Landlord ↔ Tenant lean methodology
- Overall (STATE)
- 18 Strongly Tenant-Friendly
- State California
- 18 Strongly Tenant-Friendly · D+13
- County
- — inherits STATE
- City
- — inherits STATE
ZIP-level market 92341
- Home prices YoY
- -1.1%
- Active inventory
- 57
- Price-to-rent
- 10.6×
Monthly cashflow live
- Estimated rent
- $2,350 medium interval (Pro) →
- Mortgage (P&I)
- −$1,568
- Tax from tax record
- −$130 /mo · $1,564/yr
- Insurance
- −$125
- HOA
- −$0
- Vacancy / Maint / Mgmt
- −$493
- Net cashflow
- $34
Break-even live
Sensitivity live
| Price | -10% $203 | -5% $118 | +0% $34 | +5% $-51 | +10% $-136 |
|---|---|---|---|---|---|
| Rent | -10% $-152 | -5% $-59 | +0% $34 | +5% $126 | +10% $219 |
| Rate | -1.0pp $184 | -0.5pp $110 | base $34 | +0.5pp $-44 | +1.0pp $-123 |
UW: 25.0% down · 7.5% · 30yr · 1.5% tax · 5.0% vac · 8.0% maint · 8.0% mgmt
Financing live
Cash to close
- Down payment
- $74,750
- Closing costs
- $8,970
- Reserves months
- —
- Total cash needed
- —
Loan-product check · same deal, 3 products live
Conventional
25% down · 7.5% · 30yr
- Down + closing
- —
- Monthly P&I
- —
- Monthly cashflow
- —
- DSCR
- —
- Eligible?
- —
Personal DTI + credit; lowest rate.
DSCR
20% down · 8.5% · 30yr
- Down + closing
- —
- Monthly P&I
- —
- Monthly cashflow
- —
- DSCR
- —
- Eligible?
- —
No personal income docs; deal must DSCR.
Hard money
10% down · 12.0% · 12mo
- Down + closing
- —
- Monthly P&I
- —
- Monthly cashflow
- —
- DSCR
- —
- Eligible?
- —
Short-term bridge; refi at stabilization.
Listing history 12 events
-
2026-06-21statusdays on market $299,000 Pending Sale 23 DOM
-
2026-06-18days on market $299,000 Active 22 DOM
-
2026-06-17days on market $299,000 Active 21 DOM
-
2026-06-16days on market $299,000 Active 20 DOM
-
2026-06-15days on market $299,000 Active 19 DOM
-
2026-06-13days on market $299,000 Active 17 DOM
-
2026-06-13days on market $299,000 Active 16 DOM
-
2026-06-10status $299,000 Active 13 DOM
-
2026-05-09status Active 1121-char remark
-
2026-05-07historical 1121-char remark
-
2026-05-05$299,000 Active 1121-char remark
Show marketing remark (1115 chars)
Back on the Market. Priced to sell! One of the best locations! Just steps to the lake. Peaceful natural settings, Cabin offers 4 bedrooms and 2 baths perfect for a large family, one bedroom and one bath on main floor with just over 1300 square feet of living space. Cabin offers perfect blend of rustic warmth, the floor plan is filled with natural light and centered around a classic brick wood burning fireplace located in the living room adding warmth and ambiance to the main living area-perfect for cozy mountain evenings. The main level master bedroom provides convenance and ease of living, while downstairs you will find 3 more bedrooms and a full bath offering plenty of space for family and guest. Step outside to enjoy wooden decks overlooking the property with tall pines and oak trees. Whether hosting gatherings on warm summer nights or enjoying a quiet morning in the mountain fresh air. Green Valley Lake is the highest mountain community located in the San Bernardino Mountains "Above the Clouds" Lake offers boating, fishing and swimming along with miles of hiking and biking trails.
-
2026-05-05$299,000 Active 1095-char remark
Show marketing remark (1115 chars)
Back on the Market. Priced to sell! One of the best locations! Just steps to the lake. Peaceful natural settings, Cabin offers 4 bedrooms and 2 baths perfect for a large family, one bedroom and one bath on main floor with just over 1300 square feet of living space. Cabin offers perfect blend of rustic warmth, the floor plan is filled with natural light and centered around a classic brick wood burning fireplace located in the living room adding warmth and ambiance to the main living area-perfect for cozy mountain evenings. The main level master bedroom provides convenance and ease of living, while downstairs you will find 3 more bedrooms and a full bath offering plenty of space for family and guest. Step outside to enjoy wooden decks overlooking the property with tall pines and oak trees. Whether hosting gatherings on warm summer nights or enjoying a quiet morning in the mountain fresh air. Green Valley Lake is the highest mountain community located in the San Bernardino Mountains "Above the Clouds" Lake offers boating, fishing and swimming along with miles of hiking and biking trails.
ⓘ Source: listings_history table (triggers on properties + properties_extension) + one-shot
backfill from property_details.listing_events for pre-trigger history.
Tax reassessment forecast CA · Resets to sale price
- Current annual tax
- $1,564 · $130/mo
- Projected year-2 tax
- $2,272 · $189/mo
- Expected delta
- +$708/yr (+$59/mo · 45.3%)
ⓘ Screening estimate from a state-policy table — verify with the county assessor before closing.
Climate risk First Street
- Flood 1/10 Low FEMA zone X (unshaded) · 0% chance over 30 yrs
- Wildfire 8/10 Severe
- Heat 1/10 Low 1 d/yr ≥83°F today · 2 d/yr by 30 yrs out
- Wind 1/10 Low
- Air quality 10/10 Extreme 35 unhealthy d/yr today · 45 by 30 yrs out
Nearby sold comps map
Loading sold comps map…
Walkable amenities ~0.75 mi
Loading nearby amenities…
Taxation est. · year 1
- Rental income
- $28,200
- − Mortgage interest
- −$16,749
- − Property taxes
- −$1,564
- − Insurance
- −$1,495
- − Repairs & maintenance
- −$2,256
- − Management
- −$2,256
- − Depreciation
- −$8,698
- Taxable loss
- −$4,818
- Est. tax savings @ 24.0%
- +$1,156
- After-tax cash flow
- $1,559/yr
For passive investors: Depreciation is non-cash, so a rental often shows a tax loss while cash-flowing — sheltering income. Rental losses are passive: they offset passive income freely, and up to $25,000/yr can offset ordinary (W-2) income if you actively participate and your MAGI is under $100k (phasing out to $0 by $150k); unused losses carry forward. On sale, claimed depreciation is recaptured at up to 25%, and gains may owe capital-gains tax (a 1031 exchange can defer both). Figures are a year-1 estimate at your 24.0% rate — not tax advice; consult a CPA.
Schools (NCES district)
- District
- Rim Of The World Unified
- NCES district ID
- 0632610
- Math proficiency
- 13% ▼ -10.00%
- Reading proficiency
- 34% ▼ -7.00%
- Median HH income
- $55,860
- Composite
- 21.29/100
- National rank
- #8389
- State rank
- #415 of 517 in CA
Livability — Running Springs
- Score
- 66/100
- State rank
- #333
- US rank
- #11396
Category grades
Schools grade is shown separately in the Schools card above.
Census & demographics
- City population
- 5,215
- Population (ZIP)
- 299
Population outlook (San Bernardino County) Hauer SSP2
- Today (2025)
- 2,300,329 people
- By 2030
- 2,378,907 · +3.4%
- By 2040
- 2,523,137 · +9.7%
- By 2050
- 2,642,388 · +14.9%
- By 2075
- 2,880,769 · +25.2%
- By 2100
- 2,909,436 · +26.5%
Race, ethnicity, and origin ACS 2023
- Neighborhood character
- Diverse neighborhood (Simpson 0.60)
- Race & ethnicity
- White 53% Hispanic / Latino 27% Asian 20% Two or more races 13%
- Hispanic origin (detail)
- Mexican 23%
- Common ancestry
- Polish 13% Italian 5% Russian 4%
- Foreign-born
- 20% · Vietnam, Canada
- Languages at home
- 73% English-only · Vietnamese 20% Spanish 7%
Political lean MEDSL · San Bernardino
- 2024 margin
- Toss-up / Even · D 47.5% · R 49.7% · Other 2.8%
- 2008→2024 swing
- -8.5pp toward R · 2008: 6.3pp · 2024: -2.1pp
- All cycles
- 2024: R+2.1 2020: D+10.7 2016: D+9.8 2012: D+5.4 2008: D+6.3
Not yet ingested
- Civics
- —
Market trends
- HPI YoY
- ▼ -4.04%
- Current HPI
- 369.4917
- Rent YoY
- —
- Metro
- —
- State GDP YoY
- ▲ 3.21%
- F500 in state
- 116
Industry mix (Fortune 500 HQ in CA)
| Industry | F500 HQs | Revenue |
|---|---|---|
| Technology | 27 | $1,492B |
|
||
| Financial Services | 3 | $174B |
|
||
| Retail | 3 | $44B |
|
||
| Insurance | 3 | $26B |
|
||
| Media / Entertainment | 2 | $115B |
|
||
| Pharmaceuticals / Biotech | 2 | $62B |
|
||
Price history
+0.0% since first listed8 events — show timeline
- 2026-06-09 Relisted — CRMLS
- 2026-06-09 Relisted — MRCAOR
- 2026-05-30 Pending — MRCAOR
- 2026-05-21 Pending — CRMLS
- 2026-05-09 Relisted — CRMLS
- 2026-05-07 Listing Removed — CRMLS
- 2026-05-05 Listed $299,000 MRCAOR
- 2026-05-05 Listed $299,000 CRMLS
Property tax history
+2.3%/yrLatest (2025): $1,564 · +3.2% YoY. Source: county tax records.
Cash-flow waterfall
monthlySold comps — $/sqft
last 12 mo · ≤1 miLoading sold comps…