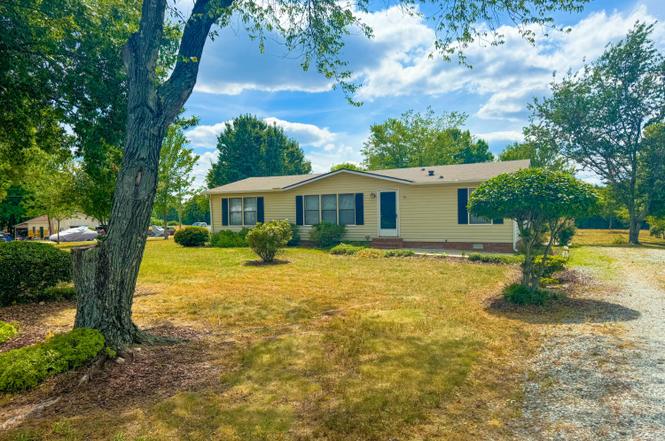
1417 Jack Hambrick Rd · Roxboro, NC
Flood risk 1/10 · Minimal
- FEMA flood zone
- X (unshaded)
- Chance of flooding over 30 yrs
- 0.0%
- Est. flood insurance / yr
- $473 – $860
Fire risk 3/10 · Minor
- Est. fire insurance / yr
- $906 – $1,684
Heat risk 6/10 · Moderate
- Hot days now (above 104°F)
- 7 days/yr
- Hot days in 30 yrs
- 17 days/yr
Wind risk 5/10 · Moderate
- Chance of severe wind over 30 yrs
- 22.0%
Air-quality risk 2/10 · Minimal
- Unhealthy air days now
- 1 days/yr
- Unhealthy air days in 30 yrs
- 2 days/yr
Risk factors via First Street. Map © Google.
Why this score? — see what drove the B grade
The composite is a weighted blend of 9 inputs, each scored 0–100. Each bar is that input's sub-score; the figure is the points it added to the 100-point composite (weight × sub-score).
- Cash flow +26.9/30.0
- Appreciation +10.0/10.0
- DSCR +9.3/10.0
- ARV discount +7.5/15.0
- 1% rule +7.3/10.0
- Schools +3.4/10.0
- Livability +2.8/5.0
- Rent growth +2.5/5.0
- Condition / age +2.5/5.0
$222,500
🖨 Deal sheet 📄 Offer letter ✓ Due diligence
Listing remarks MLS
Affordable home in nice neighborhood!
Key facts
- Plenty of cabinets
- Walk in closet
- Backyard views
Tags
Property features AI
Finance
- Other: Lot size approximately 0.91 acres
- HOA & community: No association
Exterior
- Utilities: Well water; Septic tank
- Home design: Manufactured house; One story
- Construction: Vinyl siding; Brick/mortar foundation; Shingle roof; Built as a manufactured home
- Exterior features: Deck
Interior
- Kitchen: Range; Refrigerator
- Bedrooms: 3 bedrooms (all on the main level)
- Flooring: Carpet; Luxury vinyl
- Bathrooms: 2 full bathrooms
- Heating & cooling: No heating specified; Central air conditioning
- Interior features: Ceiling fans; Double vanities; Open floor plan
- Laundry & utility: Laundry closet
Neighborhood map
What this means for you Summary
Snapshot
- This is a 3-bed/2.0-bath manufactured listed at $222k.
Deal economics
- At list price, monthly cash flow is $617 ($7k/yr) — positive.
- The deal already cash-flows at list — no discount required.
- Meets the 1% rule at list price ($3k rent vs $222k).
- Cap rate 9.6% vs local median 4.5% in Roxboro — top-decile yield for the area; either an underpriced asset or a hidden risk that comps aren't pricing in. Stress-test before assuming the spread holds.
Location & tenants
- Location reads 55/100 on livability (#649 in NC) — a working-class tenant base; expect higher turnover. Strengths: cost of living A+; Watch: schools D-, crime F, amenities F.
- Person County Schools (rural): math 39% / reading 42% proficiency, ranked #110 of 178 in NC (top 62%) — families likely to look elsewhere, expect single-tenant / working-renter base with shorter leases.
- Market conditions: 128 active listings in the ZIP; 113 units permitted in Person County in 2024 (0 in 5+ unit buildings).
Forward outlook
- In year one you build about $24k of equity ($2k loan paydown + $22k appreciation (10.0% local appreciation)).
- Person County population projected at -15% by 2050 — secular population decline; favor cash flow + early exit over multi-decade hold.
- At projected returns (10.0% appreciation + 3.0% rent growth), your $62k cash investment doubles in ~2 years — after that, you're playing with house money.
- By year 2, paydown + projected appreciation supports a ~$38k cash-out refi (75% LTV) — recoverable capital for the next deal without selling this one.
Negotiation context
- Only 1 days on market — expect competitive offers; lowballing is unlikely to land.
- 5 sale attempts since 23y ago with the ask held roughly flat each time — persistent listings suggest the price (not the market) is what's stuck; bring a comps-based counter.
- Current owner paid $41k; list at $222k implies a 443% gain — meaningful room to come down on a strong offer.
Risks & watch-outs
- Climate carrying-cost: moderate wind risk, 22% chance of damaging wind over 30y; extreme-heat days projected 7→17/yr by 2055 (HVAC capex compounding) — expect insurance premiums to compound above CPI over the hold.
Questions for the listing agent
- Is there a deadline driving the sale (1031 exchange, divorce, estate, relocation)? That informs how much negotiation room exists.
- Schools are D-rated, which usually means shorter tenancies and higher turnover. Who's the typical renter profile here, and what's been the actual vacancy rate?
- Crime grade is F in this area — have there been break-ins, vandalism, or insurance claims at this property in the last 3 years? What carrier currently insures it and at what premium?
- What's the average days-on-market for RENTAL listings here right now (not sales)? A rising rental-DOM trend means longer vacancies and softer asking-rent achievability than the comps imply.
- What's the recent tenant-quality profile in this submarket — average credit score on applications, eviction rate, late-payment / NSF rate, and stable-employment percentage? A property-management company in the area should have these aggregated.
- How much new for-sale + rental construction is in the pipeline within 1–3 miles? Heavy new supply typically softens prices + rents 12–24 months out; constrained supply supports both.
Investment metrics
- 1% rule
- 1.23% ✓
- Cap rate
- 9.62%
- Cash-on-cash
- 11.88%
- DSCR
- 1.53
- GRM
- 6.8
CMA / ARV
No comps found within radius.
Projected returns pro-forma
10.0% appreciation · 3.0% rent growth · sell at horizon
- IRR
- 33.0%
- Equity multiple
- 3.58×
- Total profit
- $160,516
- Equity at exit
- $200,446
- IRR
- 28.5%
- Equity multiple
- 8.09×
- Total profit
- $441,873
- Equity at exit
- $432,269
Cash invested: $62,300 (down + closing). Projections, not guarantees.
Landlord ↔ Tenant lean methodology
- Overall (STATE)
- 85 Strongly Landlord-Friendly
- State North Carolina
- 85 Strongly Landlord-Friendly · R+3
- County
- — inherits STATE
- City
- — inherits STATE
ZIP-level market 27574
- Home prices YoY
- 8.5%
- Active inventory
- 128
- Price-to-rent
- 6.8×
Monthly cashflow live
- Estimated rent
- $2,727 medium interval (Pro) →
- Mortgage (P&I)
- −$1,167
- Tax est. 1.5%
- −$278 /mo · $3,338/yr
- Insurance
- −$93
- HOA
- −$0
- Vacancy / Maint / Mgmt
- −$573
- Net cashflow
- $617
Break-even live
UW: 25.0% down · 7.5% · 30yr · 1.5% tax · 5.0% vac · 8.0% maint · 8.0% mgmt
Financing live
Cash to close
- Down payment
- $55,625
- Closing costs
- $6,675
- Reserves months
- —
- Total cash needed
- —
Loan-product check · same deal, 3 products live
Conventional
25% down · 7.5% · 30yr
- Down + closing
- —
- Monthly P&I
- —
- Monthly cashflow
- —
- DSCR
- —
- Eligible?
- —
Personal DTI + credit; lowest rate.
DSCR
20% down · 8.5% · 30yr
- Down + closing
- —
- Monthly P&I
- —
- Monthly cashflow
- —
- DSCR
- —
- Eligible?
- —
No personal income docs; deal must DSCR.
Hard money
10% down · 12.0% · 12mo
- Down + closing
- —
- Monthly P&I
- —
- Monthly cashflow
- —
- DSCR
- —
- Eligible?
- —
Short-term bridge; refi at stabilization.
Listing history 2 events
-
2026-06-17remarks 306-char remark
-
2026-06-17$222,500 Active 1 DOM
ⓘ Source: listings_history table (triggers on properties + properties_extension) + one-shot
backfill from property_details.listing_events for pre-trigger history.
Climate risk First Street
- Flood 1/10 Low FEMA zone X (unshaded) · 0% chance over 30 yrs
- Wildfire 3/10 Moderate
- Heat 6/10 Major 7 d/yr ≥104°F today · 17 d/yr by 30 yrs out
- Wind 5/10 Major 22% chance of damaging wind over 30 yrs
- Air quality 2/10 Low 1 unhealthy d/yr today · 2 by 30 yrs out
Nearby sold comps map
Loading sold comps map…
Walkable amenities ~0.75 mi
Loading nearby amenities…
Taxation est. · year 1
- Rental income
- $32,728
- − Mortgage interest
- −$12,463
- − Property taxes
- −$3,338
- − Insurance
- −$1,112
- − Repairs & maintenance
- −$2,618
- − Management
- −$2,618
- − Depreciation
- −$6,473
- Taxable income
- $4,106
- Est. tax owed @ 24.0%
- −$985
- After-tax cash flow
- $6,418/yr
For passive investors: Depreciation is non-cash, so a rental often shows a tax loss while cash-flowing — sheltering income. Rental losses are passive: they offset passive income freely, and up to $25,000/yr can offset ordinary (W-2) income if you actively participate and your MAGI is under $100k (phasing out to $0 by $150k); unused losses carry forward. On sale, claimed depreciation is recaptured at up to 25%, and gains may owe capital-gains tax (a 1031 exchange can defer both). Figures are a year-1 estimate at your 24.0% rate — not tax advice; consult a CPA.
Schools (NCES district)
- District
- Person County Schools
- NCES district ID
- 3703630
- Math proficiency
- 39% ▬ 0.00%
- Reading proficiency
- 42% ▲ 2.00%
- Median HH income
- $43,729
- Composite
- 34.3/100
- National rank
- #5242
- State rank
- #110 of 178 in NC
Livability — Roxboro
- Score
- 55/100
- State rank
- #649
- US rank
- #23536
Category grades
Schools grade is shown separately in the Schools card above.
Census & demographics
- City population
- 11,954
- Population (ZIP)
- 14,163
Population outlook (Person County) Hauer SSP2
- Today (2025)
- 38,577 people
- By 2030
- 37,847 · -1.9%
- By 2040
- 35,740 · -7.4%
- By 2050
- 32,683 · -15.3%
- By 2075
- 24,979 · -35.2%
- By 2100
- 15,779 · -59.1%
Race, ethnicity, and origin ACS 2023
- Neighborhood character
- Predominantly White (68%)
- Race & ethnicity
- White 68% Black 28% Two or more races 3% Hispanic / Latino 2%
- Common ancestry
- Italian 2% Slovak 1% Serbian 1%
- Foreign-born
- 1% · Canada
- Languages at home
- 98% English-only · Spanish 2%
Political lean MEDSL · Person
- 2024 margin
- Strong R (+23.7) · D 37.7% · R 61.4%
- 2008→2024 swing
- -15.2pp toward R · 2008: -8.5pp · 2024: -23.7pp
- All cycles
- 2024: R+23.7 2020: R+21.6 2016: R+17.3 2012: R+11.0 2008: R+8.5
Not yet ingested
- Civics
- —
Market trends
- HPI YoY
- ▲ 21.68%
- Current HPI
- 276.8767
- Rent YoY
- —
- Metro
- —
- State GDP YoY
- ▲ 3.28%
- F500 in state
- 26
Industry mix (Fortune 500 HQ in NC)
| Industry | F500 HQs | Revenue |
|---|---|---|
| Financial Services | 2 | $213B |
|
||
| Retail | 2 | $95B |
|
||
| Industrial Conglomerate | 1 | $38B |
|
||
| Metals / Steel | 1 | $35B |
|
||
| Utilities | 1 | $30B |
|
||
| Industrial Machinery | 1 | $19B |
|
||
Price history
+232.1% since first listed13 events — show timeline
- 2026-06-17 Listed $222,500 TMLS
- 2023-11-29 Price Changed $10,000 TMLS
- 2006-08-20 Sold (MLS) $41,000 AMLSNC
- 2006-08-20 Sold (MLS) $41,000 TMLS
- 2006-06-27 Listing Removed — TMLS
- 2006-06-09 Listed $44,000 AMLSNC
- 2006-06-09 Listed $44,000 TMLS
- 2003-06-12 Sold (MLS) $66,000 AMLSNC
- 2003-06-12 Sold (MLS) $66,000 TMLS
- 2003-04-22 Listing Removed — TMLS
- 2003-04-22 Price Changed $67,000 TMLS
- 2003-01-07 Listed $67,000 AMLSNC
- 2003-01-07 Listed $67,000 TMLS
Property tax history
+2.2%/yrLatest (2023): $423 · +0.3% YoY. Source: county tax records.
Cash-flow waterfall
monthlySold comps — $/sqft
last 12 mo · ≤1 miLoading sold comps…