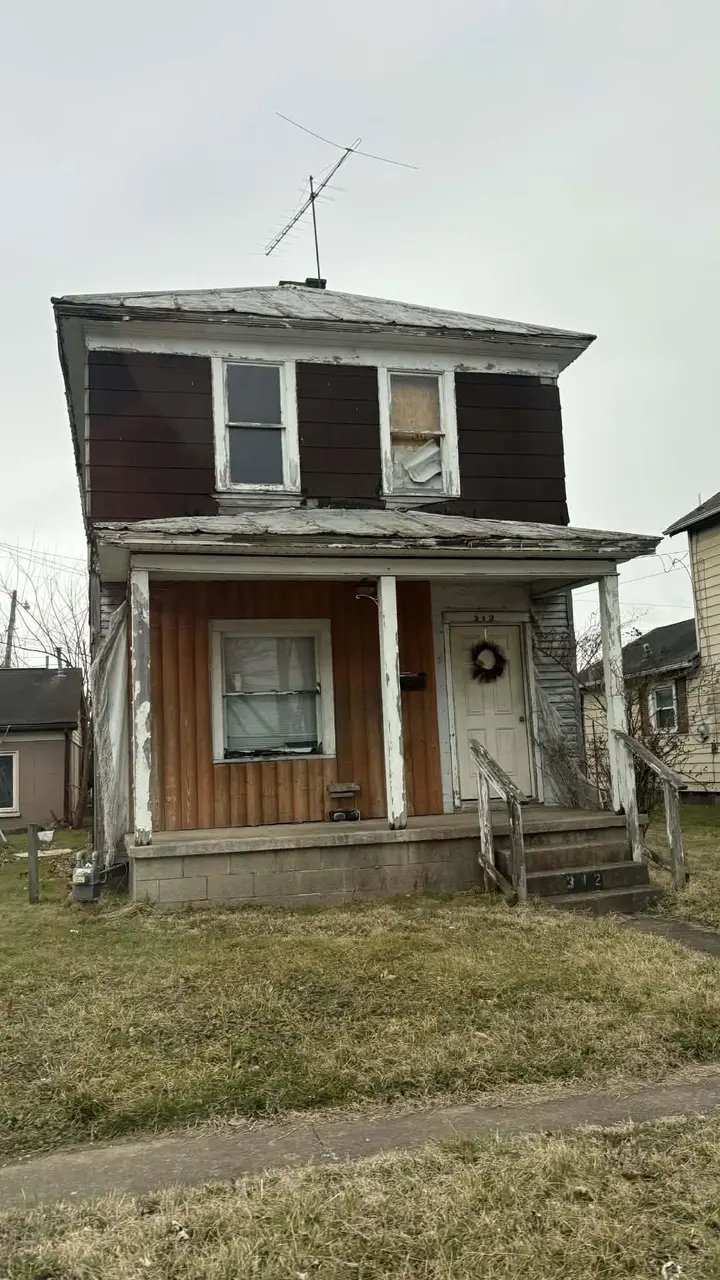
312 13th St · Kenova, WV
Flood risk 1/10 · Minimal
- FEMA flood zone
- X
- Chance of flooding over 30 yrs
- 0.0%
- Est. flood insurance / yr
- $507 – $1,088
Fire risk 4/10 · Minor
- Est. fire insurance / yr
- $787 – $1,461
Heat risk 5/10 · Moderate
- Hot days now (above 102°F)
- 7 days/yr
- Hot days in 30 yrs
- 20 days/yr
Wind risk 2/10 · Minimal
- Chance of severe wind over 30 yrs
- 1.0%
Air-quality risk 2/10 · Minimal
- Unhealthy air days now
- 0 days/yr
- Unhealthy air days in 30 yrs
- 1 days/yr
Risk factors via First Street. Map © Google.
Why this score? — see what drove the B+ grade
The composite is a weighted blend of 9 inputs, each scored 0–100. Each bar is that input's sub-score; the figure is the points it added to the 100-point composite (weight × sub-score).
- Cash flow +30.0/30.0
- 1% rule +10.0/10.0
- DSCR +10.0/10.0
- Appreciation +10.0/10.0
- ARV discount +7.5/15.0
- Livability +4.2/5.0
- Schools +2.6/10.0
- Rent growth +2.5/5.0
- Condition / age +2.5/5.0
$25,000
🖨 Deal sheet 📄 Offer letter ✓ Due diligence
Listing remarks MLS
Investors special! Great potential! Bring your goggles and envision this diamond in the rough. With some TLC, you could have nice hardwood floors and woodwork throughout the house. Tall ceilings make the rooms feel very spacious. Lots of character with the claw foot soaking bathtub and original wood doors and knobs. Nice flat yard and could have off street parking. Natural gas in the neighborhood. Cheaper than renting. Selling "as is". CASH ONLY!
Key facts
- Original wood doors
- Off street parking
- Hardwood floors
Tags
Neighborhood map
What this means for you Summary
Snapshot
- This is a 4-bed/1.0-bath single-family listed at $25k.
Deal economics
- At list price, monthly cash flow is $637 ($8k/yr) — positive.
- The deal already cash-flows at list — no discount required.
- Meets the 1% rule at list price ($1k rent vs $25k).
- Recommended offer: $23k (9.0% below list) — sets the bar for market timing.
Location & tenants
- Location reads 84/100 on livability (#6 in WV, #796 nationally) — a professional / high-income tenant draw. Strengths: crime A+, commute A+, cost of living A+; Watch: schools F, employment D-.
- Wayne County Schools (rural): math 25% / reading 38% proficiency, ranked #25 of 55 in WV (top 46%) — families likely to look elsewhere, expect single-tenant / working-renter base with shorter leases.
- Market conditions: 25 active listings in the ZIP; 67 units permitted in Wayne County in 2024 (0 in 5+ unit buildings).
Forward outlook
- In year one you build about $3k of equity ($173 loan paydown + $2k appreciation (10.0% local appreciation)).
- Wayne County population projected at -22% by 2050 — secular population decline; favor cash flow + early exit over multi-decade hold.
- At projected returns (10.0% appreciation + 3.0% rent growth), your $7k cash investment doubles in ~1 year — after that, you're playing with house money.
- By year 10, paydown + projected appreciation supports a ~$32k cash-out refi (75% LTV) — recoverable capital for the next deal without selling this one.
Negotiation context
- It's been on market 100 days — a 9% lower offer ($23k) is reasonable based on typical stale-listing flexibility.
Risks & watch-outs
- Watch-outs: built in 1930 — expect roof / HVAC / electrical / plumbing capex.
- Climate carrying-cost: extreme-heat days projected 7→20/yr by 2055 (HVAC capex compounding) — expect insurance premiums to compound above CPI over the hold.
Questions for the listing agent
- It's been on market 100 days. Have you received any prior offers? Is the seller open to a 9% concession, seller financing, or rate buy-down credit?
- Built in 1930 — when were the roof, HVAC, electrical panel, plumbing, and water heater last replaced?
- Why hasn't it sold? Are there any deal-killer items the seller is aware of (foundation, flood, title, zoning, code violations)?
- Is there a deadline driving the sale (1031 exchange, divorce, estate, relocation)? That informs how much negotiation room exists.
- Schools are F-rated, which usually means shorter tenancies and higher turnover. Who's the typical renter profile here, and what's been the actual vacancy rate?
- What's the average days-on-market for RENTAL listings here right now (not sales)? A rising rental-DOM trend means longer vacancies and softer asking-rent achievability than the comps imply.
- What's the recent tenant-quality profile in this submarket — average credit score on applications, eviction rate, late-payment / NSF rate, and stable-employment percentage? A property-management company in the area should have these aggregated.
- How much new for-sale + rental construction is in the pipeline within 1–3 miles? Heavy new supply typically softens prices + rents 12–24 months out; constrained supply supports both.
Investment metrics
- 1% rule
- 4.13% ✓
- Cap rate
- 36.88%
- Cash-on-cash
- 109.26%
- DSCR
- 5.86
- GRM
- 2.0
CMA / ARV
- ARV (median comp)
- $141,024
- List price
- $25,000
- Delta
- -82.27%
- Verdict
- UNDERPRICED
- Comps
- 20 within 1.0 mi
Show comp detail 12 sales within ~0.75 mi
| Address | Dist | Beds/Ba | Sqft | Sold | Price | $/sf | Match |
|---|---|---|---|---|---|---|---|
| 212 13th St | 0.06mi | 3/2.0 (-1) | 1,481 (-2%) | 1mo | $120,000 | $81 | 84 |
| 214 15th St | 0.17mi | 3/2.0 (-1) | 1,540 (+2%) | 2mo | $170,000 | $110 | 78 |
| 411 15th St | 0.20mi | 3/1.5 (-1) | 1,465 (-3%) | 12mo | $183,000 | $125 | 69 |
| 217 17th St | 0.37mi | 3/2.0 (-1) | 1,542 (+2%) | 3mo | $140,000 | $91 | 68 |
| 304 15th St | 0.17mi | 3/2.0 (-1) | 1,383 (-8%) | 6mo | $115,000 | $83 | 64 |
| 1625 Poplar St | 0.34mi | 3/2.0 (-1) | 1,614 (+7%) | 3mo | $30,000 | $19 | 62 |
| 1717 Pine St | 0.45mi | 3/2.0 (-1) | 1,400 (-7%) | 4mo | $85,000 | $61 | 54 |
| 1613 Maple St | 0.46mi | 3/2.0 (-1) | 1,711 (+13%) | 0mo | $72,500 | $42 | 48 |
| 1710 Poplar St | 0.40mi | 3/1.5 (-1) | 1,656 (+10%) | 14mo | $125,500 | $76 | 47 |
| 844 Barger Hill Rd | 0.55mi | 3/2.0 (-1) | 1,706 (+13%) | 0mo | $275,000 | $161 | 44 |
| 10 N Oakview Dr | 0.61mi | 4/1.5 | 1,711 (+13%) | 11mo | $165,000 | $96 | 38 |
| 1821 Pine St | 0.55mi | 3/2.5 (-1) | 1,679 (+11%) | 12mo | $225,000 | $134 | 35 |
Match score weights: distance 35% · size 25% · config 20% · recency 20%. Top-matched comps best support the ARV.
Projected returns pro-forma
10.0% appreciation · 3.0% rent growth · sell at horizon
- IRR
- —
- Equity multiple
- 8.75×
- Total profit
- $54,226
- Equity at exit
- $22,522
- IRR
- —
- Equity multiple
- 19.26×
- Total profit
- $127,803
- Equity at exit
- $48,570
Cash invested: $7,000 (down + closing). Projections, not guarantees.
Landlord ↔ Tenant lean methodology
- Overall (STATE)
- 83 Strongly Landlord-Friendly
- State West Virginia
- 83 Strongly Landlord-Friendly · R+22
- County
- — inherits STATE
- City
- — inherits STATE
ZIP-level market 25530
- Home prices YoY
- 7.7%
- Active inventory
- 25
- Price-to-rent
- 2.0×
Monthly cashflow live
- Estimated rent
- $1,032 medium interval (Pro) →
- Mortgage (P&I)
- −$131
- Tax from tax record
- −$36 /mo · $436/yr
- Insurance
- −$10
- HOA
- −$0
- Vacancy / Maint / Mgmt
- −$217
- Net cashflow
- $637
Break-even live
UW: 25.0% down · 7.5% · 30yr · 1.5% tax · 5.0% vac · 8.0% maint · 8.0% mgmt
Financing live
Cash to close
- Down payment
- $6,250
- Closing costs
- $750
- Reserves months
- —
- Total cash needed
- —
Loan-product check · same deal, 3 products live
Conventional
25% down · 7.5% · 30yr
- Down + closing
- —
- Monthly P&I
- —
- Monthly cashflow
- —
- DSCR
- —
- Eligible?
- —
Personal DTI + credit; lowest rate.
DSCR
20% down · 8.5% · 30yr
- Down + closing
- —
- Monthly P&I
- —
- Monthly cashflow
- —
- DSCR
- —
- Eligible?
- —
No personal income docs; deal must DSCR.
Hard money
10% down · 12.0% · 12mo
- Down + closing
- —
- Monthly P&I
- —
- Monthly cashflow
- —
- DSCR
- —
- Eligible?
- —
Short-term bridge; refi at stabilization.
Listing history 17 events
-
2026-06-19days on market $25,000 Active 100 DOM
-
2026-06-18days on market $25,000 Active 99 DOM
-
2026-06-17days on market $25,000 Active 98 DOM
-
2026-06-16days on market $25,000 Active 97 DOM
-
2026-06-15days on market $25,000 Active 96 DOM
-
2026-06-14days on market $25,000 Active 94 DOM
-
2026-06-12days on market $25,000 Active 93 DOM
-
2026-06-09days on market $25,000 Active 90 DOM
-
2026-06-08days on market $25,000 Active 89 DOM
-
2026-06-07days on market $25,000 Active 88 DOM
-
2026-06-05pricedays on market $25,000 Active 85 DOM
-
2026-06-03days on market $30,000 Active 84 DOM
-
2026-06-02days on market $30,000 Active 83 DOM
-
2026-06-01days on market $30,000 Active 82 DOM
-
2026-05-31days on market $30,000 Active 81 DOM
-
2026-05-30days on market $30,000 Active 80 DOM
-
2026-03-10$30,000 Active 462-char remark
Show marketing remark (462 chars)
Investors special! Great potential! Bring your goggles and envision this diamond in the rough. With some TLC, you could have nice hardwood floors and woodwork throughout the house. Tall ceilings make the rooms feel very spacious. Lots of character with the claw foot soaking bathtub and original wood doors and knobs. Nice flat yard and could have off street parking. Natural gas in the neighborhood. Cheaper than renting. Selling "as is". CASH ONLY!
ⓘ Source: listings_history table (triggers on properties + properties_extension) + one-shot
backfill from property_details.listing_events for pre-trigger history.
Tax reassessment forecast WV · Resets to sale price
- Current annual tax
- $436 · $36/mo
- Projected year-2 tax
- $436 · $36/mo
- Expected delta
- $0/yr ($0/mo · 0.0%)
ⓘ Screening estimate from a state-policy table — verify with the county assessor before closing.
Climate risk First Street
- Flood 1/10 Low FEMA zone X · 0% chance over 30 yrs
- Wildfire 4/10 Moderate
- Heat 5/10 Major 7 d/yr ≥102°F today · 20 d/yr by 30 yrs out
- Wind 2/10 Low 100% chance of damaging wind over 30 yrs
- Air quality 2/10 Low 0 unhealthy d/yr today · 1 by 30 yrs out
Nearby sold comps map
Loading sold comps map…
Walkable amenities ~0.75 mi
Loading nearby amenities…
Taxation est. · year 1
- Rental income
- $12,382
- − Mortgage interest
- −$1,400
- − Property taxes
- −$436
- − Insurance
- −$125
- − Repairs & maintenance
- −$991
- − Management
- −$991
- − Depreciation
- −$727
- Taxable income
- $7,713
- Est. tax owed @ 24.0%
- −$1,851
- After-tax cash flow
- $5,797/yr
For passive investors: Depreciation is non-cash, so a rental often shows a tax loss while cash-flowing — sheltering income. Rental losses are passive: they offset passive income freely, and up to $25,000/yr can offset ordinary (W-2) income if you actively participate and your MAGI is under $100k (phasing out to $0 by $150k); unused losses carry forward. On sale, claimed depreciation is recaptured at up to 25%, and gains may owe capital-gains tax (a 1031 exchange can defer both). Figures are a year-1 estimate at your 24.0% rate — not tax advice; consult a CPA.
Schools (NCES district)
- District
- Wayne County Schools
- NCES district ID
- 5401500
- Math proficiency
- 25% ▼ -15.00%
- Reading proficiency
- 38% ▼ -10.00%
- Median HH income
- $36,283
- Composite
- 26.08/100
- National rank
- #7297
- State rank
- #25 of 55 in WV
Livability — Kenova
- Score
- 84/100
- State rank
- #6
- US rank
- #796
Category grades
Schools grade is shown separately in the Schools card above.
Census & demographics
- Census place
- Kenova, WV
- Population (ZIP)
- 6,642
Population outlook (Wayne County) Hauer SSP2
- Today (2025)
- 38,267 people
- By 2030
- 36,578 · -4.4%
- By 2040
- 33,034 · -13.7%
- By 2050
- 29,671 · -22.5%
- By 2075
- 22,901 · -40.2%
- By 2100
- 17,421 · -54.5%
Race, ethnicity, and origin ACS 2023
- Neighborhood character
- Predominantly White (94%)
- Race & ethnicity
- White 94% Two or more races 4% Black 2%
- Common ancestry
- Scottish 4% Italian 4% Serbian 2%
Political lean MEDSL · Wayne
- 2024 margin
- Solid R (+53.4) · D 22.4% · R 75.8% · Other 1.8%
- 2008→2024 swing
- -35.1pp toward R · 2008: -18.2pp · 2024: -53.4pp
- All cycles
- 2024: R+53.4 2020: R+50.1 2016: R+51.3 2012: R+27.0 2008: R+18.2
Not yet ingested
- Civics
- —
Market trends
- HPI YoY
- ▲ 14.35%
- Current HPI
- 201.9673
- Rent YoY
- —
- Metro
- —
- State GDP YoY
- —
- F500 in state
- 0
Price history
1 event — show timeline
- 2026-03-10 Listed $30,000 HBRMLS
Property tax history
-0.9%/yrLatest (2025): $436 · +9.7% YoY. Source: county tax records.
Cash-flow waterfall
monthlySold comps — $/sqft
last 12 mo · ≤1 miLoading sold comps…