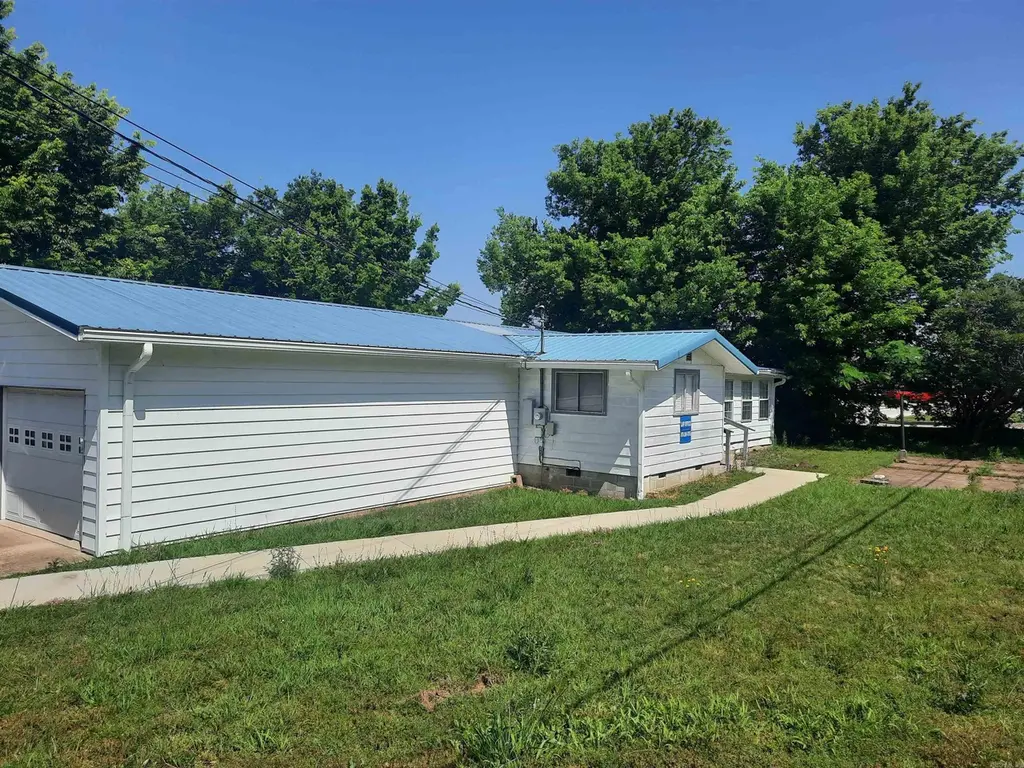
201 S Hwy 5 · Mountain View, AR
Flood risk 1/10 · Minimal
- FEMA flood zone
- X
- Chance of flooding over 30 yrs
- 0.0%
- Est. flood insurance / yr
- $507 – $1,088
Fire risk 5/10 · Moderate
- Est. fire insurance / yr
- $1,499 – $2,785
Heat risk 5/10 · Moderate
- Hot days now (above 106°F)
- 7 days/yr
- Hot days in 30 yrs
- 19 days/yr
Wind risk 2/10 · Minimal
- Chance of severe wind over 30 yrs
- 4.0%
Air-quality risk 2/10 · Minimal
- Unhealthy air days now
- 0 days/yr
- Unhealthy air days in 30 yrs
- 1 days/yr
Risk factors via First Street. Map © Google.
Why this score? — see what drove the C grade
The composite is a weighted blend of 9 inputs, each scored 0–100. Each bar is that input's sub-score; the figure is the points it added to the 100-point composite (weight × sub-score).
- Cash flow +19.7/30.0
- ARV discount +15.0/15.0
- DSCR +6.2/10.0
- 1% rule +3.9/10.0
- Schools +3.1/10.0
- Livability +2.9/5.0
- Rent growth +2.5/5.0
- Condition / age +2.5/5.0
- Appreciation +0.0/10.0
$128,900
🖨 Deal sheet 📄 Offer letter ✓ Due diligence
Listing remarks
If you are looking for a home, investment property or need something commercial, here it is and at an affordable price. A nice 3-bedroom, 2 bath home plus bonus room, offers 2 car garage with paved drive, all this on a large parcel of 1.82 ac. This property is close to school, within walking distance to hospital, clinics and many more amenities. Take a look!
Key facts
- 1.82 acre lot
- Garage
- Community pool
Property features AI
Finance
- Other: Approximately 1.82 acres
- HOA & community: Community amenities include swimming pools, tennis courts, playground, picnic area, marina, golf course, fitness/bike trails, and nearby airport
Exterior
- Parking: Garage; Parking pads
- Utilities: Public sewer; Public water; Electric (municipal, Entergy); Natural gas; Private telephone service
- Home design: Single-family property
- Construction: Metal roof; Crawl space and slab/crawl combination foundation
- Exterior features: Metal/Vinyl siding; Paved road access; Sloped, wooded lot with mountain views; Not in a subdivision; Will not subdivide
Interior
- Kitchen: Free-standing stove; Refrigerator stays
- Flooring: Carpet; Wood; Vinyl
- Bathrooms: 2 full bathrooms
- Heating & cooling: Central heat; Central cooling
- Interior features: Carpet, wood, and vinyl flooring; Workshop/Craft room; Laundry room
- Laundry & utility: Laundry room (on property)
Neighborhood map
What this means for you Summary
Snapshot
- This is a 3-bed/1.0-bath single-family listed at $129k.
Deal economics
- At list price, monthly cash flow is $150 ($2k/yr) — positive.
- The deal already cash-flows at list — no discount required.
- To meet the 1% rule (rent ≥ 1% of price), the offer needs to be $115k (10.7% below list).
- Recommended offer: $115k (10.7% below list) — sets the bar for 1% rule.
- Cap rate 7.7% vs local median 2.5% in Mountain View — top-decile yield for the area; either an underpriced asset or a hidden risk that comps aren't pricing in. Stress-test before assuming the spread holds.
Location & tenants
- Location reads 58/100 on livability (#316 in AR) — a working-class tenant base; expect higher turnover. Strengths: cost of living A+; Watch: schools D-, crime D-, amenities F.
- Mountain View School District (rural): math 34% / reading 41% proficiency, ranked #107 of 238 in AR (top 45%) — families likely to look elsewhere, expect single-tenant / working-renter base with shorter leases.
- Market conditions: 164 active listings in the ZIP; 2 units permitted in Stone County in 2024 (0 in 5+ unit buildings).
Forward outlook
- Local home prices are declining (-3.0%/yr); year-one equity from $891 of loan paydown is wiped out by about $4k of value loss. Plan a longer hold.
- Stone County population projected to shrink 6% by 2050 — rents likely to lag national; underwrite the cash flow, not the appreciation.
Negotiation context
- It's been on market 37 days — a 3% lower offer ($125k) is reasonable based on typical stale-listing flexibility.
Risks & watch-outs
- Climate carrying-cost: moderate wildfire risk; extreme-heat days projected 7→19/yr by 2055 (HVAC capex compounding) — expect insurance premiums to compound above CPI over the hold.
Questions for the listing agent
- It's been on market 37 days. Have you received any prior offers? Is the seller open to a 11% concession, seller financing, or rate buy-down credit?
- Built in 1960 — when were the roof, HVAC, electrical panel, plumbing, and water heater last replaced?
- Is there a deadline driving the sale (1031 exchange, divorce, estate, relocation)? That informs how much negotiation room exists.
- Schools are D-rated, which usually means shorter tenancies and higher turnover. Who's the typical renter profile here, and what's been the actual vacancy rate?
- Crime grade is D in this area — have there been break-ins, vandalism, or insurance claims at this property in the last 3 years? What carrier currently insures it and at what premium?
- What's the average days-on-market for RENTAL listings here right now (not sales)? A rising rental-DOM trend means longer vacancies and softer asking-rent achievability than the comps imply.
- What's the recent tenant-quality profile in this submarket — average credit score on applications, eviction rate, late-payment / NSF rate, and stable-employment percentage? A property-management company in the area should have these aggregated.
- How much new for-sale + rental construction is in the pipeline within 1–3 miles? Heavy new supply typically softens prices + rents 12–24 months out; constrained supply supports both.
Investment metrics
- 1% rule
- 0.89% ✗
- Cap rate
- 7.69%
- Cash-on-cash
- 5.00%
- DSCR
- 1.22
- GRM
- 9.3
CMA / ARV
- ARV (median comp)
- $186,669
- List price
- $128,900
- Delta
- -30.95%
- Verdict
- UNDERPRICED
- Comps
- 6 within 1.0 mi
Projected returns pro-forma
-3.0% appreciation · 3.0% rent growth · sell at horizon
- IRR
- -8.6%
- Equity multiple
- 0.68×
- Total profit
- $-11,371
- Equity at exit
- $19,219
- IRR
- 0.9%
- Equity multiple
- 1.06×
- Total profit
- $2,175
- Equity at exit
- $11,145
Cash invested: $36,092 (down + closing). Projections, not guarantees.
Landlord ↔ Tenant lean methodology
- Overall (STATE)
- 92 Strongly Landlord-Friendly
- State Arkansas
- 92 Strongly Landlord-Friendly · R+14
- County
- — inherits STATE
- City
- — inherits STATE
ZIP-level market 72560
- Home prices YoY
- -23.2%
- Active inventory
- 164
- Price-to-rent
- 9.3×
Monthly cashflow live
- Estimated rent
- $1,151 medium interval (Pro) →
- Mortgage (P&I)
- −$676
- Tax from tax record
- −$29 /mo · $349/yr
- Insurance
- −$54
- HOA
- −$0
- Vacancy / Maint / Mgmt
- −$242
- Net cashflow
- $150
Break-even live
UW: 25.0% down · 7.5% · 30yr · 1.5% tax · 5.0% vac · 8.0% maint · 8.0% mgmt
Financing live
Cash to close
- Down payment
- $32,225
- Closing costs
- $3,867
- Reserves months
- —
- Total cash needed
- —
Loan-product check · same deal, 3 products live
Conventional
25% down · 7.5% · 30yr
- Down + closing
- —
- Monthly P&I
- —
- Monthly cashflow
- —
- DSCR
- —
- Eligible?
- —
Personal DTI + credit; lowest rate.
DSCR
20% down · 8.5% · 30yr
- Down + closing
- —
- Monthly P&I
- —
- Monthly cashflow
- —
- DSCR
- —
- Eligible?
- —
No personal income docs; deal must DSCR.
Hard money
10% down · 12.0% · 12mo
- Down + closing
- —
- Monthly P&I
- —
- Monthly cashflow
- —
- DSCR
- —
- Eligible?
- —
Short-term bridge; refi at stabilization.
Listing history 16 events
-
2026-06-19days on market $128,900 Active 37 DOM
-
2026-06-18days on market $128,900 Active 36 DOM
-
2026-06-17days on market $128,900 Active 35 DOM
-
2026-06-16days on market $128,900 Active 34 DOM
-
2026-06-15days on market $128,900 Active 33 DOM
-
2026-06-14days on market $128,900 Active 31 DOM
-
2026-06-12days on market $128,900 Active 30 DOM
-
2026-06-09days on market $128,900 Active 27 DOM
-
2026-06-08days on market $128,900 Active 26 DOM
-
2026-06-07days on market $128,900 Active 25 DOM
-
2026-06-07days on market $128,900 Active 24 DOM
-
2026-06-02days on market $128,900 Active 20 DOM
-
2026-06-01days on market $128,900 Active 19 DOM
-
2026-05-31days on market $128,900 Active 18 DOM
-
2026-05-30days on market $128,900 Active 17 DOM
-
2026-05-14$128,900 New Listing 360-char remark
ⓘ Source: listings_history table (triggers on properties + properties_extension) + one-shot
backfill from property_details.listing_events for pre-trigger history.
Tax reassessment forecast AR · Resets to sale price
- Current annual tax
- $349 · $29/mo
- Projected year-2 tax
- $825 · $69/mo
- Expected delta
- +$476/yr (+$40/mo · 136.4%)
ⓘ Screening estimate from a state-policy table — verify with the county assessor before closing.
Climate risk First Street
- Flood 1/10 Low FEMA zone X · 0% chance over 30 yrs
- Wildfire 5/10 Major
- Heat 5/10 Major 7 d/yr ≥106°F today · 19 d/yr by 30 yrs out
- Wind 2/10 Low 4% chance of damaging wind over 30 yrs
- Air quality 2/10 Low 0 unhealthy d/yr today · 1 by 30 yrs out
Nearby sold comps map
Loading sold comps map…
Walkable amenities ~0.75 mi
Loading nearby amenities…
Taxation est. · year 1
- Rental income
- $13,810
- − Mortgage interest
- −$7,220
- − Property taxes
- −$349
- − Insurance
- −$644
- − Repairs & maintenance
- −$1,105
- − Management
- −$1,105
- − Depreciation
- −$3,750
- Taxable loss
- −$363
- Est. tax savings @ 24.0%
- +$87
- After-tax cash flow
- $1,892/yr
For passive investors: Depreciation is non-cash, so a rental often shows a tax loss while cash-flowing — sheltering income. Rental losses are passive: they offset passive income freely, and up to $25,000/yr can offset ordinary (W-2) income if you actively participate and your MAGI is under $100k (phasing out to $0 by $150k); unused losses carry forward. On sale, claimed depreciation is recaptured at up to 25%, and gains may owe capital-gains tax (a 1031 exchange can defer both). Figures are a year-1 estimate at your 24.0% rate — not tax advice; consult a CPA.
Schools (NCES district)
- District
- Mountain View School District
- NCES district ID
- 0510200
- Math proficiency
- 34% ▼ -20.00%
- Reading proficiency
- 41% ▼ -13.00%
- Median HH income
- $31,281
- Composite
- 30.61/100
- National rank
- #6192
- State rank
- #107 of 238 in AR
Livability — Mountain View
- Score
- 58/100
- State rank
- #316
- US rank
- #20958
Category grades
Schools grade is shown separately in the Schools card above.
Census & demographics
- Census place
- Mountain View, AR
- City population
- 7,650
- Population (ZIP)
- 7,650
Population outlook (Stone County) Hauer SSP2
- Today (2025)
- 12,440 people
- By 2030
- 12,372 · -0.5%
- By 2040
- 12,081 · -2.9%
- By 2050
- 11,628 · -6.5%
- By 2075
- 10,863 · -12.7%
- By 2100
- 9,420 · -24.3%
Race, ethnicity, and origin ACS 2023
- Neighborhood character
- Predominantly White (89%)
- Race & ethnicity
- White 89% Two or more races 6% Hispanic / Latino 3% Native American 1%
- Common ancestry
- Slovak 4% Iranian 3% Lithuanian 1%
- Foreign-born
- 1% · Canada
- Languages at home
- 97% English-only · German/W. Germanic 2% Spanish 1%
Political lean MEDSL · Stone
- 2024 margin
- Solid R (+61.7) · D 18.1% · R 79.7% · Other 2.2%
- 2008→2024 swing
- -25.3pp toward R · 2008: -36.4pp · 2024: -61.7pp
- All cycles
- 2024: R+61.7 2020: R+57.9 2016: R+52.3 2012: R+45.2 2008: R+36.4
Not yet ingested
- Civics
- —
Market trends
- HPI YoY
- ▼ -48.20%
- Current HPI
- 159.8996
- Rent YoY
- —
- Metro
- —
- State GDP YoY
- ▲ 3.80%
- F500 in state
- 10
Industry mix (Fortune 500 HQ in AR)
| Industry | F500 HQs | Revenue |
|---|---|---|
| Retail | 1 | $681B |
|
||
| Food / Agriculture | 1 | $53B |
|
||
| Retail / Energy | 1 | $22B |
|
||
| Transportation / Logistics | 1 | $12B |
|
||
| Energy | 1 | $4B |
|
||
Price history
1 event — show timeline
- 2026-05-14 Listed $128,900 CARMLS
Cash-flow waterfall
monthlySold comps — $/sqft
last 12 mo · ≤1 miLoading sold comps…