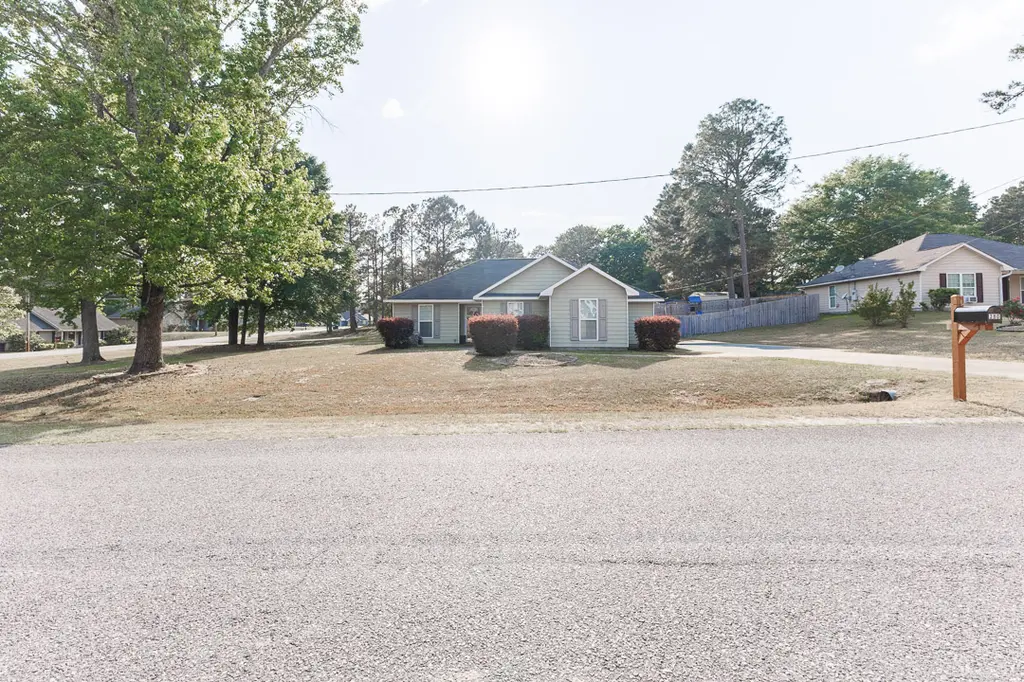
380 Lee Road 2086 · Smiths Station, AL
Flood risk 1/10 · Minimal
- FEMA flood zone
- X (unshaded)
- Chance of flooding over 30 yrs
- 0.0%
- Est. flood insurance / yr
- $507 – $1,088
Fire risk 5/10 · Moderate
- Est. fire insurance / yr
- $916 – $1,700
Heat risk 7/10 · Major
- Hot days now (above 107°F)
- 7 days/yr
- Hot days in 30 yrs
- 20 days/yr
Wind risk 6/10 · Moderate
- Chance of severe wind over 30 yrs
- 66.0%
Air-quality risk 2/10 · Minimal
- Unhealthy air days now
- 1 days/yr
- Unhealthy air days in 30 yrs
- 1 days/yr
Risk factors via First Street. Map © Google.
Why this score? — see what drove the D grade
The composite is a weighted blend of 9 inputs, each scored 0–100. Each bar is that input's sub-score; the figure is the points it added to the 100-point composite (weight × sub-score).
- Cash flow +19.1/30.0
- DSCR +6.0/10.0
- 1% rule +3.8/10.0
- Livability +3.2/5.0
- Schools +3.0/10.0
- ARV discount +2.6/15.0
- Rent growth +2.5/5.0
- Condition / age +2.5/5.0
- Appreciation +0.0/10.0
$239,900
🖨 Deal sheet (PDF) 📄 Offer letter ✓ Due diligence
Listing remarks
Welcome to this beautifully maintained 4-bedroom, 2-bath home in the desirable HaleyWoods subdivision in Salem, Alabama! Offering approximately 1,402 square feet of comfortable living space, this home is the perfect blend of style, functionality, and peace of mind. Step inside to find gorgeous hardwood floors that flow throughout the main living areas, creating a warm and inviting atmosphere. The kitchen is a standout feature, complete with stunning granite countertops that provide both elegance and durability—perfect for everyday living or entertaining guests. Major updates have already been taken care of for you, including a brand new HVAC system and newly installed ductwork, ensuri
Key facts
- Granite countertops
- Hardwood floors
- Corner lot
Tags
Property features AI
Finance
- Other: Located in the HALEY WOODS subdivision
- HOA & community: No association amenities
Exterior
- Security: Security system
- Utilities: Cable available; Electricity available; Septic tank
- Home design: Residential property; One story
- Construction: Cement siding; Slab foundation; Built as a single-level home
- Exterior features: Storage; Covered patio/porch; Privacy fencing; Corner lot
Interior
- Kitchen: Cooktop; Dishwasher; Electric range; Microwave
- Flooring: Carpet; Tile; Wood
- Bathrooms: 2 full bathrooms; 2 main-level bathrooms
- Heating & cooling: Electric heating; Central air conditioning; Ceiling fans; Electric cooling
- Interior features: Ceiling fans
- Laundry & utility: Washer hookup
Neighborhood map
What this means for you Summary
Snapshot
- This is a 3-bed/2.0-bath single-family listed at $240k.
Deal economics
- At list price, monthly cash flow is $256 ($3k/yr) — positive.
- The deal already cash-flows at list — no discount required.
- To meet the 1% rule (rent ≥ 1% of price), the offer needs to be $212k (11.5% below list).
- Recommended offer: $212k (11.5% below list) — sets the bar for 1% rule.
- Cap rate 7.6% vs local median 3.4% in Smiths Station — top-decile yield for the area; either an underpriced asset or a hidden risk that comps aren't pricing in. Stress-test before assuming the spread holds.
Location & tenants
- Location reads 65/100 on livability (#129 in AL) — a middle-class / working-renter tenant base. Strengths: cost of living A+, housing A+, crime A-; Watch: employment D, amenities F, commute F.
- Lee County (rural): math 23% / reading 47% proficiency, ranked #40 of 129 in AL (top 31%) — families likely to look elsewhere, expect single-tenant / working-renter base with shorter leases.
- Zoned schools: Wacoochee Elementary School (math 27% / reading 55%, grade F, #233 of 627 statewide, top 38%, 621 students, 58% FRL); Sanford Middle School (math 27% / reading 46%, grade F, #76 of 257 statewide, top 31%, 545 students, 74% FRL); Beauregard High School (math 17% / reading 12%, grade F, #220 of 305 statewide, top 77%, 555 students, 66% FRL) — zoned schools average 66% FRL vs 48% district-wide (18 pts higher); higher-poverty schools than district average — tighter screening recommended.
- Market conditions: 126 active listings in the ZIP; 1,858 units permitted in Lee County in 2024 (113 in 5+ unit buildings).
Forward outlook
- Local home prices are declining (-3.0%/yr); year-one equity from $2k of loan paydown is wiped out by about $7k of value loss. Plan a longer hold.
- Lee County population projected at +54% by 2050 — long-run rental-demand tailwind backs the buy-and-hold thesis.
Negotiation context
- Only 10 days on market — expect competitive offers; lowballing is unlikely to land.
- Current owner paid $120k; list at $240k implies a 100% gain — meaningful room to come down on a strong offer.
Risks & watch-outs
- Climate carrying-cost: major wind risk, 66% chance of damaging wind over 30y; moderate wildfire risk; extreme-heat days projected 7→20/yr by 2055 (HVAC capex compounding) — expect insurance premiums to compound above CPI over the hold.
Questions for the listing agent
- Is there a deadline driving the sale (1031 exchange, divorce, estate, relocation)? That informs how much negotiation room exists.
- The area grade is low — what's the realistic commute time and amenity access for the typical tenant pool here? Any planned neighborhood developments (good or bad) we should know about?
- What's the average days-on-market for RENTAL listings here right now (not sales)? A rising rental-DOM trend means longer vacancies and softer asking-rent achievability than the comps imply.
- What's the recent tenant-quality profile in this submarket — average credit score on applications, eviction rate, late-payment / NSF rate, and stable-employment percentage? A property-management company in the area should have these aggregated.
- How much new for-sale + rental construction is in the pipeline within 1–3 miles? Heavy new supply typically softens prices + rents 12–24 months out; constrained supply supports both.
Investment metrics
- 1% rule
- 0.88% ✗
- Cap rate
- 7.58%
- Cash-on-cash
- 4.58%
- DSCR
- 1.20
- GRM
- 9.4
CMA / ARV
- ARV (median comp)
- $216,177
- List price
- $239,900
- Delta
- 10.97%
- Verdict
- OVERPRICED
- Comps
- 20 within 1.0 mi
Show comp detail 11 sales within ~0.75 mi
| Address | Dist | Beds/Ba | Sqft | Sold | Price | $/sf | Match |
|---|---|---|---|---|---|---|---|
| 119 Lee Road 2191 | 0.12mi | 3/2.0 | 1,382 (-1%) | 1mo | $229,900 | $166 | 91 |
| 556 Lee Road 2087 | 0.05mi | 3/2.0 | 1,399 (-0%) | 12mo | $224,900 | $161 | 87 |
| 709 Lee Road 2087 | 0.13mi | 3/2.0 | 1,353 (-4%) | 6mo | $226,000 | $167 | 83 |
| 74 Lee Road 2191 | 0.17mi | 3/2.0 | 1,484 (+6%) | 6mo | $236,000 | $159 | 77 |
| 227 Lee Road 2086 | 0.12mi | 3/2.0 | 1,435 (+2%) | 17mo | $236,500 | $165 | 76 |
| 51 Lee Road 2191 | 0.15mi | 3/2.0 | 1,480 (+6%) | 12mo | $240,000 | $162 | 74 |
| 322 Lee Road 2086 | 0.07mi | 3/2.0 | 1,215 (-13%) | 4mo | $200,000 | $165 | 72 |
| 359 Lee Road 2087 | 0.08mi | 3/2.0 | 1,234 (-12%) | 8mo | $199,500 | $162 | 70 |
| 215 Lee Road 2086 | 0.13mi | 3/2.0 | 1,244 (-11%) | 12mo | $205,500 | $165 | 65 |
| 771 Lee Road 2087 | 0.15mi | 3/2.0 | 1,500 (+7%) | 23mo | $226,900 | $151 | 62 |
| 192 Lee Road 2086 | 0.18mi | 3/2.0 | 1,204 (-14%) | 8mo | $193,750 | $161 | 62 |
Match score weights: distance 35% · size 25% · config 20% · recency 20%. Top-matched comps best support the ARV.
Projected returns pro-forma
-3.0% appreciation · 3.0% rent growth · sell at horizon
- IRR
- -9.2%
- Equity multiple
- 0.66×
- Total profit
- $-22,655
- Equity at exit
- $35,770
- IRR
- 0.2%
- Equity multiple
- 1.01×
- Total profit
- $842
- Equity at exit
- $20,742
Cash invested: $67,172 (down + closing). Projections, not guarantees.
Landlord ↔ Tenant lean methodology
- Overall (STATE)
- 90 Strongly Landlord-Friendly
- State Alabama
- 90 Strongly Landlord-Friendly · R+15
- County
- — inherits STATE
- City
- — inherits STATE
ZIP-level market 36874
- Home prices YoY
- -28.1%
- Active inventory
- 126
- Price-to-rent
- 9.4×
Monthly cashflow live
- Estimated rent
- $2,123 medium interval (Pro) →
- Mortgage (P&I)
- −$1,258
- Tax from tax record
- −$62 /mo · $750/yr
- Insurance
- −$100
- HOA
- −$0
- Vacancy / Maint / Mgmt
- −$446
- Net cashflow
- $256
Break-even live
Sensitivity live
| Price | -10% $392 | -5% $324 | +0% $256 | +5% $189 | +10% $121 |
|---|---|---|---|---|---|
| Rent | -10% $89 | -5% $173 | +0% $256 | +5% $340 | +10% $424 |
| Rate | -1.0pp $377 | -0.5pp $317 | base $256 | +0.5pp $194 | +1.0pp $131 |
UW: 25.0% down · 7.5% · 30yr · 1.5% tax · 5.0% vac · 8.0% maint · 8.0% mgmt
Financing live
Cash to close
- Down payment
- $59,975
- Closing costs
- $7,197
- Reserves months
- —
- Total cash needed
- —
Loan-product check · same deal, 3 products live
Conventional
25% down · 7.5% · 30yr
- Down + closing
- —
- Monthly P&I
- —
- Monthly cashflow
- —
- DSCR
- —
- Eligible?
- —
Personal DTI + credit; lowest rate.
DSCR
20% down · 8.5% · 30yr
- Down + closing
- —
- Monthly P&I
- —
- Monthly cashflow
- —
- DSCR
- —
- Eligible?
- —
No personal income docs; deal must DSCR.
Hard money
10% down · 12.0% · 12mo
- Down + closing
- —
- Monthly P&I
- —
- Monthly cashflow
- —
- DSCR
- —
- Eligible?
- —
Short-term bridge; refi at stabilization.
Listing history 4 events
-
2026-05-04status Pending 1084-char remark
-
2026-04-29price $239,900 1084-char remark
-
2026-04-24$249,900 Active 1084-char remark
-
2008-11-17soldstatus $119,900
ⓘ Source: listings_history table (triggers on properties + properties_extension) + one-shot
backfill from property_details.listing_events for pre-trigger history.
Tax reassessment forecast AL · Resets to sale price
- Current annual tax
- $750 · $62/mo
- Projected year-2 tax
- $984 · $82/mo
- Expected delta
- +$234/yr (+$19/mo · 31.2%)
ⓘ Screening estimate from a state-policy table — verify with the county assessor before closing.
Climate risk First Street
- Flood 1/10 Low FEMA zone X (unshaded) · 0% chance over 30 yrs
- Wildfire 5/10 Major
- Heat 7/10 Severe 7 d/yr ≥107°F today · 20 d/yr by 30 yrs out
- Wind 6/10 Major 66% chance of damaging wind over 30 yrs
- Air quality 2/10 Low 1 unhealthy d/yr today · 1 by 30 yrs out
Nearby sold comps map
Loading sold comps map…
Walkable amenities ~0.75 mi
Loading nearby amenities…
Taxation est. · year 1
- Rental income
- $25,473
- − Mortgage interest
- −$13,438
- − Property taxes
- −$750
- − Insurance
- −$1,200
- − Repairs & maintenance
- −$2,038
- − Management
- −$2,038
- − Depreciation
- −$6,979
- Taxable loss
- −$969
- Est. tax savings @ 24.0%
- +$233
- After-tax cash flow
- $3,310/yr
For passive investors: Depreciation is non-cash, so a rental often shows a tax loss while cash-flowing — sheltering income. Rental losses are passive: they offset passive income freely, and up to $25,000/yr can offset ordinary (W-2) income if you actively participate and your MAGI is under $100k (phasing out to $0 by $150k); unused losses carry forward. On sale, claimed depreciation is recaptured at up to 25%, and gains may owe capital-gains tax (a 1031 exchange can defer both). Figures are a year-1 estimate at your 24.0% rate — not tax advice; consult a CPA.
Schools (NCES district)
- District
- Lee County
- NCES district ID
- 0102070
- Math proficiency
- 23% ▼ -27.00%
- Reading proficiency
- 47% ▬ 0.00%
- Median HH income
- $47,786
- Composite
- 30.04/100
- National rank
- #6355
- State rank
- #40 of 129 in AL
Livability — Smiths Station
- Score
- 65/100
- State rank
- #129
- US rank
- #13134
Category grades
Schools grade is shown separately in the Schools card above.
Census & demographics
- Population (ZIP)
- 10,329
Population outlook (Lee County) Hauer SSP2
- Today (2025)
- 196,440 people
- By 2030
- 217,417 · +10.7%
- By 2040
- 259,467 · +32.1%
- By 2050
- 301,557 · +53.5%
- By 2075
- 402,186 · +104.7%
- By 2100
- 474,503 · +141.6%
Race, ethnicity, and origin ACS 2023
- Neighborhood character
- Predominantly White (77%)
- Race & ethnicity
- White 77% Black 19% Hispanic / Latino 3% Two or more races 2%
- Common ancestry
- Slovak 3% Serbian 2% Lithuanian 1%
- Foreign-born
- 4% · Canada
- Languages at home
- 98% English-only · German/W. Germanic 1% Spanish 1%
Political lean MEDSL · Lee
- 2024 margin
- Strong R (+27.8) · D 35.5% · R 63.3% · Other 1.2%
- 2008→2024 swing
- -8.1pp toward R · 2008: -19.8pp · 2024: -27.8pp
- All cycles
- 2024: R+27.8 2020: R+20.1 2016: R+23.1 2012: R+19.9 2008: R+19.8
Not yet ingested
- Civics
- —
Market trends
- HPI YoY
- ▼ -85.13%
- Current HPI
- 218.2835
- Rent YoY
- —
- Metro
- —
- State GDP YoY
- ▲ 2.94%
- F500 in state
- 4
Industry mix (Fortune 500 HQ in AL)
| Industry | F500 HQs | Revenue |
|---|---|---|
| Financial Services | 1 | $8B |
|
||
| Healthcare | 1 | $5B |
|
||
Price history
+100.1% since first listed4 events — show timeline
- 2026-05-04 Pending — LCMLS
- 2026-04-29 Price Changed $239,900 LCMLS
- 2026-04-24 Listed $249,900 LCMLS
- 2008-11-17 Sold (Public Records) $119,900 Public Records
Property tax history
+1.0%/yrLatest (2025): $750 · +7.0% YoY. Source: county tax records.
Cash-flow waterfall
monthlySold comps — $/sqft
last 12 mo · ≤1 miLoading sold comps…