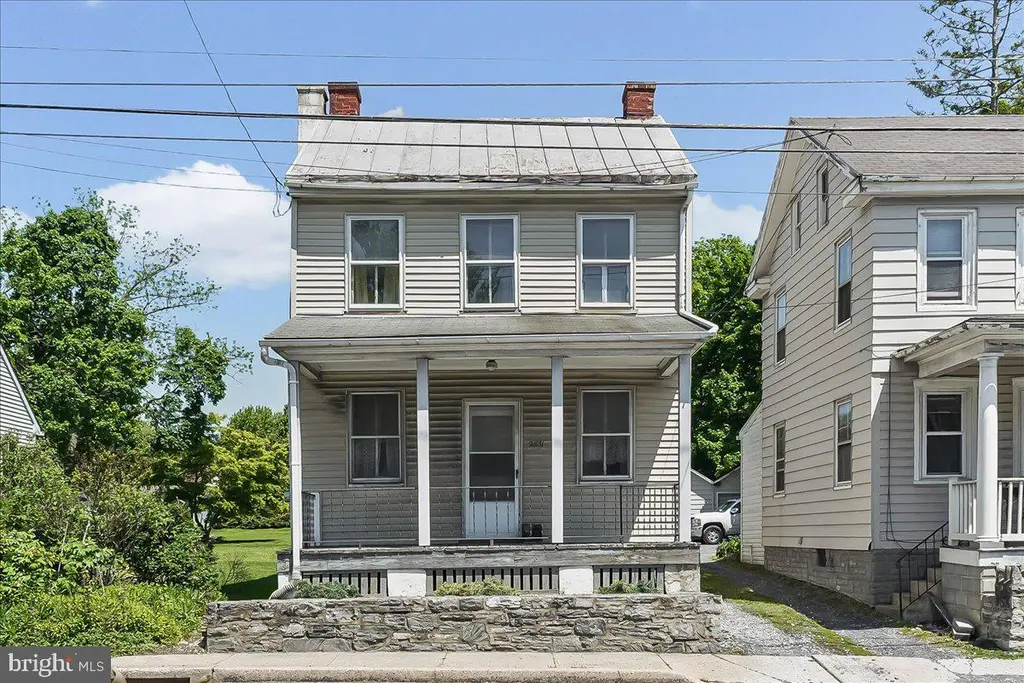
2831 Willow Street Pike · Willow Street, PA
Flood risk 1/10 · Minimal
- FEMA flood zone
- X (unshaded)
- Chance of flooding over 30 yrs
- 0.0%
- Est. flood insurance / yr
- $473 – $860
Fire risk 1/10 · Minimal
- Est. fire insurance / yr
- $511 – $949
Heat risk 6/10 · Moderate
- Hot days now (above 100°F)
- 7 days/yr
- Hot days in 30 yrs
- 15 days/yr
Wind risk 4/10 · Minor
- Chance of severe wind over 30 yrs
- 18.0%
Air-quality risk 4/10 · Minor
- Unhealthy air days now
- 4 days/yr
- Unhealthy air days in 30 yrs
- 7 days/yr
Risk factors via First Street. Map © Google.
Why this score? — see what drove the B- grade
The composite is a weighted blend of 9 inputs, each scored 0–100. Each bar is that input's sub-score; the figure is the points it added to the 100-point composite (weight × sub-score).
- Cash flow +23.7/30.0
- ARV discount +15.0/15.0
- DSCR +7.6/10.0
- 1% rule +6.7/10.0
- Schools +5.2/10.0
- Livability +3.5/5.0
- Rent growth +2.5/5.0
- Condition / age +2.5/5.0
- Appreciation +0.0/10.0
$165,000
🖨 Deal sheet (PDF) 📄 Offer letter ✓ Due diligence
Listing remarks
Fixer upper in Willow Street! Don't miss this great home in the heart of Willow Street. Sit on the front porch and watch the world go by. With a little TLC, this could be a great home or buy as an investment to rent or flip.
Key facts
- 6,970 sq ft lot
- Garage
- Built 1877
Property features AI
Exterior
- Parking: Detached garage (1 car); Driveway with room for four cars; Total of 5 garage/parking spaces; Crushed stone parking surface
- Utilities: 100 amp electric service with circuit breakers; Oil heating; Electric hot water; Public water; Public sewer
- Home design: Detached property; Two levels
- Construction: Stick-built construction with vinyl siding; Stone foundation; Asphalt and metal roof; Building not winterized; Above-grade finished living area (per assessor)
- Exterior features: Public water; Public sewer; Not in a federal flood zone
Interior
- Kitchen: Refrigerator; Stove
- Bedrooms: Three bedrooms on the upper level
- Flooring: Carpet; Wood
- Bathrooms: One full bathroom on the upper level; One half bathroom on the main level
- Heating & cooling: Radiator heating; Oil-fired heating; 100 amp electric service with circuit breakers; Electric hot water
- Interior features: Unfinished basement with walkout stairs; Living room listed among primary rooms; Not furnished
- Laundry & utility: Laundry area (in-home)
Neighborhood map
What this means for you Summary
Snapshot
- This is a 3-bed/1.0-bath single-family listed at $165k.
Deal economics
- At list price, monthly cash flow is $313 ($4k/yr) — positive.
- The deal already cash-flows at list — no discount required.
- Meets the 1% rule at list price ($2k rent vs $165k).
- Recommended offer: $160k (3.0% below list) — sets the bar for market timing.
- Cap rate 8.6% vs local median 3.8% in Willow Street — top-decile yield for the area; either an underpriced asset or a hidden risk that comps aren't pricing in. Stress-test before assuming the spread holds.
Location & tenants
- Location reads 70/100 on livability (#738 in PA) — a middle-class / working-renter tenant base. Strengths: crime A+, employment A+, housing A+; Watch: amenities F, commute F.
- Lampeter-Strasburg SD (suburban): math 51% / reading 68% proficiency, ranked #68 of 539 in PA (top 13%) — acceptable for families but not a draw, mixed tenant base, ~2y average lease; only 16% free/reduced lunch — higher-income household profile.
- Market conditions: 25 active listings in the ZIP; 2 comparable units currently listed for rent nearby; solid renter incomes; 1,093 units permitted in Lancaster County in 2024 (201 in 5+ unit buildings).
Forward outlook
- Local home prices are declining (-3.0%/yr); year-one equity from $1k of loan paydown is wiped out by about $5k of value loss. Plan a longer hold.
- Lancaster County population projected at +5% by 2050 — modest demand growth; plan on rents tracking national, not racing it.
Negotiation context
- It's been on market 35 days — a 3% lower offer ($160k) is reasonable based on typical stale-listing flexibility.
- 2 sale attempts; this cycle's ask has dropped $15k (8%) from the opening price — seller is motivated, your offer sets the floor, not the list.
Risks & watch-outs
- Watch-outs: built in 1877 — expect roof / HVAC / electrical / plumbing capex.
- Climate carrying-cost: extreme-heat days projected 7→15/yr by 2055 (HVAC capex compounding) — expect insurance premiums to compound above CPI over the hold.
Questions for the listing agent
- It's been on market 35 days. Have you received any prior offers? Is the seller open to a 3% concession, seller financing, or rate buy-down credit?
- Built in 1877 — when were the roof, HVAC, electrical panel, plumbing, and water heater last replaced?
- Is there a deadline driving the sale (1031 exchange, divorce, estate, relocation)? That informs how much negotiation room exists.
- Schools are A-rated — typically a magnet for longer-tenancy family renters. What's the average tenant stay here, and is there a school-zone premium baked into asking?
- What's the average days-on-market for RENTAL listings here right now (not sales)? A rising rental-DOM trend means longer vacancies and softer asking-rent achievability than the comps imply.
- What's the recent tenant-quality profile in this submarket — average credit score on applications, eviction rate, late-payment / NSF rate, and stable-employment percentage? A property-management company in the area should have these aggregated.
- How much new for-sale + rental construction is in the pipeline within 1–3 miles? Heavy new supply typically softens prices + rents 12–24 months out; constrained supply supports both.
Investment metrics
- 1% rule
- 1.17% ✓
- Cap rate
- 8.57%
- Cash-on-cash
- 8.12%
- DSCR
- 1.36
- GRM
- 7.1
CMA / ARV
- ARV (median comp)
- $315,209
- List price
- $165,000
- Delta
- -47.65%
- Verdict
- UNDERPRICED
- Comps
- 20 within 1.0 mi
Show comp detail 12 sales within ~0.75 mi
| Address | Dist | Beds/Ba | Sqft | Sold | Price | $/sf | Match |
|---|---|---|---|---|---|---|---|
| 21 Violet Ave | 0.15mi | 3/1.0 | 1,494 (+5%) | 2mo | $360,000 | $241 | 83 |
| 8 Nolt Ave | 0.25mi | 3/2.0 | 1,484 (+4%) | 6mo | $368,500 | $248 | 72 |
| 2822 Willow Street Pike | 0.04mi | 3/2.0 | 1,584 (+11%) | 8mo | $320,000 | $202 | 68 |
| 323 Edgemont Dr | 0.51mi | 3/1.0 | 1,384 (-3%) | 5mo | $342,500 | $247 | 68 |
| 109 Woodlawn Dr | 0.30mi | 2/1.5 (-1) | 1,333 (-6%) | 5mo | $376,000 | $282 | 64 |
| 313 Crestline Dr | 0.35mi | 3/1.0 | 1,325 (-7%) | 12mo | $305,000 | $230 | 62 |
| 335 Nolt Ave | 0.36mi | 3/2.0 | 1,488 (+5%) | 12mo | $360,000 | $242 | 62 |
| 8 Kreider Ave | 0.35mi | 3/1.5 | 1,328 (-7%) | 12mo | $347,000 | $261 | 61 |
| 26 Beaver Valley Pike | 0.75mi | 3/1.0 | 1,372 (-4%) | 1mo | $300,000 | $219 | 58 |
| 11 Dennis Dr | 0.46mi | 2/1.0 (-1) | 1,535 (+8%) | 8mo | $345,678 | $225 | 54 |
| 12 Rees Dr | 0.39mi | 3/1.0 | 1,595 (+12%) | 10mo | $330,000 | $207 | 53 |
| 18 Baumgardner Rd | 0.57mi | 2/1.5 (-1) | 1,269 (-11%) | 12mo | $315,000 | $248 | 38 |
Match score weights: distance 35% · size 25% · config 20% · recency 20%. Top-matched comps best support the ARV.
Projected returns pro-forma
-3.0% appreciation · 3.0% rent growth · sell at horizon
- IRR
- -3.9%
- Equity multiple
- 0.85×
- Total profit
- $-6,751
- Equity at exit
- $24,602
- IRR
- 5.8%
- Equity multiple
- 1.43×
- Total profit
- $20,062
- Equity at exit
- $14,266
Cash invested: $46,200 (down + closing). Projections, not guarantees.
Landlord ↔ Tenant lean methodology
- Overall (STATE)
- 62 Landlord-Friendly
- State Pennsylvania
- 62 Landlord-Friendly · EVEN
- County
- — inherits STATE
- City
- — inherits STATE
ZIP-level market 17584
- Home prices YoY
- -34.0%
- Active inventory
- 25
- Price-to-rent
- 7.1×
Monthly cashflow live
- Estimated rent
- $1,932 medium interval (Pro) →
- Mortgage (P&I)
- −$865
- Tax from tax record
- −$280 /mo · $3,354/yr
- Insurance
- −$69
- HOA
- −$0
- Vacancy / Maint / Mgmt
- −$406
- Net cashflow
- $313
Break-even live
Sensitivity live
| Price | -10% $406 | -5% $359 | +0% $313 | +5% $266 | +10% $219 |
|---|---|---|---|---|---|
| Rent | -10% $160 | -5% $236 | +0% $313 | +5% $389 | +10% $465 |
| Rate | -1.0pp $396 | -0.5pp $355 | base $313 | +0.5pp $270 | +1.0pp $226 |
UW: 25.0% down · 7.5% · 30yr · 1.5% tax · 5.0% vac · 8.0% maint · 8.0% mgmt
Financing live
Cash to close
- Down payment
- $41,250
- Closing costs
- $4,950
- Reserves months
- —
- Total cash needed
- —
Loan-product check · same deal, 3 products live
Conventional
25% down · 7.5% · 30yr
- Down + closing
- —
- Monthly P&I
- —
- Monthly cashflow
- —
- DSCR
- —
- Eligible?
- —
Personal DTI + credit; lowest rate.
DSCR
20% down · 8.5% · 30yr
- Down + closing
- —
- Monthly P&I
- —
- Monthly cashflow
- —
- DSCR
- —
- Eligible?
- —
No personal income docs; deal must DSCR.
Hard money
10% down · 12.0% · 12mo
- Down + closing
- —
- Monthly P&I
- —
- Monthly cashflow
- —
- DSCR
- —
- Eligible?
- —
Short-term bridge; refi at stabilization.
Rent comps 2 comps
| Address | Beds | Baths | Sqft | Rent | $/sqft | DOM | Units | Dist |
|---|---|---|---|---|---|---|---|---|
| 2843 Willow Street Pike N Willow Street, PA | 3.0 | 1.0 | 900 | $1,350 | $1.50 | 15d | 1 | 0.09mi |
| 301 Cobblestone Dr Willow Street, PA | 1.0–2.0 | 1.0–2.5 | 1235 | $2,625 | $2.13 | 14d | 22 | 0.57mi |
Listing history 17 events
-
2026-06-21days on market $165,000 Active 35 DOM
-
2026-06-18days on market $165,000 Active 32 DOM
-
2026-06-17days on market $165,000 Active 31 DOM
-
2026-06-16days on market $165,000 Active 30 DOM
-
2026-06-15days on market $165,000 Active 29 DOM
-
2026-06-14pricedays on market $165,000 Active 27 DOM
-
2026-06-10days on market $179,900 Active 24 DOM
-
2026-06-09days on market $179,900 Active 23 DOM
-
2026-06-08days on market $179,900 Active 22 DOM
-
2026-06-07days on market $179,900 Active 21 DOM
-
2026-06-05days on market $179,900 Active 18 DOM
-
2026-06-03days on market $179,900 Active 17 DOM
-
2026-06-02days on market $179,900 Active 16 DOM
-
2026-06-01days on market $179,900 Active 15 DOM
-
2026-05-31days on market $179,900 Active 14 DOM
-
2026-05-30statusdays on market $179,900 Active 13 DOM
-
2026-05-08$179,900 Active 225-char remark
ⓘ Source: listings_history table (triggers on properties + properties_extension) + one-shot
backfill from property_details.listing_events for pre-trigger history.
Tax reassessment forecast PA · Partial reset (capped growth)
- Current annual tax
- $3,354 · $280/mo
- Projected year-2 tax
- $3,354 · $280/mo
- Expected delta
- $0/yr ($0/mo · -0.0%)
ⓘ Screening estimate from a state-policy table — verify with the county assessor before closing.
Climate risk First Street
- Flood 1/10 Low FEMA zone X (unshaded) · 0% chance over 30 yrs
- Wildfire 1/10 Low
- Heat 6/10 Major 7 d/yr ≥100°F today · 15 d/yr by 30 yrs out
- Wind 4/10 Moderate 18% chance of damaging wind over 30 yrs
- Air quality 4/10 Moderate 4 unhealthy d/yr today · 7 by 30 yrs out
Nearby sold comps map
Loading sold comps map…
Walkable amenities ~0.75 mi
Loading nearby amenities…
Taxation est. · year 1
- Rental income
- $23,183
- − Mortgage interest
- −$9,243
- − Property taxes
- −$3,354
- − Insurance
- −$825
- − Repairs & maintenance
- −$1,855
- − Management
- −$1,855
- − Depreciation
- −$4,800
- Taxable income
- $1,252
- Est. tax owed @ 24.0%
- −$300
- After-tax cash flow
- $3,451/yr
For passive investors: Depreciation is non-cash, so a rental often shows a tax loss while cash-flowing — sheltering income. Rental losses are passive: they offset passive income freely, and up to $25,000/yr can offset ordinary (W-2) income if you actively participate and your MAGI is under $100k (phasing out to $0 by $150k); unused losses carry forward. On sale, claimed depreciation is recaptured at up to 25%, and gains may owe capital-gains tax (a 1031 exchange can defer both). Figures are a year-1 estimate at your 24.0% rate — not tax advice; consult a CPA.
Schools (NCES district)
- District
- Lampeter-Strasburg SD
- NCES district ID
- 4213110
- Math proficiency
- 51% ▼ -11.00%
- Reading proficiency
- 68% ▼ -10.00%
- Median HH income
- $66,661
- Composite
- 52.19/100
- National rank
- #1610
- State rank
- #68 of 539 in PA
Livability — Willow Street
- Score
- 70/100
- State rank
- #738
- US rank
- #7390
Category grades
Schools grade is shown separately in the Schools card above.
Census & demographics
- Census place
- Willow Street, PA
- County
- Lancaster County · 390,309 people
- City population
- 11,646
- Metro
- Lancaster, PA
- Population (ZIP)
- 11,646
- Household income
- $108,723
- Rent vs Own
- Severe rent burden
- 511.0
Population outlook (Lancaster County) Hauer SSP2
- Today (2025)
- 561,011 people
- By 2030
- 570,969 · +1.8%
- By 2040
- 585,929 · +4.4%
- By 2050
- 591,056 · +5.4%
- By 2075
- 594,747 · +6.0%
- By 2100
- 558,850 · -0.4%
Race, ethnicity, and origin ACS 2023
- Neighborhood character
- Predominantly White (84%)
- Race & ethnicity
- White 84% Hispanic / Latino 8% Two or more races 4% Asian 2% Black 2%
- Hispanic origin (detail)
- Puerto Rican 4% Salvadoran 1%
- Common ancestry
- Slovak 3% Romanian 3% Lithuanian 2%
- Foreign-born
- 6% · Canada, China, Dominican Republic
- Languages at home
- 92% English-only · Spanish 4% Other Indo-European 3%
Political lean MEDSL · Lancaster
- 2024 margin
- R (+15.9) · D 41.5% · R 57.5%
- 2008→2024 swing
- -4.1pp toward R · 2008: -11.8pp · 2024: -15.9pp
- All cycles
- 2024: R+15.9 2020: R+15.8 2016: R+19.7 2012: R+19.2 2008: R+11.8
Not yet ingested
- Civics
- —
Market trends
- HPI YoY
- ▼ -132.51%
- Current HPI
- 256.8264
- Rent YoY
- —
- Metro
- Lancaster, PA
- State GDP YoY
- ▲ 1.68%
- F500 in state
- 34
Industry mix (Fortune 500 HQ in PA)
| Industry | F500 HQs | Revenue |
|---|---|---|
| Healthcare | 2 | $309B |
|
||
| Insurance | 2 | $27B |
|
||
| Telecommunications / Media | 1 | $124B |
|
||
| Industrial Distribution | 1 | $22B |
|
||
| Financial Services | 1 | $20B |
|
||
| Chemicals / Materials | 1 | $18B |
|
||
Price history
-8.3% since first listed4 events — show timeline
- 2026-06-10 Price Changed $165,000 BRIGHT MLS
- 2026-05-29 Relisted — BRIGHT MLS
- 2026-05-20 Pending — BRIGHT MLS
- 2026-05-08 Listed $179,900 BRIGHT MLS
Property tax history
+0.8%/yrLatest (2026): $3,354 · +4.0% YoY. Source: county tax records.
Cash-flow waterfall
monthlySold comps — $/sqft
last 12 mo · ≤1 miLoading sold comps…