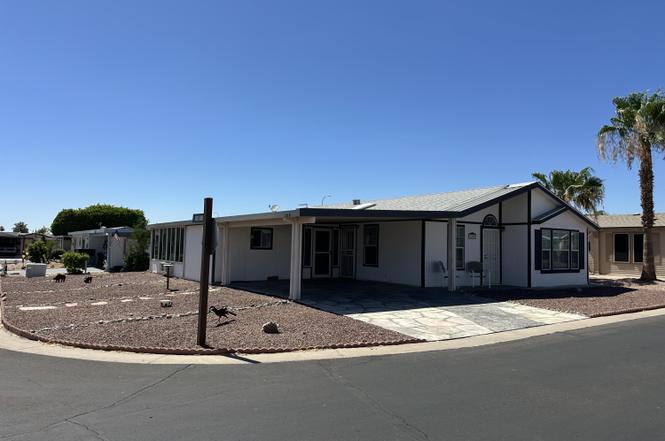
3700 S Ironwood Dr #108 · Apache Junction, AZ
Flood risk 1/10 · Minimal
- FEMA flood zone
- X (unshaded)
- Chance of flooding over 30 yrs
- 0.0%
- Est. flood insurance / yr
- $507 – $1,088
Fire risk 5/10 · Moderate
- Est. fire insurance / yr
- $610 – $1,132
Heat risk 9/10 · Severe
- Hot days now (above 111°F)
- 6 days/yr
- Hot days in 30 yrs
- 16 days/yr
Wind risk 1/10 · Minimal
- Chance of severe wind over 30 yrs
- —
Air-quality risk 3/10 · Minor
- Unhealthy air days now
- 2 days/yr
- Unhealthy air days in 30 yrs
- 3 days/yr
Risk factors via First Street. Map © Google.
Why this score? — see what drove the C+ grade
The composite is a weighted blend of 9 inputs, each scored 0–100. Each bar is that input's sub-score; the figure is the points it added to the 100-point composite (weight × sub-score).
- Cash flow +30.0/30.0
- 1% rule +10.0/10.0
- DSCR +10.0/10.0
- Condition / age +3.8/5.0
- Livability +3.3/5.0
- Rent growth +1.6/5.0
- Schools +1.5/10.0
- ARV discount +0.0/15.0
- Appreciation +0.0/10.0
$109,000
🖨 Deal sheet (PDF) 📄 Offer letter ✓ Due diligence
Listing remarks
THE ABSOLUTE BEST LOT IN THE 55+ GATED COMMUNITY OF DESERT HARBOR * CORNER LOT LOCATED DIRECTLY ACROSS FROM THE CLUBHOUSE & ALL OF THE AMENITIES * SINGLE LEVEL 2 BEDROOM, 2 BATH, PLUS HUGE OFFICE * ALSO FEATURES AN AMAZING 400 SQFT SCREENED IN AIR-CONDITIONED ARIZONA ROOM WHICH IS PERFECT FOR A MEDIA/GAMEROOM * GREAT ROOM * KITCHEN FEATURES GRANITE COUNTERS, HIGH-END SAMSUNG APPLIANCES, ISLAND, FARM SINK, NEUTRAL CABINETS, MOSAIC BACKSPLASH, & PANTRY * BREAKFAST NOOK * VAULTED CEILINGS * UPGRADED FIXTURES THROUGHOUT * WOOD FLOORING * TILE * SHAKER BASEBOARDS * 2-INCH WOOD BLINDS * MASTER SUITE W/ WALK-IN CLOSET * LAUNDRY ROOM W/ WASHER/DRYER * 2 CAR CARPORT * HUGE STORAGE ROOM *
Key facts
- Dog park
- Fitness center
- Clubhouse
Tags
Property features AI
Finance
- Other: Annual tax information available
- HOA & community: Land lease community (monthly land lease); Land lease payment required monthly; Association covers water, sewer and trash; indicates no additional fees; Gated community with pool and heated community spa; Community media room, fitness center, and biking/walking paths
Exterior
- Parking: 2 covered parking spaces; 2 open parking spaces; 2 carport spaces
- Utilities: City water; Public sewer; 220V in kitchen
- Home design: Manufactured/mobile home; Leasehold ownership
- Construction: Wood frame construction; Painted exterior; Composition roof; Building area reported by owner
- Exterior features: Private street access; Screened-in patio; Outdoor storage; Corner lot; Gravel/stone front and back; Private maintained road; Mountain views
Interior
- Kitchen: Built-in microwave; Refrigerator; Dishwasher; Disposal; Built-in electric oven; 220V outlet in kitchen
- Bedrooms: Up to 3 possible bedrooms
- Flooring: Tile flooring; Wood flooring
- Bathrooms: 2 full bathrooms
- Heating & cooling: Heat pump heating; Ceiling fans; Programmable thermostat; Has heating and cooling
- Interior features: High speed internet available; Granite counters; Eat-in kitchen; Vaulted ceilings; Kitchen island; Pantry; Full bath in primary bedroom; Skylights; Dual-pane windows
- Laundry & utility: Indoor laundry
Neighborhood map
What this means for you Summary
Snapshot
- This is a 2-bed/2.0-bath manufactured listed at $109k. Condition is rated good.
Deal economics
- At list price, monthly cash flow is $759 ($9k/yr) — positive.
- The deal already cash-flows at list — no discount required.
- Meets the 1% rule at list price ($2k rent vs $109k).
- Cap rate 14.7% vs local median 3.5% in Apache Junction — top-decile yield for the area; either an underpriced asset or a hidden risk that comps aren't pricing in. Stress-test before assuming the spread holds.
Location & tenants
- Location reads 66/100 on livability (#70 in AZ) — a middle-class / working-renter tenant base. Strengths: cost of living A+, housing A+; Watch: crime D+, schools F, amenities F.
- Apache Junction Unified District (4443) (suburban): math 15% / reading 20% proficiency, ranked #195 of 249 in AZ (top 78%) — low school quality limits family demand, transient renter base, plan for 1-2y turnover.
- Market conditions: Rents falling (-3.5%/yr); 468 active listings in the ZIP; 8 comparable units currently listed for rent nearby; rentals at typical pace (median 26d on market — plan ~3-4 weeks tenant-placement turnaround); 9,504 units permitted in Pinal County in 2024 (776 in 5+ unit buildings).
- This rent runs 40% of the median local income ($58k/yr) — at the standard rent-burdened threshold; future hikes will face affordability resistance.
Forward outlook
- Local home prices are declining (-3.0%/yr); year-one equity from $754 of loan paydown is wiped out by about $3k of value loss. Plan a longer hold.
- At projected returns (-3.0% appreciation + 0.0% rent growth), your $31k cash investment doubles in ~5 years — after that, you're playing with house money.
Negotiation context
- Only 10 days on market — expect competitive offers; lowballing is unlikely to land.
Risks & watch-outs
- Climate carrying-cost: moderate wildfire risk; extreme-heat days projected 6→16/yr by 2055 (HVAC capex compounding) — expect insurance premiums to compound above CPI over the hold.
Questions for the listing agent
- Is there a deadline driving the sale (1031 exchange, divorce, estate, relocation)? That informs how much negotiation room exists.
- Schools are F-rated, which usually means shorter tenancies and higher turnover. Who's the typical renter profile here, and what's been the actual vacancy rate?
- Crime grade is D in this area — have there been break-ins, vandalism, or insurance claims at this property in the last 3 years? What carrier currently insures it and at what premium?
- What's the average days-on-market for RENTAL listings here right now (not sales)? A rising rental-DOM trend means longer vacancies and softer asking-rent achievability than the comps imply.
- What's the recent tenant-quality profile in this submarket — average credit score on applications, eviction rate, late-payment / NSF rate, and stable-employment percentage? A property-management company in the area should have these aggregated.
- How much new for-sale + rental construction is in the pipeline within 1–3 miles? Heavy new supply typically softens prices + rents 12–24 months out; constrained supply supports both.
Investment metrics
- 1% rule
- 1.76% ✓
- Cap rate
- 14.65%
- Cash-on-cash
- 29.85%
- DSCR
- 2.33
- GRM
- 4.7
CMA / ARV
- ARV (on-the-fly)
- $93,288
- Comps found
- 12
Show comp detail 12 sales within ~0.75 mi
| Address | Dist | Beds/Ba | Sqft | Sold | Price | $/sf | Match |
|---|---|---|---|---|---|---|---|
| 2208 W Baseline Ave #137 | 0.24mi | 2/2.0 | 1,232 (+3%) | 2mo | $50,000 | $41 | 83 |
| 2208 W Baseline Ave #67 | 0.26mi | 2/2.0 | 1,232 (+3%) | 2mo | $110,000 | $89 | 81 |
| 3700 S Ironwood Dr Lot 124 | 0.00mi | 2/2.0 | 1,056 (-12%) | 3mo | $34,990 | $33 | 78 |
| 3700 S Ironwood Dr #79 | 0.13mi | 3/2.0 (+1) | 1,248 (+4%) | 11mo | $190,000 | $152 | 73 |
| 3400 S Ironwood Dr #181 | 0.27mi | 2/2.0 | 1,150 (-4%) | 11mo | $85,500 | $74 | 72 |
| 2208 W Baseline Ave #40 | 0.28mi | 2/2.0 | 1,056 (-12%) | 1mo | $82,000 | $78 | 67 |
| 2208 W Baseline Ave #118 | 0.28mi | 2/2.0 | 1,144 (-4%) | 16mo | $76,000 | $66 | 66 |
| 2208 W Baseline Ave #87 | 0.26mi | 2/2.0 | 1,344 (+12%) | 8mo | $105,000 | $78 | 60 |
| 2208 W Baseline Ave #9 | 0.26mi | 3/2.0 (+1) | 1,248 (+4%) | 18mo | $135,000 | $108 | 60 |
| 2208 W Baseline Ave #142 | 0.26mi | 2/2.0 | 1,046 (-12%) | 11mo | $70,000 | $67 | 58 |
| 2208 W Baseline Ave #56 | 0.26mi | 3/2.0 (+1) | 1,323 (+11%) | 14mo | $130,000 | $98 | 54 |
| 2175 W Southern Ave #200 | 0.62mi | 2/2.0 | 1,056 (-12%) | 13mo | $57,900 | $55 | 40 |
Match score weights: distance 35% · size 25% · config 20% · recency 20%. Top-matched comps best support the ARV.
Projected returns pro-forma
-3.0% appreciation · 0.0% rent growth · sell at horizon
- IRR
- 21.0%
- Equity multiple
- 1.82×
- Total profit
- $25,115
- Equity at exit
- $16,252
- IRR
- 27.0%
- Equity multiple
- 3.05×
- Total profit
- $62,574
- Equity at exit
- $9,424
Cash invested: $30,520 (down + closing). Projections, not guarantees.
Landlord ↔ Tenant lean methodology
- Overall (STATE)
- 87 Strongly Landlord-Friendly
- State Arizona
- 87 Strongly Landlord-Friendly · R+3
- County
- — inherits STATE
- City
- — inherits STATE
ZIP-level market 85120
- Home prices YoY
- -29.0%
- Rents YoY
- -3.5%
- Active inventory
- 468
- Price-to-rent
- 4.7×
Monthly cashflow live
- Estimated rent
- $1,915 high interval (Pro) →
- Mortgage (P&I)
- −$572
- Tax est. 1.5%
- −$136 /mo · $1,635/yr
- Insurance
- −$45
- HOA
- −$0
- Vacancy / Maint / Mgmt
- −$402
- Net cashflow
- $759
Break-even live
Sensitivity live
| Price | -10% $835 | -5% $797 | +0% $759 | +5% $722 | +10% $684 |
|---|---|---|---|---|---|
| Rent | -10% $608 | -5% $684 | +0% $759 | +5% $835 | +10% $911 |
| Rate | -1.0pp $814 | -0.5pp $787 | base $759 | +0.5pp $731 | +1.0pp $702 |
UW: 25.0% down · 7.5% · 30yr · 1.5% tax · 5.0% vac · 8.0% maint · 8.0% mgmt
Financing live
Cash to close
- Down payment
- $27,250
- Closing costs
- $3,270
- Reserves months
- —
- Total cash needed
- —
Loan-product check · same deal, 3 products live
Conventional
25% down · 7.5% · 30yr
- Down + closing
- —
- Monthly P&I
- —
- Monthly cashflow
- —
- DSCR
- —
- Eligible?
- —
Personal DTI + credit; lowest rate.
DSCR
20% down · 8.5% · 30yr
- Down + closing
- —
- Monthly P&I
- —
- Monthly cashflow
- —
- DSCR
- —
- Eligible?
- —
No personal income docs; deal must DSCR.
Hard money
10% down · 12.0% · 12mo
- Down + closing
- —
- Monthly P&I
- —
- Monthly cashflow
- —
- DSCR
- —
- Eligible?
- —
Short-term bridge; refi at stabilization.
Rent comps 8 comps
| Address | Beds | Baths | Sqft | Rent | $/sqft | DOM | Units | Dist |
|---|---|---|---|---|---|---|---|---|
| 3454 S Warner Dr Apache Junction, AZ | 3.0 | 2.0 | 1300 | $2,500 | $1.92 | 25d | 1 | 0.59mi |
| 2065 W 20th Ave Apache Junction, AZ | 3.0 | 2.0 | 1110 | $1,800 | $1.62 | 0d | 1 | 1.12mi |
| 2043 S Thunderbird Dr Apache Junction, AZ | 3.0 | 2.0 | 1348 | $1,925 | $1.43 | 25d | 1 | 1.13mi |
| 2101 S Yellow Wood #45 Mesa, AZ | 2.0 | 2.0 | 1081 | $1,649 | $1.53 | 45d | 1 | 1.17mi |
| 2101 S Yellow Wood #60 Mesa, AZ | 2.0 | 2.0 | 1371 | $2,600 | $1.90 | 0d | 1 | 1.17mi |
| 3000 W Southern Ave Apache Junction, AZ | 1.0–2.0 | 1.0–2.0 | 836 | $1,719 | $2.05 | 0d | 13 | 1.22mi |
| 2061 S Apache Dr Unit 1 Apache Junction, AZ | 2.0 | 1.0 | 800 | $1,095 | $1.37 | 6d | 1 | 1.45mi |
| 1446 S Palo Verde Dr Unit apache Apache Junction, AZ | 2.0 | 2.0 | 1210 | $1,700 | $1.40 | 25d | 1 | 1.45mi |
Listing history 7 events
-
2026-06-21days on market $109,000 Active 10 DOM
-
2026-06-18days on market $109,000 Active 7 DOM
-
2026-06-17days on market $109,000 Active 6 DOM
-
2026-06-16days on market $109,000 Active 5 DOM
-
2026-06-15days on market $109,000 Active 4 DOM
-
2026-06-13remarks 691-char remark
-
2026-06-13$109,000 Active 2 DOM
ⓘ Source: listings_history table (triggers on properties + properties_extension) + one-shot
backfill from property_details.listing_events for pre-trigger history.
Climate risk First Street
- Flood 1/10 Low FEMA zone X (unshaded) · 0% chance over 30 yrs
- Wildfire 5/10 Major
- Heat 9/10 Extreme 6 d/yr ≥111°F today · 16 d/yr by 30 yrs out
- Wind 1/10 Low
- Air quality 3/10 Moderate 2 unhealthy d/yr today · 3 by 30 yrs out
Nearby sold comps map
Loading sold comps map…
Walkable amenities ~0.75 mi
Loading nearby amenities…
Taxation est. · year 1
- Rental income
- $22,976
- − Mortgage interest
- −$6,106
- − Property taxes
- −$1,635
- − Insurance
- −$545
- − Repairs & maintenance
- −$1,838
- − Management
- −$1,838
- − Depreciation
- −$3,171
- Taxable income
- $7,843
- Est. tax owed @ 24.0%
- −$1,882
- After-tax cash flow
- $7,229/yr
For passive investors: Depreciation is non-cash, so a rental often shows a tax loss while cash-flowing — sheltering income. Rental losses are passive: they offset passive income freely, and up to $25,000/yr can offset ordinary (W-2) income if you actively participate and your MAGI is under $100k (phasing out to $0 by $150k); unused losses carry forward. On sale, claimed depreciation is recaptured at up to 25%, and gains may owe capital-gains tax (a 1031 exchange can defer both). Figures are a year-1 estimate at your 24.0% rate — not tax advice; consult a CPA.
Condition & rehab AI · 13 photos
This home is in good condition with recent updates, offering a move-in-ready experience. It features a well-maintained exterior, updated kitchen and bath, and a spacious layout.
Value-add opportunities
- Resale paint exterior — enhances curb appeal
- Resale trim landscaping — improves curb appeal
- Both install smart home devices — increases home's value and convenience
Renovation cost estimate screening
Value-add ROI direction
- Resale paint exterior — enhances curb appeal ↑
- Resale trim landscaping — improves curb appeal ↑
- Both install smart home devices — increases home's value and convenience ↑
ⓘ Cost ranges are severity-bucket heuristics (US national rule-of-thumb). Get contractor quotes + a written scope before underwriting a rehab budget.
Schools (NCES district)
- District
- Apache Junction Unified District (4443)
- NCES district ID
- 0400790
- Math proficiency
- 15% ▼ -17.00%
- Reading proficiency
- 20% ▼ -13.00%
- Median HH income
- $44,930
- Composite
- 15.34/100
- National rank
- #9325
- State rank
- #195 of 249 in AZ
Livability — Apache Junction
- Score
- 66/100
- State rank
- #70
- US rank
- #11242
Category grades
Schools grade is shown separately in the Schools card above.
Census & demographics
- Census place
- Apache Junction, AZ
- County
- Pinal County · 399,947 people
- City population
- 56,611
- Metro
- Phoenix-Mesa-Chandler, AZ
- Population (ZIP)
- 31,191
- Household income
- $57,786
- Rent vs Own
- Severe rent burden
- 686.0
Population outlook (Pinal County) Hauer SSP2
- Today (2025)
- 437,574 people
- By 2030
- 446,903 · +2.1%
- By 2040
- 452,589 · +3.4%
- By 2050
- 444,126 · +1.5%
- By 2075
- 430,300 · -1.7%
- By 2100
- 393,536 · -10.1%
Race, ethnicity, and origin ACS 2023
- Neighborhood character
- Predominantly White (77%)
- Race & ethnicity
- White 77% Hispanic / Latino 16% Two or more races 10% Asian 1%
- Hispanic origin (detail)
- Mexican 13%
- Common ancestry
- Romanian 3% Lithuanian 3% Portuguese 3%
- Foreign-born
- 7% · Canada
- Languages at home
- 89% English-only · Spanish 8% Tagalog/Filipino 1%
Political lean MEDSL · Pinal
- 2024 margin
- Strong R (+22.1) · D 38.5% · R 60.6%
- 2008→2024 swing
- -7.6pp toward R · 2008: -14.5pp · 2024: -22.1pp
- All cycles
- 2024: R+22.1 2020: R+17.3 2016: R+19.3 2012: R+17.1 2008: R+14.5
Not yet ingested
- Civics
- —
Market trends
- HPI YoY
- ▼ -128.31%
- Current HPI
- 313.4666
- Rent YoY
- ▼ -3.50%
- Metro
- Phoenix-Mesa-Chandler, AZ
- State GDP YoY
- ▲ 4.54%
- F500 in state
- 20
Industry mix (Fortune 500 HQ in AZ)
| Industry | F500 HQs | Revenue |
|---|---|---|
| Technology | 2 | $13B |
|
||
| Mining / Metals | 1 | $23B |
|
||
| Environmental Services | 1 | $16B |
|
||
| Metals / Steel | 1 | $14B |
|
||
| Technology Distribution | 1 | $9B |
|
||
| Homebuilding | 1 | $8B |
|
||
Price history
1 event — show timeline
- 2026-06-11 Listed $109,000 ARMLS
Cash-flow waterfall
monthlySold comps — $/sqft
last 12 mo · ≤1 miLoading sold comps…