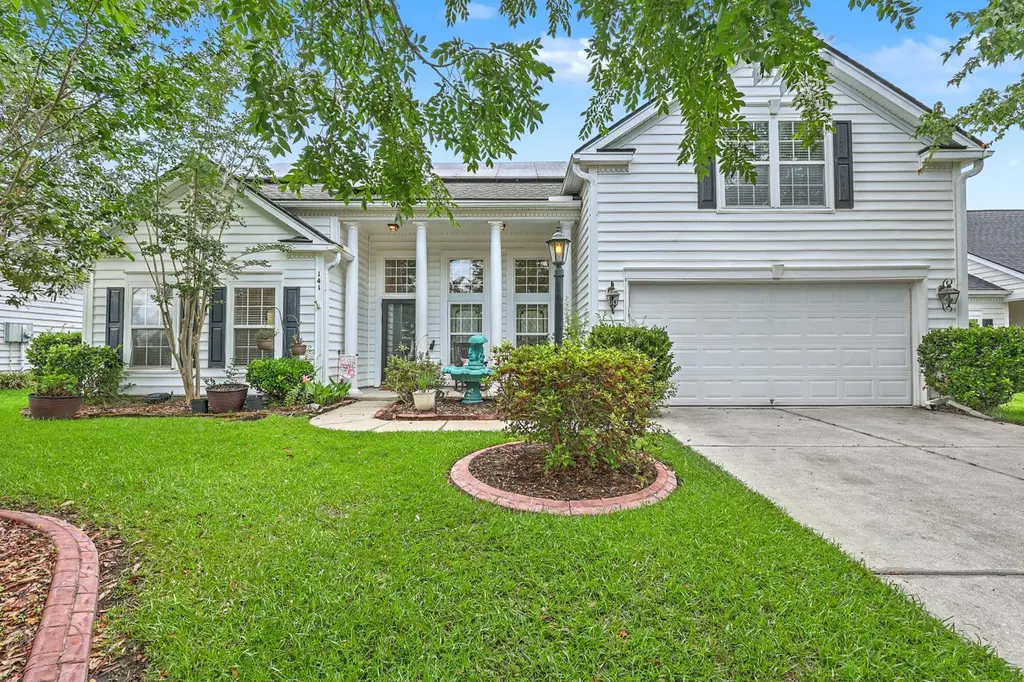
141 Gathering Island Rd · Summerville, SC
Flood risk 1/10 · Minimal
- FEMA flood zone
- X (unshaded)
- Chance of flooding over 30 yrs
- 0.0%
- Est. flood insurance / yr
- $507 – $1,088
Fire risk 2/10 · Minimal
- Est. fire insurance / yr
- $783 – $1,453
Heat risk 9/10 · Severe
- Hot days now (above 109°F)
- 7 days/yr
- Hot days in 30 yrs
- 18 days/yr
Wind risk 8/10 · Major
- Chance of severe wind over 30 yrs
- 97.0%
Air-quality risk 2/10 · Minimal
- Unhealthy air days now
- 2 days/yr
- Unhealthy air days in 30 yrs
- 2 days/yr
Risk factors via First Street. Map © Google.
Why this score? — see what drove the D grade
The composite is a weighted blend of 9 inputs, each scored 0–100. Each bar is that input's sub-score; the figure is the points it added to the 100-point composite (weight × sub-score).
- ARV discount +13.5/15.0
- Cash flow +11.3/30.0
- Schools +4.1/10.0
- Rent growth +3.5/5.0
- DSCR +3.3/10.0
- Livability +3.2/5.0
- Condition / age +2.5/5.0
- 1% rule +2.2/10.0
- Appreciation +0.0/10.0
$425,000
🖨 Deal sheet (PDF) 📄 Offer letter ✓ Due diligence
Listing remarks MLS
AUGUSTA FLOOR PLAN BY BEAZER HOMES. HOME INCLUDES BONUS ROOM, SCREEN PORCH, MANY WINDOW OPTIONS. HARDWOOD FLOORING THROUGHOUT, TILE IN HALL BATH, MASTER BATH, AND UTILITY. GOURMET KITCHEN WITH CORIAN COUNTERTOPS, UPGRADED CABINETS. SURROUND SOUND PRE-WIRE THROUGHOUT. ADDITIONAL RECESSED CAN LIGHTING. INCLUDES 1 YEAR BUILDERS WARRANTY AND 10 YEAR LIMITED STRUCTUAL WARRANTY. FULLY SODDED AND LANDSCAPED LOT. HOME HAS SCHEDULED COMPLETION DATE OF DEC '06
Key facts
- Stone countertops
- Columned front porch
- Mature landscaping
Tags
Property features AI
Finance
- HOA & community: Annual association fee (390); Community clubhouse; Pool; Tennis courts; Trash service; Walk/jog trails; Club membership available
Exterior
- Parking: Attached garage; Garage door opener; Combination of 1-car, 1.5-car and 2-car garage spaces (total ~4.5 parking spaces)
- Utilities: Public sewer
- Home design: Single family detached residence; One and one-half stories; Ground level entry
- Construction: Architectural roof
- Exterior features: Privacy wood fencing (wooden enclosed); Level lot (0 - 0.5 acre)
Interior
- Kitchen: Built-in electric oven; Electric cooktop; Microwave; Dishwasher; Kitchen island; Pantry; Eat-in kitchen
- Bedrooms: 4 bedrooms; Master bedroom with ceiling fan(s), garden tub/shower, and walk-in closet(s)
- Flooring: Carpet; Ceramic tile; Wood
- Bathrooms: 2 bathrooms
- Heating & cooling: Heat pump; Central air conditioning
- Interior features: Smooth ceilings; High ceilings; Garden tub/shower; Kitchen island; Walk-in closet(s); Ceiling fan(s); Eat-in kitchen; Family room; Formal living room; Entrance foyer; Attached FROG (finished room over garage); Great room; Office; Pantry; Separate dining room
- Laundry & utility: Laundry room with washer and electric dryer hookups
Neighborhood map
What this means for you Summary
Snapshot
- This is a 4-bed/2.0-bath single-family listed at $425k.
Deal economics
- At list price, monthly cash flow is $-152 ($-2k/yr) — negative.
- To cash-flow at today's rent, offer at most $398k (6.3% below list).
- To meet the 1% rule (rent ≥ 1% of price), the offer needs to be $308k (27.6% below list).
- Recommended offer: $308k (27.6% below list) — sets the bar for 1% rule.
- Cap rate 5.9% vs local median 3.9% in Summerville — top-decile yield for the area; either an underpriced asset or a hidden risk that comps aren't pricing in. Stress-test before assuming the spread holds.
Location & tenants
- Location reads 63/100 on livability (#167 in SC) — a middle-class / working-renter tenant base. Strengths: housing A+, cost of living B+; Watch: amenities F, commute F, health & safety F.
- Dorchester 02 (suburban): math 40% / reading 55% proficiency, ranked #12 of 80 in SC (top 15%) — families likely to look elsewhere, expect single-tenant / working-renter base with shorter leases.
- Zoned schools: Beech Hill Elementary (math 67% / reading 72%, grade A-, #38 of 597 statewide, top 7%, 1,101 students, 34% FRL); East Edisto Middle (879 students, 46% FRL); Ashley Ridge High (math 73% / reading 93%, grade A, #18 of 196 statewide, top 9%, 2,542 students, 50% FRL).
- Zoned-school proficiency averages 76% at this address vs 48% district-wide (+29 pts) — the actual schools serving this property are materially stronger than the Dorchester 02 average implies; a family-tenant draw the district grade alone would hide.
- Market conditions: Rents rising (+3.9%/yr); 688 active listings in the ZIP; 3 comparable units currently listed for rent nearby; rentals at typical pace (median 21d on market — plan ~3-4 weeks tenant-placement turnaround); solid renter incomes; 1,199 units permitted in Dorchester County in 2024 (0 in 5+ unit buildings).
- This rent runs 45% of the median local income ($83k/yr) — at the standard rent-burdened threshold; future hikes will face affordability resistance.
Forward outlook
- Local home prices are declining (-3.0%/yr); year-one equity from $3k of loan paydown is wiped out by about $13k of value loss. Plan a longer hold.
- Dorchester County population projected at +43% by 2050 — long-run rental-demand tailwind backs the buy-and-hold thesis.
Negotiation context
- It's been on market 16 days — a 2% lower offer ($419k) is reasonable based on typical stale-listing flexibility.
- 3 sale attempts since 20y ago with the ask held roughly flat each time — persistent listings suggest the price (not the market) is what's stuck; bring a comps-based counter.
- Current owner paid $260k; list at $425k implies a 64% gain — meaningful room to come down on a strong offer.
Risks & watch-outs
- Climate carrying-cost: severe wind risk, 97% chance of damaging wind over 30y; extreme-heat days projected 7→18/yr by 2055 (HVAC capex compounding) — expect insurance premiums to compound above CPI over the hold.
Questions for the listing agent
- What do current leases actually rent for vs. the listed asking? Can we see a recent rent roll and the last 12 months of T-12 income?
- What does the HOA fee cover, when was the last increase, and are there any pending special assessments or reserve-fund shortfalls?
- Is there a deadline driving the sale (1031 exchange, divorce, estate, relocation)? That informs how much negotiation room exists.
- Schools are B-rated — typically a magnet for longer-tenancy family renters. What's the average tenant stay here, and is there a school-zone premium baked into asking?
- The area grade is low — what's the realistic commute time and amenity access for the typical tenant pool here? Any planned neighborhood developments (good or bad) we should know about?
- What's the average days-on-market for RENTAL listings here right now (not sales)? A rising rental-DOM trend means longer vacancies and softer asking-rent achievability than the comps imply.
- What's the recent tenant-quality profile in this submarket — average credit score on applications, eviction rate, late-payment / NSF rate, and stable-employment percentage? A property-management company in the area should have these aggregated.
- How much new for-sale + rental construction is in the pipeline within 1–3 miles? Heavy new supply typically softens prices + rents 12–24 months out; constrained supply supports both.
Investment metrics
- 1% rule
- 0.72% ✗
- Cap rate
- 5.86%
- Cash-on-cash
- -1.53%
- DSCR
- 0.93
- GRM
- 11.5
CMA / ARV
- ARV (on-the-fly)
- $490,854
- Comps found
- 12
Show comp detail 12 sales within ~0.75 mi
| Address | Dist | Beds/Ba | Sqft | Sold | Price | $/sf | Match |
|---|---|---|---|---|---|---|---|
| 534 Pointe Of Oaks Rd | 0.17mi | 4/2.0 | 2,265 (+0%) | 3mo | $470,000 | $208 | 89 |
| 525 Pointe Of Oaks Rd | 0.13mi | 4/2.0 | 2,317 (+2%) | 2mo | $436,000 | $188 | 88 |
| 102 Corral Cir | 0.57mi | 4/2.0 | 2,260 (-0%) | 1mo | $490,000 | $217 | 72 |
| 600 Pointe Of Oaks Rd | 0.58mi | 4/2.0 | 2,187 (-3%) | 1mo | $432,000 | $198 | 67 |
| 808 Long Drive Rd | 0.45mi | 3/2.0 (-1) | 2,325 (+3%) | 3mo | $525,500 | $226 | 67 |
| 105 Corral Cir | 0.57mi | 4/2.0 | 2,311 (+2%) | 11mo | $519,999 | $225 | 60 |
| 104 Pristine Ct | 0.59mi | 4/2.0 | 2,051 (-9%) | 1mo | $449,000 | $219 | 56 |
| 4036 Plantation House Rd | 0.68mi | 3/2.5 (-1) | 2,177 (-4%) | 2mo | $462,625 | $213 | 54 |
| 569 Pointe Of Oaks Rd | 0.43mi | 4/2.0 | 2,004 (-11%) | 12mo | $475,000 | $237 | 52 |
| 1200 Out Of Bounds Dr | 0.49mi | 4/2.5 | 2,473 (+9%) | 10mo | $565,000 | $228 | 51 |
| 102 Old Course Rd | 0.52mi | 3/2.5 (-1) | 2,560 (+13%) | 1mo | $469,900 | $184 | 46 |
| 258 Carolinian Dr | 0.67mi | 4/2.5 | 2,513 (+11%) | 9mo | $455,000 | $181 | 40 |
Match score weights: distance 35% · size 25% · config 20% · recency 20%. Top-matched comps best support the ARV.
Projected returns pro-forma
-3.0% appreciation · 3.93% rent growth · sell at horizon
- IRR
- -18.0%
- Equity multiple
- 0.36×
- Total profit
- $-75,790
- Equity at exit
- $63,369
- IRR
- -8.8%
- Equity multiple
- 0.44×
- Total profit
- $-66,969
- Equity at exit
- $36,746
Cash invested: $119,000 (down + closing). Projections, not guarantees.
Landlord ↔ Tenant lean methodology
- Overall (STATE)
- 90 Strongly Landlord-Friendly
- State South Carolina
- 90 Strongly Landlord-Friendly · R+6
- County
- — inherits STATE
- City
- — inherits STATE
ZIP-level market 29485
- Rents YoY
- 3.9%
- Active inventory
- 688
- Price-to-rent
- 11.5×
Monthly cashflow live
- Estimated rent
- $3,078 medium interval (Pro) →
- Mortgage (P&I)
- −$2,229
- Tax from tax record
- −$145 /mo · $1,736/yr
- Insurance
- −$177
- HOA
- −$33
- Vacancy / Maint / Mgmt
- −$646
- Net cashflow
- $-152
Break-even live
Sensitivity live
| Price | -10% $89 | -5% $-31 | +0% $-152 | +5% $-272 | +10% $-392 |
|---|---|---|---|---|---|
| Rent | -10% $-395 | -5% $-273 | +0% $-152 | +5% $-30 | +10% $92 |
| Rate | -1.0pp $62 | -0.5pp $-44 | base $-152 | +0.5pp $-262 | +1.0pp $-374 |
UW: 25.0% down · 7.5% · 30yr · 1.5% tax · 5.0% vac · 8.0% maint · 8.0% mgmt
Financing live
Cash to close
- Down payment
- $106,250
- Closing costs
- $12,750
- Reserves months
- —
- Total cash needed
- —
Loan-product check · same deal, 3 products live
Conventional
25% down · 7.5% · 30yr
- Down + closing
- —
- Monthly P&I
- —
- Monthly cashflow
- —
- DSCR
- —
- Eligible?
- —
Personal DTI + credit; lowest rate.
DSCR
20% down · 8.5% · 30yr
- Down + closing
- —
- Monthly P&I
- —
- Monthly cashflow
- —
- DSCR
- —
- Eligible?
- —
No personal income docs; deal must DSCR.
Hard money
10% down · 12.0% · 12mo
- Down + closing
- —
- Monthly P&I
- —
- Monthly cashflow
- —
- DSCR
- —
- Eligible?
- —
Short-term bridge; refi at stabilization.
Rent comps 3 comps
| Address | Beds | Baths | Sqft | Rent | $/sqft | DOM | Units | Dist |
|---|---|---|---|---|---|---|---|---|
| 108 Acuna St Summerville, SC | 3.0 | 2.5 | 1910 | $2,312 | $1.21 | 16d | 15 | 1.05mi |
| 258 Silver Cypress Cir Summerville, SC | 5.0 | 4.5 | 3216 | $3,900 | $1.21 | 25d | 1 | 1.14mi |
| 258 Silver Cypress Cir Summerville, SC | 5.0 | 4.5 | 3216 | $3,900 | $1.21 | 21d | 1 | 1.14mi |
HOA detail
- Monthly dues
- $33 · $396/yr
Listing history 12 events
-
2026-06-22statusdays on market $425,000 Active 16 DOM
-
2026-06-18days on market $425,000 Active Under Contract 13 DOM
-
2026-06-17days on market $425,000 Active Under Contract 12 DOM
-
2026-06-16days on market $425,000 Active Under Contract 11 DOM
-
2026-06-15days on market $425,000 Active Under Contract 10 DOM
-
2026-06-13days on market $425,000 Active Under Contract 8 DOM
-
2026-06-13days on market $425,000 Active Under Contract 7 DOM
-
2026-06-10days on market $425,000 Active Under Contract 5 DOM
-
2026-06-09days on market $425,000 Active Under Contract 4 DOM
-
2026-06-08statusdays on market $425,000 Active Under Contract 3 DOM
-
2026-06-07remarks 699-char remark
-
2026-06-07$425,000 Active 2 DOM
ⓘ Source: listings_history table (triggers on properties + properties_extension) + one-shot
backfill from property_details.listing_events for pre-trigger history.
Tax reassessment forecast SC · Resets to sale price
- Current annual tax
- $1,736 · $145/mo
- Projected year-2 tax
- $2,422 · $202/mo
- Expected delta
- +$686/yr (+$57/mo · 39.5%)
ⓘ Screening estimate from a state-policy table — verify with the county assessor before closing.
Climate risk First Street
- Flood 1/10 Low FEMA zone X (unshaded) · 0% chance over 30 yrs
- Wildfire 2/10 Low
- Heat 9/10 Extreme 7 d/yr ≥109°F today · 18 d/yr by 30 yrs out
- Wind 8/10 Severe 97% chance of damaging wind over 30 yrs
- Air quality 2/10 Low 2 unhealthy d/yr today · 2 by 30 yrs out
Nearby sold comps map
Loading sold comps map…
Walkable amenities ~0.75 mi
Loading nearby amenities…
Taxation est. · year 1
- Rental income
- $36,940
- − Mortgage interest
- −$23,807
- − Property taxes
- −$1,736
- − Insurance
- −$2,125
- − Repairs & maintenance
- −$2,955
- − Management
- −$2,955
- − HOA
- −$396
- − Depreciation
- −$12,364
- Taxable loss
- −$9,398
- Est. tax savings @ 24.0%
- +$2,255
- After-tax cash flow
- $436/yr
For passive investors: Depreciation is non-cash, so a rental often shows a tax loss while cash-flowing — sheltering income. Rental losses are passive: they offset passive income freely, and up to $25,000/yr can offset ordinary (W-2) income if you actively participate and your MAGI is under $100k (phasing out to $0 by $150k); unused losses carry forward. On sale, claimed depreciation is recaptured at up to 25%, and gains may owe capital-gains tax (a 1031 exchange can defer both). Figures are a year-1 estimate at your 24.0% rate — not tax advice; consult a CPA.
Schools (NCES district)
- District
- Dorchester 02
- NCES district ID
- 4502010
- Math proficiency
- 40% ▼ -13.00%
- Reading proficiency
- 55% ▼ -4.00%
- Median HH income
- $57,937
- Composite
- 41.41/100
- National rank
- #3475
- State rank
- #12 of 80 in SC
Livability — Summerville
- Score
- 63/100
- State rank
- #167
- US rank
- #15058
Category grades
Schools grade is shown separately in the Schools card above.
Census & demographics
- County
- Dorchester County · 182,866 people
- City population
- 171,668
- Metro
- Charleston-North Charleston, SC
- Population (ZIP)
- 58,507
- Household income
- $82,987
- Rent vs Own
- Severe rent burden
- 1302.0
Population outlook (Dorchester County) Hauer SSP2
- Today (2025)
- 186,982 people
- By 2030
- 203,967 · +9.1%
- By 2040
- 237,160 · +26.8%
- By 2050
- 267,479 · +43.1%
- By 2075
- 333,025 · +78.1%
- By 2100
- 366,560 · +96.0%
Race, ethnicity, and origin ACS 2023
- Neighborhood character
- Diverse neighborhood (Simpson 0.57)
- Race & ethnicity
- White 61% Black 23% Hispanic / Latino 7% Two or more races 7% Asian 3% Pacific Islander 2%
- Hispanic origin (detail)
- Mexican 4% Puerto Rican 1%
- Common ancestry
- Slovak 3% Italian 2% Lithuanian 2%
- Foreign-born
- 7% · Canada, China, Vietnam
- Languages at home
- 92% English-only · Spanish 4% Chinese 1% Russian/Polish/Slavic 1%
Political lean MEDSL · Dorchester
- 2024 margin
- R (+14.6) · D 41.8% · R 56.4% · Other 1.9%
- 2008→2024 swing
- +0.9pp no change · 2008: -15.5pp · 2024: -14.6pp
- All cycles
- 2024: R+14.6 2020: R+10.5 2016: R+17.5 2012: R+16.0 2008: R+15.5
Not yet ingested
- Civics
- —
Market trends
- HPI YoY
- ▼ -305.43%
- Current HPI
- 210.8607
- Rent YoY
- ▲ 3.93%
- Metro
- Charleston-North Charleston, SC
- State GDP YoY
- ▲ 4.51%
- F500 in state
- 2
Industry mix (Fortune 500 HQ in SC)
| Industry | F500 HQs | Revenue |
|---|---|---|
| Packaging | 1 | $7B |
|
||
Price history
+51.2% since first listed5 events — show timeline
- 2026-06-05 Listed $425,000 Charleston Trident MLS
- 2007-01-30 Sold (MLS) $259,500 Charleston Trident MLS
- 2006-10-30 Listed $277,380 Charleston Trident MLS
- 2006-10-28 Listing Removed — Charleston Trident MLS
- 2006-04-06 Listed $281,080 Charleston Trident MLS
Property tax history
+1.7%/yrLatest (2025): $1,736 · +0.0% YoY. Source: county tax records.
Cash-flow waterfall
monthlySold comps — $/sqft
last 12 mo · ≤1 miLoading sold comps…