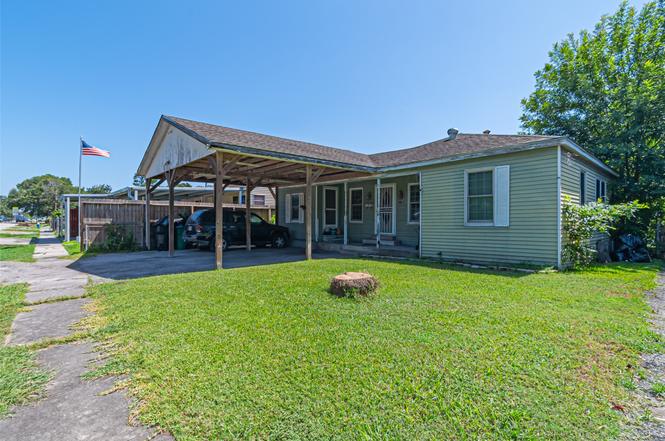
1139 Gazin St · Houston, TX
Flood risk 6/10 · Moderate
- FEMA flood zone
- X (unshaded)
- Chance of flooding over 30 yrs
- 0.68%
- Est. flood insurance / yr
- $507 – $1,088
Fire risk 1/10 · Minimal
- Est. fire insurance / yr
- $1,222 – $2,270
Heat risk 9/10 · Severe
- Hot days now (above 110°F)
- 7 days/yr
- Hot days in 30 yrs
- 24 days/yr
Wind risk 9/10 · Severe
- Chance of severe wind over 30 yrs
- 99.0%
Air-quality risk 3/10 · Minor
- Unhealthy air days now
- 2 days/yr
- Unhealthy air days in 30 yrs
- 3 days/yr
Risk factors via First Street. Map © Google.
Why this score? — see what drove the A grade
The composite is a weighted blend of 9 inputs, each scored 0–100. Each bar is that input's sub-score; the figure is the points it added to the 100-point composite (weight × sub-score).
- Cash flow +30.0/30.0
- ARV discount +15.0/15.0
- 1% rule +10.0/10.0
- DSCR +10.0/10.0
- Appreciation +10.0/10.0
- Livability +3.7/5.0
- Rent growth +3.6/5.0
- Schools +2.7/10.0
- Condition / age +2.5/5.0
$120,000
🖨 Deal sheet 📄 Offer letter ✓ Due diligence
Listing remarks
Located in Denver Harbor, this three-bedroom, one-bath home with a first-floor game room, family room, laminate flooring and two-car carport offers outstanding investment potential. Whether you’re a first-time buyer, investor, or developer, this property delivers options to renovate for rental income, remodel to your taste, or clear for new construction. Denver Harbor is rapidly growing with new builds and revitalization and this location can’t be beat: just seconds from I-10, across from McReynolds Middle School and minutes to downtown Houston, the East River project, Minute Maid Park, Toyota Center, Discovery Green and more. With easy access to major highways, business hubs an
Key facts
- Laminate flooring
- Investment potential
- Two car carport
Tags
Neighborhood map
What this means for you Summary
Snapshot
- This is a 3-bed/1.0-bath single-family listed at $120k.
Deal economics
- At list price, monthly cash flow is $703 ($8k/yr) — positive.
- The deal already cash-flows at list — no discount required.
- Meets the 1% rule at list price ($2k rent vs $120k).
- Recommended offer: $116k (3.0% below list) — sets the bar for market timing.
Location & tenants
- Location reads 74/100 on livability (#184 in TX, #4,771 nationally) — a middle-class / working-renter tenant base. Strengths: amenities A+, cost of living A+, housing A+; Watch: crime F.
- Houston ISD (urban): math 27% / reading 35% proficiency, ranked #593 of 826 in TX (top 72%) — families likely to look elsewhere, expect single-tenant / working-renter base with shorter leases; 71% free/reduced lunch — lower-income household profile, screen leases tightly.
- Zoned schools: Mcreynolds Middle (math 10% / reading 17%, grade F, #1,602 of 1,662 statewide, top 97%, 398 students, 98% FRL); Wheatley H S (math 17% / reading 19%, grade F, #1,445 of 1,632 statewide, top 89%, 643 students, 95% FRL) — zoned schools average 97% FRL vs 71% district-wide (26 pts higher); higher-poverty schools than district average — tighter screening recommended.
- Zoned-school proficiency averages 16% at this address vs 31% district-wide (-15 pts) — the specific schools serving this property underperform the Houston ISD average; the district grade overstates school quality for this exact location.
- Market conditions: Rents rising fast (+4.3%/yr); 337 active listings in the ZIP; 7 comparable units currently listed for rent nearby; rentals at typical pace (median 21d on market — plan ~3-4 weeks tenant-placement turnaround); 29,883 units permitted in Harris County in 2024 (8,621 in 5+ unit buildings).
Forward outlook
- In year one you build about $13k of equity ($830 loan paydown + $12k appreciation (10.0% local appreciation)).
- Harris County population projected at +47% by 2050 — long-run rental-demand tailwind backs the buy-and-hold thesis.
- At projected returns (10.0% appreciation + 4.3% rent growth), your $34k cash investment doubles in ~2 years — after that, you're playing with house money.
- By year 3, paydown + projected appreciation supports a ~$32k cash-out refi (75% LTV) — recoverable capital for the next deal without selling this one.
Negotiation context
- It's been on market 39 days — a 3% lower offer ($116k) is reasonable based on typical stale-listing flexibility.
- 2 sale attempts with the ask held roughly flat each time — persistent listings suggest the price (not the market) is what's stuck; bring a comps-based counter.
Risks & watch-outs
- Watch-outs: built in 1947 — expect roof / HVAC / electrical / plumbing capex.
- Climate carrying-cost: major flood risk; severe wind risk, 99% chance of damaging wind over 30y; extreme-heat days projected 7→24/yr by 2055 (HVAC capex compounding) — expect insurance premiums to compound above CPI over the hold.
Questions for the listing agent
- It's been on market 39 days. Have you received any prior offers? Is the seller open to a 3% concession, seller financing, or rate buy-down credit?
- Built in 1947 — when were the roof, HVAC, electrical panel, plumbing, and water heater last replaced?
- Is there a deadline driving the sale (1031 exchange, divorce, estate, relocation)? That informs how much negotiation room exists.
- Schools are D-rated, which usually means shorter tenancies and higher turnover. Who's the typical renter profile here, and what's been the actual vacancy rate?
- Crime grade is F in this area — have there been break-ins, vandalism, or insurance claims at this property in the last 3 years? What carrier currently insures it and at what premium?
- What's the average days-on-market for RENTAL listings here right now (not sales)? A rising rental-DOM trend means longer vacancies and softer asking-rent achievability than the comps imply.
- What's the recent tenant-quality profile in this submarket — average credit score on applications, eviction rate, late-payment / NSF rate, and stable-employment percentage? A property-management company in the area should have these aggregated.
- How much new for-sale + rental construction is in the pipeline within 1–3 miles? Heavy new supply typically softens prices + rents 12–24 months out; constrained supply supports both.
Investment metrics
- 1% rule
- 1.71% ✓
- Cap rate
- 13.32%
- Cash-on-cash
- 25.11%
- DSCR
- 2.12
- GRM
- 4.9
CMA / ARV
- ARV (on-the-fly)
- $168,320
- Comps found
- 11
Show comp detail 11 sales within ~0.75 mi
| Address | Dist | Beds/Ba | Sqft | Sold | Price | $/sf | Match |
|---|---|---|---|---|---|---|---|
| 1014 Henke St | 0.24mi | 3/1.0 | 1,332 (+1%) | 2mo | $170,000 | $128 | 85 |
| 1102 Gazin St | 0.09mi | 4/2.5 (+1) | 1,235 (-6%) | 5mo | $189,000 | $153 | 71 |
| 1031 Zoe St | 0.16mi | 3/2.0 | 1,381 (+5%) | 12mo | $145,000 | $105 | 70 |
| 6925 El Paso St | 0.35mi | 3/1.0 | 1,272 (-3%) | 16mo | $160,000 | $126 | 65 |
| 7010 Tuck St | 0.29mi | 2/3.0 (-1) | 1,340 (+2%) | 15mo | $159,900 | $119 | 58 |
| 7222 Tuck St | 0.44mi | 3/2.0 | 1,300 (-1%) | 22mo | $244,900 | $188 | 55 |
| 7102 Tuck St | 0.35mi | 3/2.0 | 1,471 (+12%) | 6mo | $255,000 | $173 | 55 |
| 1110 Woolworth St | 0.29mi | 3/1.0 | 1,507 (+15%) | 20mo | $179,000 | $119 | 45 |
| 7438 Market St | 0.72mi | 2/0.5 (-1) | 1,200 (-9%) | 9mo | $275,000 | $229 | 37 |
| 630 Kress St | 0.68mi | 4/3.0 (+1) | 1,404 (+7%) | 8mo | $145,000 | $103 | 37 |
| 545 Henke St | 0.75mi | 2/1.5 (-1) | 1,484 (+13%) | 3mo | $255,000 | $172 | 34 |
Match score weights: distance 35% · size 25% · config 20% · recency 20%. Top-matched comps best support the ARV.
Projected returns pro-forma
10.0% appreciation · 4.27% rent growth · sell at horizon
- IRR
- 44.0%
- Equity multiple
- 4.36×
- Total profit
- $112,870
- Equity at exit
- $108,106
- IRR
- 38.6%
- Equity multiple
- 10.02×
- Total profit
- $303,016
- Equity at exit
- $233,134
Cash invested: $33,600 (down + closing). Projections, not guarantees.
Landlord ↔ Tenant lean methodology
- Overall (STATE)
- 87 Strongly Landlord-Friendly
- State Texas
- 87 Strongly Landlord-Friendly · R+5
- County
- — inherits STATE
- City
- — inherits STATE
ZIP-level market 77020
- Home prices YoY
- 29.1%
- Rents YoY
- 4.3%
- Active inventory
- 337
- Price-to-rent
- 4.9×
Monthly cashflow live
- Estimated rent
- $2,051 high interval (Pro) →
- Mortgage (P&I)
- −$629
- Tax from tax record
- −$238 /mo · $2,860/yr
- Insurance
- −$50
- HOA
- −$0
- Vacancy / Maint / Mgmt
- −$431
- Net cashflow
- $703
Break-even live
UW: 25.0% down · 7.5% · 30yr · 1.5% tax · 5.0% vac · 8.0% maint · 8.0% mgmt
Financing live
Cash to close
- Down payment
- $30,000
- Closing costs
- $3,600
- Reserves months
- —
- Total cash needed
- —
Loan-product check · same deal, 3 products live
Conventional
25% down · 7.5% · 30yr
- Down + closing
- —
- Monthly P&I
- —
- Monthly cashflow
- —
- DSCR
- —
- Eligible?
- —
Personal DTI + credit; lowest rate.
DSCR
20% down · 8.5% · 30yr
- Down + closing
- —
- Monthly P&I
- —
- Monthly cashflow
- —
- DSCR
- —
- Eligible?
- —
No personal income docs; deal must DSCR.
Hard money
10% down · 12.0% · 12mo
- Down + closing
- —
- Monthly P&I
- —
- Monthly cashflow
- —
- DSCR
- —
- Eligible?
- —
Short-term bridge; refi at stabilization.
Rent comps 7 comps
| Address | Beds | Baths | Sqft | Rent | $/sqft | DOM | Units | Dist |
|---|---|---|---|---|---|---|---|---|
| 1023 Hahlo St Houston, TX | 4.0 | 2.0 | 1434 | $1,775 | $1.24 | 5d | 1 | 0.35mi |
| 2105 Sam Wilson St Houston, TX | 3.0 | 2.5 | 1416 | $6,750 | $4.77 | 44d | 1 | 1.05mi |
| 5605 Mulvey St Unit 1019610P Houston, TX | 3.0 | 2.5 | 1410 | $4,237 | $3.00 | 3d | 1 | 1.06mi |
| 4712 Rawley St Unit B Houston, TX | 3.0 | 2.5 | 1501 | $2,045 | $1.36 | 21d | 1 | 1.33mi |
| 4712 Rawley St Unit a Houston, TX | 3.0 | 2.0 | 1501 | $2,070 | $1.38 | 21d | 1 | 1.33mi |
| 2704 Sam Wilson St Unit 1391353P Houston, TX | 2.0 | 2.0 | 1001 | $1,916 | $1.91 | 8d | 1 | 1.43mi |
| 4300 Lyons Ave Unit 304 Houston, TX | 4.0 | 2.0 | 1393 | $1,460 | $1.05 | 44d | 1 | 1.48mi |
Listing history 5 events
-
2025-10-21status Pending
-
2025-09-24status Active
-
2025-09-19status Pending
-
2025-09-07$120,000 Active
-
1988-01-02soldstatus
ⓘ Source: listings_history table (triggers on properties + properties_extension) + one-shot
backfill from property_details.listing_events for pre-trigger history.
Tax reassessment forecast TX · Resets to sale price
- Current annual tax
- $2,860 · $238/mo
- Projected year-2 tax
- $2,860 · $238/mo
- Expected delta
- $0/yr ($0/mo · 0.0%)
ⓘ Screening estimate from a state-policy table — verify with the county assessor before closing.
Climate risk First Street
- Flood 6/10 Major FEMA zone X (unshaded) · 68% chance over 30 yrs
- Wildfire 1/10 Low
- Heat 9/10 Extreme 7 d/yr ≥110°F today · 24 d/yr by 30 yrs out
- Wind 9/10 Extreme 99% chance of damaging wind over 30 yrs
- Air quality 3/10 Moderate 2 unhealthy d/yr today · 3 by 30 yrs out
Nearby sold comps map
Loading sold comps map…
Walkable amenities ~0.75 mi
Loading nearby amenities…
Taxation est. · year 1
- Rental income
- $24,617
- − Mortgage interest
- −$6,722
- − Property taxes
- −$2,860
- − Insurance
- −$600
- − Repairs & maintenance
- −$1,969
- − Management
- −$1,969
- − Depreciation
- −$3,491
- Taxable income
- $7,006
- Est. tax owed @ 24.0%
- −$1,681
- After-tax cash flow
- $6,755/yr
For passive investors: Depreciation is non-cash, so a rental often shows a tax loss while cash-flowing — sheltering income. Rental losses are passive: they offset passive income freely, and up to $25,000/yr can offset ordinary (W-2) income if you actively participate and your MAGI is under $100k (phasing out to $0 by $150k); unused losses carry forward. On sale, claimed depreciation is recaptured at up to 25%, and gains may owe capital-gains tax (a 1031 exchange can defer both). Figures are a year-1 estimate at your 24.0% rate — not tax advice; consult a CPA.
Schools (NCES district)
- District
- Houston ISD
- NCES district ID
- 4823640
- Math proficiency
- 27% ▼ -18.00%
- Reading proficiency
- 35% ▼ -6.00%
- Median HH income
- $46,054
- Composite
- 26.63/100
- National rank
- #7173
- State rank
- #593 of 826 in TX
Livability — Houston
- Score
- 74/100
- State rank
- #184
- US rank
- #4771
Category grades
Schools grade is shown separately in the Schools card above.
Census & demographics
- Census place
- Houston, TX
- County
- Harris County · 4,702,590 people
- City population
- 3,226,434
- Metro
- Houston-The Woodlands-Sugar Land, TX
- Population (ZIP)
- 23,686
- Household income
- $50,119
- Rent vs Own
- Severe rent burden
- 969.0
Population outlook (Harris County) Hauer SSP2
- Today (2025)
- 5,571,493 people
- By 2030
- 6,089,821 · +9.3%
- By 2040
- 7,142,806 · +28.2%
- By 2050
- 8,185,864 · +46.9%
- By 2075
- 10,574,329 · +89.8%
- By 2100
- 12,109,958 · +117.4%
Race, ethnicity, and origin ACS 2023
- Neighborhood character
- Predominantly Hispanic (69%)
- Race & ethnicity
- Hispanic / Latino 69% Black 24% Two or more races 22% White 5% Asian 1%
- Hispanic origin (detail)
- Mexican 60%
- Common ancestry
- Swiss 1%
- Foreign-born
- 23% · Canada
- Languages at home
- 39% English-only · Spanish 59% Other Indo-European 1%
Political lean MEDSL · Harris
- 2024 margin
- Lean D (+5.5) · D 52.0% · R 46.4% · Other 1.6%
- 2008→2024 swing
- +3.9pp toward D · 2008: 1.6pp · 2024: 5.5pp
- All cycles
- 2024: D+5.5 2020: D+13.3 2016: D+12.4 2012: D+0.1 2008: D+1.6
Not yet ingested
- Civics
- —
Market trends
- HPI YoY
- ▲ 55.64%
- Current HPI
- 246.5578
- Rent YoY
- ▲ 4.27%
- Metro
- Houston-The Woodlands-Sugar Land, TX
- State GDP YoY
- ▲ 3.95%
- F500 in state
- 110
Industry mix (Fortune 500 HQ in TX)
| Industry | F500 HQs | Revenue |
|---|---|---|
| Energy | 16 | $1,198B |
|
||
| Technology | 5 | $198B |
|
||
| Engineering / Construction | 4 | $72B |
|
||
| Energy Services | 3 | $60B |
|
||
| Utilities | 3 | $41B |
|
||
| Healthcare | 2 | $330B |
|
||
Price history
5 events — show timeline
- 2025-10-21 Pending — HARMLS
- 2025-09-24 Relisted — HARMLS
- 2025-09-19 Pending — HARMLS
- 2025-09-07 Listed $120,000 HARMLS
- 1988-01-02 Sold (Public Records) — Public Records
Property tax history
+2.8%/yrLatest (2025): $2,860 · +11.7% YoY. Source: county tax records.
Cash-flow waterfall
monthlySold comps — $/sqft
last 12 mo · ≤1 miLoading sold comps…