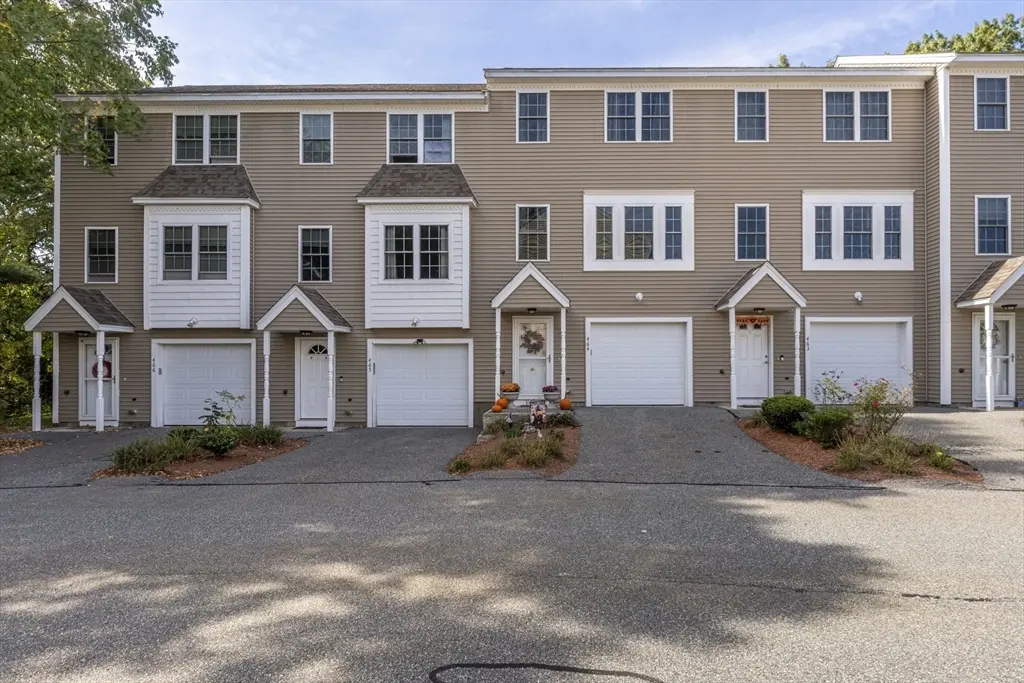
41 Boston Rd #464 · Lowell, MA
Flood risk 1/10 · Minimal
- FEMA flood zone
- X (unshaded)
- Chance of flooding over 30 yrs
- 0.0%
- Est. flood insurance / yr
- $473 – $860
Fire risk 1/10 · Minimal
- Est. fire insurance / yr
- $915 – $1,699
Heat risk 5/10 · Moderate
- Hot days now (above 98°F)
- 7 days/yr
- Hot days in 30 yrs
- 15 days/yr
Wind risk 6/10 · Moderate
- Chance of severe wind over 30 yrs
- 27.0%
Air-quality risk 3/10 · Minor
- Unhealthy air days now
- 2 days/yr
- Unhealthy air days in 30 yrs
- 3 days/yr
Risk factors via First Street. Map © Google.
Why this score? — see what drove the D grade
The composite is a weighted blend of 9 inputs, each scored 0–100. Each bar is that input's sub-score; the figure is the points it added to the 100-point composite (weight × sub-score).
- ARV discount +15.0/15.0
- Cash flow +8.6/30.0
- Schools +4.1/10.0
- Livability +4.0/5.0
- 1% rule +3.3/10.0
- Rent growth +2.5/5.0
- Condition / age +2.5/5.0
- DSCR +2.4/10.0
- Appreciation +0.0/10.0
$333,270
🖨 Deal sheet (PDF) 📄 Offer letter ✓ Due diligence
Listing remarks MLS
DEED RESTRICTED AFFORDABLE SALE! Located at the highly desirable Barrett Farm community in North Billerica, this bright 2 bedroom,1.5 bath townhome spans over three floors. Additional features include Central HVAC, private back porch overlooking the back yard as well as a garage and off street parking. Timing of closing is subject to seller finding suitable housing. Home subject to affordable housing and resale restrictions. Income Limits Apply: 1 Person: $73,200; 2 Person: $83,650; 3 Person: $94,100; 4 Person - $104,550. Asset limit: $75,000. Must be first time homebuyer. Property must be owner occupied.
Key facts
- Central hvac
- Off street parking
- Private back porch
Tags
Neighborhood map
What this means for you Summary
Snapshot
- This is a 2-bed/1.5-bath condo listed at $333k.
Deal economics
- At list price, monthly cash flow is $-287 ($-3k/yr) — negative.
- To cash-flow at today's rent, offer at most $283k (15.2% below list).
- To meet the 1% rule (rent ≥ 1% of price), the offer needs to be $275k (17.4% below list).
- Recommended offer: $275k (17.4% below list) — sets the bar for 1% rule.
- Cap rate 5.3% vs local median 2.9% in Lowell — top-decile yield for the area; either an underpriced asset or a hidden risk that comps aren't pricing in. Stress-test before assuming the spread holds.
Location & tenants
- Location reads 80/100 on livability (#36 in MA, #1,677 nationally) — a professional / high-income tenant draw. Strengths: amenities A+, commute A+, health & safety A+; Watch: crime F, cost of living F.
- Billerica (suburban): math 36% / reading 51% proficiency, ranked #154 of 302 in MA (top 51%) — families likely to look elsewhere, expect single-tenant / working-renter base with shorter leases; only 13% free/reduced lunch — higher-income household profile.
- Zoned schools: Hajjar Elementary (math 47% / reading 57%, grade C-, #287 of 938 statewide, top 33%, 375 students, 0% FRL); Marshall Middle School (math 28% / reading 47%, grade F, #158 of 305 statewide, top 53%, 604 students, 0% FRL); Billerica Memorial High School (math 36% / reading 48%, grade F, #214 of 343 statewide, top 65%, 1,726 students, 0% FRL).
- Market conditions: 12 active listings in the ZIP; 7 comparable units currently listed for rent nearby; rentals leasing fast (median 13d on market — plan ~1-2 weeks tenant-placement turnaround); high-income renter base; 3,670 units permitted in Middlesex County in 2024 (2,611 in 5+ unit buildings).
Forward outlook
- Local home prices are declining (-3.0%/yr); year-one equity from $2k of loan paydown is wiped out by about $10k of value loss. Plan a longer hold.
- Middlesex County population projected at +20% by 2050 — long-run rental-demand tailwind backs the buy-and-hold thesis.
Negotiation context
- It's been on market 150 days — a 12% lower offer ($293k) is reasonable based on typical stale-listing flexibility.
- Current owner paid $170k; list at $333k implies a 96% gain — meaningful room to come down on a strong offer.
Risks & watch-outs
- Climate carrying-cost: major wind risk, 27% chance of damaging wind over 30y; extreme-heat days projected 7→15/yr by 2055 (HVAC capex compounding) — expect insurance premiums to compound above CPI over the hold.
Questions for the listing agent
- What do current leases actually rent for vs. the listed asking? Can we see a recent rent roll and the last 12 months of T-12 income?
- It's been on market 150 days. Have you received any prior offers? Is the seller open to a 17% concession, seller financing, or rate buy-down credit?
- What does the HOA fee cover, when was the last increase, and are there any pending special assessments or reserve-fund shortfalls?
- Any open or pending special assessments — roof, HVAC, plumbing, elevator, façade? What's the per-unit balance and payoff schedule, and is the seller paying it off at close or rolling it to the buyer?
- Why hasn't it sold? Are there any deal-killer items the seller is aware of (foundation, flood, title, zoning, code violations)?
- Is there a deadline driving the sale (1031 exchange, divorce, estate, relocation)? That informs how much negotiation room exists.
- Crime grade is F in this area — have there been break-ins, vandalism, or insurance claims at this property in the last 3 years? What carrier currently insures it and at what premium?
- The area grade is low — what's the realistic commute time and amenity access for the typical tenant pool here? Any planned neighborhood developments (good or bad) we should know about?
- What's the average days-on-market for RENTAL listings here right now (not sales)? A rising rental-DOM trend means longer vacancies and softer asking-rent achievability than the comps imply.
- What's the recent tenant-quality profile in this submarket — average credit score on applications, eviction rate, late-payment / NSF rate, and stable-employment percentage? A property-management company in the area should have these aggregated.
- How much new apartment / multifamily construction is in the pipeline within 1–3 miles? Heavy new supply (>2% of stock underway) typically softens rents 12–24 months out; light construction supports rent growth.
Investment metrics
- 1% rule
- 0.83% ✗
- Cap rate
- 5.26%
- Cash-on-cash
- -3.69%
- DSCR
- 0.84
- GRM
- 10.1
CMA / ARV
- ARV (median comp)
- $486,193
- List price
- $333,270
- Delta
- -31.45%
- Verdict
- UNDERPRICED
- Comps
- 20 within 1.0 mi
Projected returns pro-forma
-3.0% appreciation · 3.0% rent growth · sell at horizon
- IRR
- -22.4%
- Equity multiple
- 0.23×
- Total profit
- $-72,147
- Equity at exit
- $49,692
- IRR
- -16.5%
- Equity multiple
- 0.08×
- Total profit
- $-85,801
- Equity at exit
- $28,815
Cash invested: $93,316 (down + closing). Projections, not guarantees.
Landlord ↔ Tenant lean methodology
- Overall (STATE)
- 20 Strongly Tenant-Friendly
- State Massachusetts
- 20 Strongly Tenant-Friendly · D+15
- County
- — inherits STATE
- City
- — inherits STATE
ZIP-level market 01862
- Home prices YoY
- -32.7%
- Active inventory
- 12
- Price-to-rent
- 10.1×
Monthly cashflow live
- Estimated rent
- $2,752 high interval (Pro) →
- Mortgage (P&I)
- −$1,748
- Tax from tax record
- −$294 /mo · $3,522/yr
- Insurance
- −$139
- HOA
- −$281
- Vacancy / Maint / Mgmt
- −$578
- Net cashflow
- $-287
Break-even live
Sensitivity live
| Price | -10% $-98 | -5% $-193 | +0% $-287 | +5% $-381 | +10% $-476 |
|---|---|---|---|---|---|
| Rent | -10% $-504 | -5% $-396 | +0% $-287 | +5% $-178 | +10% $-70 |
| Rate | -1.0pp $-119 | -0.5pp $-202 | base $-287 | +0.5pp $-373 | +1.0pp $-461 |
UW: 25.0% down · 7.5% · 30yr · 1.5% tax · 5.0% vac · 8.0% maint · 8.0% mgmt
Financing live
Cash to close
- Down payment
- $83,318
- Closing costs
- $9,998
- Reserves months
- —
- Total cash needed
- —
Loan-product check · same deal, 3 products live
Conventional
25% down · 7.5% · 30yr
- Down + closing
- —
- Monthly P&I
- —
- Monthly cashflow
- —
- DSCR
- —
- Eligible?
- —
Personal DTI + credit; lowest rate.
DSCR
20% down · 8.5% · 30yr
- Down + closing
- —
- Monthly P&I
- —
- Monthly cashflow
- —
- DSCR
- —
- Eligible?
- —
No personal income docs; deal must DSCR.
Hard money
10% down · 12.0% · 12mo
- Down + closing
- —
- Monthly P&I
- —
- Monthly cashflow
- —
- DSCR
- —
- Eligible?
- —
Short-term bridge; refi at stabilization.
Rent comps 7 comps
| Address | Beds | Baths | Sqft | Rent | $/sqft | DOM | Units | Dist |
|---|---|---|---|---|---|---|---|---|
| 82 Brick Kiln Rd Chelmsford, MA | 2.0 | 1.0 | 540 | $2,577 | $4.77 | 0d | 10 | 0.26mi |
| 117 Gorham St Chelmsford, MA | 3.0 | 1.0 | 1095 | $3,000 | $2.74 | 21d | 1 | 0.51mi |
| 2 Mason Ave Unit 1 North Billerica, MA | 3.0 | 1.0 | 1016 | $3,000 | $2.95 | 12d | 1 | 0.90mi |
| 13 Sprague St Unit 13 North Billerica, MA | 2.0 | 1.0 | 1230 | $2,800 | $2.28 | 45d | 1 | 0.96mi |
| 90 Wilson St North Billerica, MA | 3.0 | 1.0 | 1250 | $2,300 | $1.84 | 12d | 1 | 1.02mi |
| 1524 Gorham St #209 Lowell, MA | 2.0 | 1.0 | 857 | $2,500 | $2.92 | 45d | 1 | 1.16mi |
| 276 Mill Rd Chelmsford, MA | 1.0–2.0 | 1.0–2.0 | 942 | $3,299 | $3.50 | 0d | 9 | 1.22mi |
HOA detail condo
- Monthly dues
- $281 · $3,372/yr
- Assessments
- None detected in remarks — confirm with the listing agent.
Listing history 16 events
-
2026-06-21days on market $333,270 Active 150 DOM
-
2026-06-18days on market $333,270 Active 147 DOM
-
2026-06-17days on market $333,270 Active 146 DOM
-
2026-06-16days on market $333,270 Active 145 DOM
-
2026-06-15days on market $333,270 Active 144 DOM
-
2026-06-13days on market $333,270 Active 142 DOM
-
2026-06-09days on market $333,270 Active 138 DOM
-
2026-06-08days on market $333,270 Active 137 DOM
-
2026-06-07days on market $333,270 Active 136 DOM
-
2026-06-04days on market $333,270 Active 133 DOM
-
2026-06-03days on market $333,270 Active 132 DOM
-
2026-06-02days on market $333,270 Active 131 DOM
-
2026-06-01days on market $333,270 Active 130 DOM
-
2026-05-31days on market $333,270 Active 129 DOM
-
2026-01-22$333,270 New 628-char remark
Show marketing remark (628 chars)
DEED RESTRICTED AFFORDABLE SALE! Located at the highly desirable Barrett Farm community in North Billerica, this bright 2 bedroom,1.5 bath townhome spans over three floors. Additional features include Central HVAC, private back porch overlooking the back yard as well as a garage and off street parking. Timing of closing is subject to seller finding suitable housing. Home subject to affordable housing and resale restrictions. Income Limits Apply: 1 Person: $73,200; 2 Person: $83,650; 3 Person: $94,100; 4 Person - $104,550. Asset limit: $75,000. Must be first time homebuyer. Property must be owner occupied.
-
2013-10-25soldstatus $170,000
ⓘ Source: listings_history table (triggers on properties + properties_extension) + one-shot
backfill from property_details.listing_events for pre-trigger history.
Tax reassessment forecast MA · Partial reset (capped growth)
- Current annual tax
- $3,522 · $294/mo
- Projected year-2 tax
- $3,811 · $318/mo
- Expected delta
- +$289/yr (+$24/mo · 8.2%)
ⓘ Screening estimate from a state-policy table — verify with the county assessor before closing.
Climate risk First Street
- Flood 1/10 Low FEMA zone X (unshaded) · 0% chance over 30 yrs
- Wildfire 1/10 Low
- Heat 5/10 Major 7 d/yr ≥98°F today · 15 d/yr by 30 yrs out
- Wind 6/10 Major 27% chance of damaging wind over 30 yrs
- Air quality 3/10 Moderate 2 unhealthy d/yr today · 3 by 30 yrs out
Nearby sold comps map
Loading sold comps map…
Walkable amenities ~0.75 mi
Loading nearby amenities…
Taxation est. · year 1
- Rental income
- $33,023
- − Mortgage interest
- −$18,668
- − Property taxes
- −$3,522
- − Insurance
- −$1,666
- − Repairs & maintenance
- −$2,642
- − Management
- −$2,642
- − HOA
- −$3,372
- − Depreciation
- −$9,695
- Taxable loss
- −$9,184
- Est. tax savings @ 24.0%
- +$2,204
- After-tax cash flow
- $-1,240/yr
For passive investors: Depreciation is non-cash, so a rental often shows a tax loss while cash-flowing — sheltering income. Rental losses are passive: they offset passive income freely, and up to $25,000/yr can offset ordinary (W-2) income if you actively participate and your MAGI is under $100k (phasing out to $0 by $150k); unused losses carry forward. On sale, claimed depreciation is recaptured at up to 25%, and gains may owe capital-gains tax (a 1031 exchange can defer both). Figures are a year-1 estimate at your 24.0% rate — not tax advice; consult a CPA.
Schools (NCES district)
- District
- Billerica
- NCES district ID
- 2502670
- Math proficiency
- 36% ▼ -14.00%
- Reading proficiency
- 51% ▼ -4.00%
- Median HH income
- $92,064
- Composite
- 41.36/100
- National rank
- #3494
- State rank
- #154 of 302 in MA
Livability — Lowell
- Score
- 80/100
- State rank
- #36
- US rank
- #1677
Category grades
Schools grade is shown separately in the Schools card above.
Census & demographics
- County
- Middlesex County · 1,437,704 people
- City population
- 100,628
- Metro
- Boston-Cambridge-Newton, MA-NH
- Population (ZIP)
- 12,129
- Household income
- $138,571
- Rent vs Own
- Severe rent burden
- 317.0
Population outlook (Middlesex County) Hauer SSP2
- Today (2025)
- 1,740,269 people
- By 2030
- 1,817,187 · +4.4%
- By 2040
- 1,963,195 · +12.8%
- By 2050
- 2,087,461 · +20.0%
- By 2075
- 2,344,036 · +34.7%
- By 2100
- 2,383,776 · +37.0%
Race, ethnicity, and origin ACS 2023
- Neighborhood character
- Predominantly White (70%)
- Race & ethnicity
- White 70% Hispanic / Latino 9% Two or more races 8% Black 8% Asian 6%
- Hispanic origin (detail)
- Puerto Rican 2%
- Common ancestry
- Hispanic 6% Lithuanian 3% Estonian 2%
- Foreign-born
- 15% · Canada, Jamaica, China
- Languages at home
- 79% English-only · Other Indo-European 8% Spanish 7% French/Haitian/Cajun 2%
Political lean MEDSL · Middlesex
- 2024 margin
- Solid D (+39.5) · D 68.5% · R 29.0% · Other 2.5%
- 2008→2024 swing
- +9.3pp toward D · 2008: 30.1pp · 2024: 39.5pp
- All cycles
- 2024: D+39.5 2020: D+45.2 2016: D+38.1 2012: D+26.9 2008: D+30.1
Not yet ingested
- Civics
- —
Market trends
- HPI YoY
- ▼ -142.25%
- Current HPI
- 292.3284
- Rent YoY
- —
- Metro
- Boston-Cambridge-Newton, MA-NH
- State GDP YoY
- ▲ 2.28%
- F500 in state
- 38
Industry mix (Fortune 500 HQ in MA)
| Industry | F500 HQs | Revenue |
|---|---|---|
| Technology | 3 | $17B |
|
||
| Insurance | 2 | $84B |
|
||
| Retail | 2 | $76B |
|
||
| Life Sciences | 1 | $43B |
|
||
| Energy Technology | 1 | $31B |
|
||
| Aerospace / Defense | 1 | $18B |
|
||
Price history
+96.0% since first listed2 events — show timeline
- 2026-01-22 Listed $333,270 MLS PIN
- 2013-10-25 Sold (Public Records) $170,000 Public Records
Property tax history
+3.5%/yrLatest (2025): $3,522 · +14.9% YoY. Source: county tax records.
Cash-flow waterfall
monthlySold comps — $/sqft
last 12 mo · ≤1 miLoading sold comps…