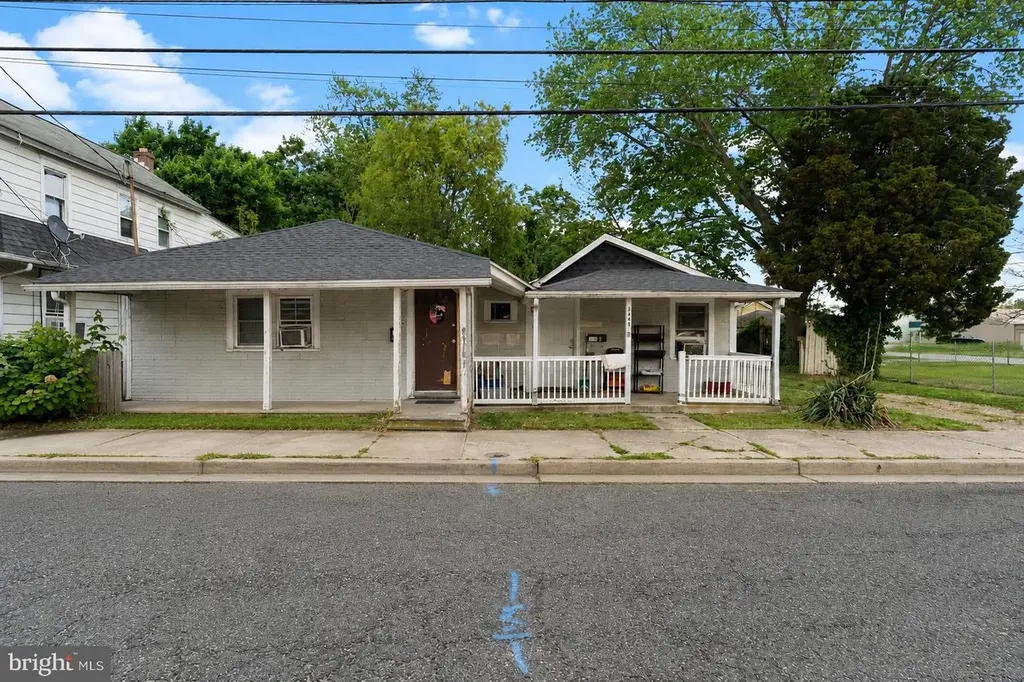
344 Keasbey St · Salem, NJ
Flood risk 6/10 · Moderate
- FEMA flood zone
- X (unshaded)
- Chance of flooding over 30 yrs
- 0.51%
- Est. flood insurance / yr
- $507 – $1,088
Fire risk 3/10 · Minor
- Est. fire insurance / yr
- $526 – $976
Heat risk 8/10 · Major
- Hot days now (above 102°F)
- 7 days/yr
- Hot days in 30 yrs
- 15 days/yr
Wind risk 6/10 · Moderate
- Chance of severe wind over 30 yrs
- 27.0%
Air-quality risk 3/10 · Minor
- Unhealthy air days now
- 2 days/yr
- Unhealthy air days in 30 yrs
- 4 days/yr
Risk factors via First Street. Map © Google.
Why this score? — see what drove the B+ grade
The composite is a weighted blend of 9 inputs, each scored 0–100. Each bar is that input's sub-score; the figure is the points it added to the 100-point composite (weight × sub-score).
- Cash flow +30.0/30.0
- ARV discount +15.0/15.0
- 1% rule +10.0/10.0
- DSCR +10.0/10.0
- Appreciation +4.8/10.0
- Livability +3.1/5.0
- Rent growth +2.5/5.0
- Condition / age +2.5/5.0
- Schools +1.2/10.0
$145,000
🖨 Deal sheet 📄 Offer letter ✓ Due diligence
Listing remarks MLS
2 - 2Br Ranchers W/ Separate Entrances And Adjoining Door, Zoned As Single Family Home. 2 Full Baths, 2Nd Kitchen Listed As Laundry Room, Property Being Sold As-Is. Handyman Special. DRASTICALLY REDUCED!!!
Key facts
- 5,510 sq ft lot
- 2 parking spots
- Built 1930
Property features AI
Finance
- Financial info: Ownership is Fee Simple; Property has a month-to-month existing lease
Exterior
- Parking: Driveway parking; Driveway fits 2 vehicles; Total of 2 garage/parking spaces
- Utilities: Public water; Public sewer; Hot water: Other
- Home design: Detached structure; Single-family / one unit
- Construction: Permanent foundation
- Exterior features: Front porch(es); Detached shed; Lot dimensions approximately 58 x 95
Interior
- Bedrooms: One 3-bedroom unit; One 2-bedroom unit
- Flooring: Vinyl
- Heating & cooling: Forced air heating; Window unit cooling
- Interior features: Vinyl flooring; No basement; 9 total rooms
Neighborhood map
What this means for you Summary
Snapshot
- This is a 5-bed/?-bath single-family listed at $145k.
Deal economics
- At list price, monthly cash flow is $659 ($8k/yr) — positive.
- The deal already cash-flows at list — no discount required.
- Meets the 1% rule at list price ($2k rent vs $145k).
- Recommended offer: $141k (3.0% below list) — sets the bar for market timing.
- Cap rate 11.7% vs local median 8.4% in Salem — top-decile yield for the area; either an underpriced asset or a hidden risk that comps aren't pricing in. Stress-test before assuming the spread holds.
Location & tenants
- Location reads 61/100 on livability (#462 in NJ) — a middle-class / working-renter tenant base. Strengths: cost of living A+, health & safety A+, crime B; Watch: schools D, amenities F, commute F.
- Salem City School District (town): math 6% / reading 24% proficiency, ranked #464 of 472 in NJ (top 98%) — low school quality limits family demand, transient renter base, plan for 1-2y turnover; 85% free/reduced lunch — lower-income household profile, screen leases tightly.
- Market conditions: 100 active listings in the ZIP; 1 comparable units currently listed for rent nearby; 95 units permitted in Salem County in 2024 (0 in 5+ unit buildings).
- At $2,297/mo this rent would consume 50% of the median local household income ($55k/yr) (locally 663% of renters already pay >50% of income on rent) — very limited rent-growth headroom before tenants either downsize or default.
Forward outlook
- In year one you build about $451 of equity ($1k loan paydown + $-551 appreciation (-0.4% local appreciation)).
- Salem County population projected at -23% by 2050 — secular population decline; favor cash flow + early exit over multi-decade hold.
- At projected returns (-0.4% appreciation + 3.0% rent growth), your $41k cash investment doubles in ~5 years — after that, you're playing with house money.
Negotiation context
- It's been on market 38 days — a 3% lower offer ($141k) is reasonable based on typical stale-listing flexibility.
- 2 sale attempts since 25y ago with the ask held roughly flat each time — persistent listings suggest the price (not the market) is what's stuck; bring a comps-based counter.
- Current owner paid $36k; list at $145k implies a 303% gain — meaningful room to come down on a strong offer.
Risks & watch-outs
- Watch-outs: property tax is 2.8% of price; built in 1930 — expect roof / HVAC / electrical / plumbing capex.
- Climate carrying-cost: major flood risk; major wind risk, 27% chance of damaging wind over 30y; extreme-heat days projected 7→15/yr by 2055 (HVAC capex compounding) — expect insurance premiums to compound above CPI over the hold.
Questions for the listing agent
- It's been on market 38 days. Have you received any prior offers? Is the seller open to a 3% concession, seller financing, or rate buy-down credit?
- Built in 1930 — when were the roof, HVAC, electrical panel, plumbing, and water heater last replaced?
- Property tax is high relative to price — has the assessment been appealed recently, and will the sale trigger a re-assessment?
- Is there a deadline driving the sale (1031 exchange, divorce, estate, relocation)? That informs how much negotiation room exists.
- Schools are D-rated, which usually means shorter tenancies and higher turnover. Who's the typical renter profile here, and what's been the actual vacancy rate?
- What's the average days-on-market for RENTAL listings here right now (not sales)? A rising rental-DOM trend means longer vacancies and softer asking-rent achievability than the comps imply.
- What's the recent tenant-quality profile in this submarket — average credit score on applications, eviction rate, late-payment / NSF rate, and stable-employment percentage? A property-management company in the area should have these aggregated.
- How much new for-sale + rental construction is in the pipeline within 1–3 miles? Heavy new supply typically softens prices + rents 12–24 months out; constrained supply supports both.
Investment metrics
- 1% rule
- 1.58% ✓
- Cap rate
- 11.75%
- Cash-on-cash
- 19.48%
- DSCR
- 1.87
- GRM
- 5.3
CMA / ARV
- ARV (on-the-fly)
- $189,060
- Comps found
- 12
Show comp detail 12 sales within ~0.75 mi
| Address | Dist | Beds/Ba | Sqft | Sold | Price | $/sf | Match |
|---|---|---|---|---|---|---|---|
| 337 Craven Ave | 0.22mi | 5/2.0 | 2,205 (+7%) | 9mo | $306,000 | $139 | 70 |
| 26 Olive St | 0.32mi | 4/1.0 (-1) | 2,164 (+5%) | 3mo | $200,000 | $92 | 69 |
| 334 Craven Ave | 0.23mi | 4/1.5 (-1) | 1,843 (-10%) | 2mo | $245,000 | $133 | 65 |
| 320 Fenwick Ave | 0.31mi | 4/2.0 (-1) | 1,958 (-5%) | 18mo | $190,000 | $97 | 58 |
| 187 7th St | 0.57mi | 4/2.0 (-1) | 1,929 (-6%) | 3mo | $67,000 | $35 | 56 |
| 93 7th St | 0.69mi | 6/2.5 (+1) | 2,042 (-1%) | 8mo | $183,000 | $90 | 55 |
| 349 E Broadway | 0.22mi | 5/2.0 | 2,348 (+14%) | 16mo | $65,000 | $28 | 53 |
| 216 N Union St | 0.19mi | 4/2.0 (-1) | 1,798 (-12%) | 16mo | $265,000 | $147 | 52 |
| 6 Walnut St | 0.55mi | 4/2.0 (-1) | 1,764 (-14%) | 2mo | $70,000 | $40 | 44 |
| 35 Walnut St | 0.55mi | 4/1.5 (-1) | 2,278 (+11%) | 9mo | $180,000 | $79 | 44 |
| 56 New Market St | 0.59mi | 4/1.5 (-1) | 2,240 (+9%) | 15mo | $50,000 | $22 | 40 |
| 61 Eighth St | 0.71mi | 4/2.5 (-1) | 2,344 (+14%) | 11mo | $230,000 | $98 | 29 |
Match score weights: distance 35% · size 25% · config 20% · recency 20%. Top-matched comps best support the ARV.
Projected returns pro-forma
-0.38% appreciation · 3.0% rent growth · sell at horizon
- IRR
- 18.4%
- Equity multiple
- 1.87×
- Total profit
- $35,283
- Equity at exit
- $39,368
- IRR
- 23.2%
- Equity multiple
- 3.50×
- Total profit
- $101,455
- Equity at exit
- $45,191
Cash invested: $40,600 (down + closing). Projections, not guarantees.
Landlord ↔ Tenant lean methodology
- Overall (STATE)
- 21 Tenant-Leaning
- State New Jersey
- 21 Tenant-Leaning · D+6
- County
- — inherits STATE
- City
- — inherits STATE
ZIP-level market 08079
- Home prices YoY
- -0.1%
- Active inventory
- 100
- Price-to-rent
- 5.3×
Monthly cashflow live
- Estimated rent
- $2,297 medium interval (Pro) →
- Mortgage (P&I)
- −$760
- Tax from tax record
- −$335 /mo · $4,021/yr
- Insurance
- −$60
- HOA
- −$0
- Vacancy / Maint / Mgmt
- −$482
- Net cashflow
- $659
Break-even live
UW: 25.0% down · 7.5% · 30yr · 1.5% tax · 5.0% vac · 8.0% maint · 8.0% mgmt
Financing live
Cash to close
- Down payment
- $36,250
- Closing costs
- $4,350
- Reserves months
- —
- Total cash needed
- —
Loan-product check · same deal, 3 products live
Conventional
25% down · 7.5% · 30yr
- Down + closing
- —
- Monthly P&I
- —
- Monthly cashflow
- —
- DSCR
- —
- Eligible?
- —
Personal DTI + credit; lowest rate.
DSCR
20% down · 8.5% · 30yr
- Down + closing
- —
- Monthly P&I
- —
- Monthly cashflow
- —
- DSCR
- —
- Eligible?
- —
No personal income docs; deal must DSCR.
Hard money
10% down · 12.0% · 12mo
- Down + closing
- —
- Monthly P&I
- —
- Monthly cashflow
- —
- DSCR
- —
- Eligible?
- —
Short-term bridge; refi at stabilization.
Rent comps 1 comps
| Address | Beds | Baths | Sqft | Rent | $/sqft | DOM | Units | Dist |
|---|---|---|---|---|---|---|---|---|
| 270-272 Grant St Salem, NJ | 4.0 | 1.0 | 1644 | $2,100 | $1.28 | 5d | 1 | 0.54mi |
Listing history 21 events
-
2026-06-18days on market $145,000 Active 38 DOM
-
2026-06-17days on market $145,000 Active 37 DOM
-
2026-06-16days on market $145,000 Active 36 DOM
-
2026-06-15days on market $145,000 Active 35 DOM
-
2026-06-13days on market $145,000 Active 33 DOM
-
2026-06-13days on market $145,000 Active 32 DOM
-
2026-06-09days on market $145,000 Active 29 DOM
-
2026-06-08days on market $145,000 Active 28 DOM
-
2026-06-07days on market $145,000 Active 27 DOM
-
2026-06-04days on market $145,000 Active 24 DOM
-
2026-06-03days on market $145,000 Active 23 DOM
-
2026-06-02days on market $145,000 Active 22 DOM
-
2026-06-01days on market $145,000 Active 21 DOM
-
2026-05-31days on market $145,000 Active 20 DOM
-
2026-05-19price $145,000
-
2026-05-11$150,000 Active
-
2016-03-24soldstatus $36,000
-
2010-01-14soldstatus $60,000
-
2002-02-28soldstatus $21,000 205-char remark
Show marketing remark (205 chars)
2 - 2Br Ranchers W/ Separate Entrances And Adjoining Door, Zoned As Single Family Home. 2 Full Baths, 2Nd Kitchen Listed As Laundry Room, Property Being Sold As-Is. Handyman Special. DRASTICALLY REDUCED!!!
-
2002-02-18historical 205-char remark
Show marketing remark (205 chars)
2 - 2Br Ranchers W/ Separate Entrances And Adjoining Door, Zoned As Single Family Home. 2 Full Baths, 2Nd Kitchen Listed As Laundry Room, Property Being Sold As-Is. Handyman Special. DRASTICALLY REDUCED!!!
-
2001-05-29$21,000 205-char remark
Show marketing remark (205 chars)
2 - 2Br Ranchers W/ Separate Entrances And Adjoining Door, Zoned As Single Family Home. 2 Full Baths, 2Nd Kitchen Listed As Laundry Room, Property Being Sold As-Is. Handyman Special. DRASTICALLY REDUCED!!!
ⓘ Source: listings_history table (triggers on properties + properties_extension) + one-shot
backfill from property_details.listing_events for pre-trigger history.
Tax reassessment forecast NJ · Partial reset (capped growth)
- Current annual tax
- $4,021 · $335/mo
- Projected year-2 tax
- $4,021 · $335/mo
- Expected delta
- $0/yr ($0/mo · 0.0%)
ⓘ Screening estimate from a state-policy table — verify with the county assessor before closing.
Climate risk First Street
- Flood 6/10 Major FEMA zone X (unshaded) · 51% chance over 30 yrs
- Wildfire 3/10 Moderate
- Heat 8/10 Severe 7 d/yr ≥102°F today · 15 d/yr by 30 yrs out
- Wind 6/10 Major 27% chance of damaging wind over 30 yrs
- Air quality 3/10 Moderate 2 unhealthy d/yr today · 4 by 30 yrs out
Nearby sold comps map
Loading sold comps map…
Walkable amenities ~0.75 mi
Loading nearby amenities…
Taxation est. · year 1
- Rental income
- $27,566
- − Mortgage interest
- −$8,122
- − Property taxes
- −$4,021
- − Insurance
- −$725
- − Repairs & maintenance
- −$2,205
- − Management
- −$2,205
- − Depreciation
- −$4,218
- Taxable income
- $6,070
- Est. tax owed @ 24.0%
- −$1,457
- After-tax cash flow
- $6,450/yr
For passive investors: Depreciation is non-cash, so a rental often shows a tax loss while cash-flowing — sheltering income. Rental losses are passive: they offset passive income freely, and up to $25,000/yr can offset ordinary (W-2) income if you actively participate and your MAGI is under $100k (phasing out to $0 by $150k); unused losses carry forward. On sale, claimed depreciation is recaptured at up to 25%, and gains may owe capital-gains tax (a 1031 exchange can defer both). Figures are a year-1 estimate at your 24.0% rate — not tax advice; consult a CPA.
Schools (NCES district)
- District
- Salem City School District
- NCES district ID
- 3414550
- Math proficiency
- 6% ▼ -1.00%
- Reading proficiency
- 24% ▲ 2.00%
- Median HH income
- $27,118
- Composite
- 11.51/100
- National rank
- #9702
- State rank
- #464 of 472 in NJ
Livability — Salem
- Score
- 61/100
- State rank
- #462
- US rank
- #17533
Category grades
Schools grade is shown separately in the Schools card above.
Census & demographics
- Census place
- Salem, NJ
- County
- Salem County · 24,175 people
- City population
- 10,762
- Metro
- Philadelphia-Camden-Wilmington, PA-NJ-DE-MD
- Population (ZIP)
- 10,762
- Household income
- $54,641
- Rent vs Own
- Severe rent burden
- 663.0
Population outlook (Salem County) Hauer SSP2
- Today (2025)
- 59,905 people
- By 2030
- 57,351 · -4.3%
- By 2040
- 51,837 · -13.5%
- By 2050
- 46,356 · -22.6%
- By 2075
- 36,452 · -39.2%
- By 2100
- 28,907 · -51.7%
Race, ethnicity, and origin ACS 2023
- Neighborhood character
- Diverse neighborhood (Simpson 0.55)
- Race & ethnicity
- White 59% Black 31% Hispanic / Latino 6% Two or more races 5% Asian 1%
- Hispanic origin (detail)
- Puerto Rican 5%
- Common ancestry
- Romanian 3% Lithuanian 2% Italian 1%
- Foreign-born
- 2% · Canada
- Languages at home
- 94% English-only · Spanish 4% Tagalog/Filipino 1%
Political lean MEDSL · Salem
- 2024 margin
- R (+19.2) · D 39.6% · R 58.8% · Other 1.6%
- 2008→2024 swing
- -23.1pp toward R · 2008: 3.9pp · 2024: -19.2pp
- All cycles
- 2024: R+19.2 2020: R+12.8 2016: R+15.4 2012: D+0.8 2008: D+3.9
Not yet ingested
- Civics
- —
Market trends
- HPI YoY
- ▼ -0.38%
- Current HPI
- 258.0047
- Rent YoY
- —
- Metro
- Philadelphia-Camden-Wilmington, PA-NJ-DE-MD
- State GDP YoY
- ▲ 2.05%
- F500 in state
- 34
Industry mix (Fortune 500 HQ in NJ)
| Industry | F500 HQs | Revenue |
|---|---|---|
| Consumer Goods | 3 | $31B |
|
||
| Pharmaceuticals | 2 | $153B |
|
||
| Technology | 2 | $21B |
|
||
| Insurance | 2 | $20B |
|
||
| Healthcare | 2 | $19B |
|
||
| Financial Services | 1 | $70B |
|
||
Price history
+590.5% since first listed7 events — show timeline
- 2026-05-19 Price Changed $145,000 BRIGHT MLS
- 2026-05-11 Listed $150,000 BRIGHT MLS
- 2016-03-24 Sold (Public Records) $36,000 Public Records
- 2010-01-14 Sold (Public Records) $60,000 Public Records
- 2002-02-28 Sold (MLS) $21,000 BRIGHT MLS
- 2002-02-18 Listing Removed — BRIGHT MLS
- 2001-05-29 Listed $21,000 BRIGHT MLS
Property tax history
+7.8%/yrLatest (2025): $4,021 · +4.9% YoY. Source: county tax records.
Cash-flow waterfall
monthlySold comps — $/sqft
last 12 mo · ≤1 miLoading sold comps…