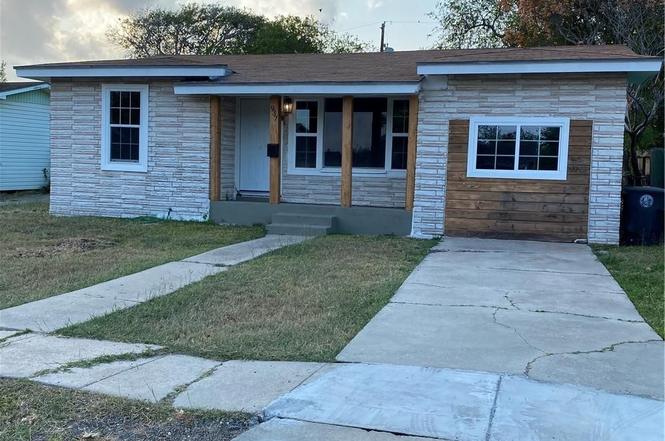
937 Nandina Dr · Corpus Christi, TX
Flood risk 3/10 · Minor
- FEMA flood zone
- X (unshaded)
- Chance of flooding over 30 yrs
- 0.2%
- Est. flood insurance / yr
- $507 – $1,088
Fire risk 1/10 · Minimal
- Est. fire insurance / yr
- $1,222 – $2,270
Heat risk 10/10 · Severe
- Hot days now (above 107°F)
- 7 days/yr
- Hot days in 30 yrs
- 26 days/yr
Wind risk 9/10 · Severe
- Chance of severe wind over 30 yrs
- 99.0%
Air-quality risk 1/10 · Minimal
- Unhealthy air days now
- 0 days/yr
- Unhealthy air days in 30 yrs
- 0 days/yr
Risk factors via First Street. Map © Google.
Why this score? — see what drove the B grade
The composite is a weighted blend of 9 inputs, each scored 0–100. Each bar is that input's sub-score; the figure is the points it added to the 100-point composite (weight × sub-score).
- Cash flow +30.0/30.0
- DSCR +10.0/10.0
- Appreciation +9.2/10.0
- 1% rule +8.4/10.0
- ARV discount +4.4/15.0
- Livability +3.9/5.0
- Schools +2.8/10.0
- Rent growth +2.5/5.0
- Condition / age +2.5/5.0
$149,500
🖨 Deal sheet 📄 Offer letter ✓ Due diligence
Listing remarks
Beautifully Remodeled 4-Bedroom, 2-Bath Home in Corpus Christi – Move-In Ready & Turnkey! Step into this stunningly updated 4-bedroom, 2-bath residence that combines fresh, modern style with timeless comfort. Recently remodeled from top to bottom, it features brand-new flooring throughout, contemporary paint colors, stylish new fixtures, and updated electrical systems for peace of mind and effortless living. The open, inviting layout is perfect for families, first-time buyers, or savvy investors looking for a low-maintenance gem. Enjoy bright, airy spaces that flow seamlessly, updated bathrooms with modern touches, and a kitchen ready for everyday meals or casual gatherings. Ev
Key facts
- Remodeled
- Updated bathrooms
- Updated flooring
Tags
Neighborhood map
What this means for you Summary
Snapshot
- This is a 4-bed/2.0-bath single-family listed at $150k.
Deal economics
- At list price, monthly cash flow is $573 ($7k/yr) — positive.
- The deal already cash-flows at list — no discount required.
- Meets the 1% rule at list price ($2k rent vs $150k).
- Recommended offer: $141k (6.0% below list) — sets the bar for market timing.
- Cap rate 10.9% vs local median 3.6% in Corpus Christi — top-decile yield for the area; either an underpriced asset or a hidden risk that comps aren't pricing in. Stress-test before assuming the spread holds.
Location & tenants
- Location reads 78/100 on livability (#66 in TX, #2,404 nationally) — a middle-class / working-renter tenant base. Strengths: commute A+, cost of living A+, housing A+; Watch: crime F.
- Corpus Christi ISD (urban): math 31% / reading 35% proficiency, ranked #562 of 826 in TX (top 68%) — families likely to look elsewhere, expect single-tenant / working-renter base with shorter leases; 63% free/reduced lunch — lower-income household profile, screen leases tightly.
- Market conditions: 36 active listings in the ZIP; 3 comparable units currently listed for rent nearby; rentals lingering (median 44d on market — plan ~5-8 weeks vacancy on turnover, expect pricing pressure); 67% of comp listings sitting > 30 days — soft ceiling on asking rent; 1,397 units permitted in Nueces County in 2024 (47 in 5+ unit buildings).
Forward outlook
- In year one you build about $14k of equity ($1k loan paydown + $13k appreciation (8.5% local appreciation)).
- Nueces County population projected at +36% by 2050 — long-run rental-demand tailwind backs the buy-and-hold thesis.
- At projected returns (8.5% appreciation + 3.0% rent growth), your $42k cash investment doubles in ~2 years — after that, you're playing with house money.
- By year 3, paydown + projected appreciation supports a ~$34k cash-out refi (75% LTV) — recoverable capital for the next deal without selling this one.
Negotiation context
- It's been on market 62 days — a 6% lower offer ($141k) is reasonable based on typical stale-listing flexibility.
- 4 sale attempts since 4y ago with the ask held roughly flat each time — persistent listings suggest the price (not the market) is what's stuck; bring a comps-based counter.
Risks & watch-outs
- Watch-outs: built in 1951 — expect roof / HVAC / electrical / plumbing capex.
- Climate carrying-cost: severe wind risk, 99% chance of damaging wind over 30y; extreme-heat days projected 7→26/yr by 2055 (HVAC capex compounding) — expect insurance premiums to compound above CPI over the hold.
Questions for the listing agent
- It's been on market 62 days. Have you received any prior offers? Is the seller open to a 6% concession, seller financing, or rate buy-down credit?
- Built in 1951 — when were the roof, HVAC, electrical panel, plumbing, and water heater last replaced?
- Why hasn't it sold? Are there any deal-killer items the seller is aware of (foundation, flood, title, zoning, code violations)?
- Is there a deadline driving the sale (1031 exchange, divorce, estate, relocation)? That informs how much negotiation room exists.
- Crime grade is F in this area — have there been break-ins, vandalism, or insurance claims at this property in the last 3 years? What carrier currently insures it and at what premium?
- What's the average days-on-market for RENTAL listings here right now (not sales)? A rising rental-DOM trend means longer vacancies and softer asking-rent achievability than the comps imply.
- What's the recent tenant-quality profile in this submarket — average credit score on applications, eviction rate, late-payment / NSF rate, and stable-employment percentage? A property-management company in the area should have these aggregated.
- How much new for-sale + rental construction is in the pipeline within 1–3 miles? Heavy new supply typically softens prices + rents 12–24 months out; constrained supply supports both.
Investment metrics
- 1% rule
- 1.34% ✓
- Cap rate
- 10.89%
- Cash-on-cash
- 16.41%
- DSCR
- 1.73
- GRM
- 6.2
CMA / ARV
- ARV (on-the-fly)
- $139,986
- Comps found
- 12
Show comp detail 12 sales within ~0.75 mi
| Address | Dist | Beds/Ba | Sqft | Sold | Price | $/sf | Match |
|---|---|---|---|---|---|---|---|
| 937 Nandina Dr | 0.00mi | 4/2.0 | 1,111 (0%) | 1mo | $149,500 | $135 | 100 |
| 921 Nandina Dr | 0.04mi | 3/1.0 (-1) | 1,057 (-5%) | 13mo | $72,000 | $68 | 70 |
| 1018 Gardenia Dr | 0.15mi | 3/2.0 (-1) | 1,188 (+7%) | 12mo | $149,900 | $126 | 66 |
| 423 Fairview Dr | 0.53mi | 3/1.5 (-1) | 1,110 (-0%) | 4mo | $120,000 | $108 | 65 |
| 1018 Ligustrum Dr | 0.10mi | 3/2.0 (-1) | 1,240 (+12%) | 12mo | $55,000 | $44 | 61 |
| 946 Erwin Ave | 0.09mi | 3/1.0 (-1) | 950 (-14%) | 4mo | $60,000 | $63 | 59 |
| 357 W Saxet Dr | 0.71mi | 3/1.0 (-1) | 1,128 (+2%) | 11mo | $188,900 | $167 | 46 |
| 3740 Brooks Dr | 0.47mi | 3/1.0 (-1) | 1,244 (+12%) | 7mo | $159,900 | $129 | 44 |
| 617 Villa Dr | 0.65mi | 3/2.0 (-1) | 1,040 (-6%) | 13mo | $159,995 | $154 | 43 |
| 251 W Longview St | 0.71mi | 3/1.0 (-1) | 1,013 (-9%) | 2mo | $59,000 | $58 | 41 |
| 345 Brooks Dr | 0.73mi | 3/1.0 (-1) | 1,069 (-4%) | 15mo | $29,800 | $28 | 39 |
| 310 W Longview St | 0.62mi | 3/1.0 (-1) | 1,248 (+12%) | 14mo | $175,000 | $140 | 30 |
Match score weights: distance 35% · size 25% · config 20% · recency 20%. Top-matched comps best support the ARV.
Projected returns pro-forma
8.49% appreciation · 3.0% rent growth · sell at horizon
- IRR
- 33.7%
- Equity multiple
- 3.46×
- Total profit
- $102,769
- Equity at exit
- $118,576
- IRR
- 29.8%
- Equity multiple
- 7.48×
- Total profit
- $271,442
- Equity at exit
- $240,306
Cash invested: $41,860 (down + closing). Projections, not guarantees.
Landlord ↔ Tenant lean methodology
- Overall (STATE)
- 87 Strongly Landlord-Friendly
- State Texas
- 87 Strongly Landlord-Friendly · R+5
- County
- — inherits STATE
- City
- — inherits STATE
ZIP-level market 78408
- Home prices YoY
- 6.8%
- Active inventory
- 36
- Price-to-rent
- 6.2×
Monthly cashflow live
- Estimated rent
- $2,005 medium interval (Pro) →
- Mortgage (P&I)
- −$784
- Tax from tax record
- −$165 /mo · $1,980/yr
- Insurance
- −$62
- HOA
- −$0
- Vacancy / Maint / Mgmt
- −$421
- Net cashflow
- $573
Break-even live
UW: 25.0% down · 7.5% · 30yr · 1.5% tax · 5.0% vac · 8.0% maint · 8.0% mgmt
Financing live
Cash to close
- Down payment
- $37,375
- Closing costs
- $4,485
- Reserves months
- —
- Total cash needed
- —
Loan-product check · same deal, 3 products live
Conventional
25% down · 7.5% · 30yr
- Down + closing
- —
- Monthly P&I
- —
- Monthly cashflow
- —
- DSCR
- —
- Eligible?
- —
Personal DTI + credit; lowest rate.
DSCR
20% down · 8.5% · 30yr
- Down + closing
- —
- Monthly P&I
- —
- Monthly cashflow
- —
- DSCR
- —
- Eligible?
- —
No personal income docs; deal must DSCR.
Hard money
10% down · 12.0% · 12mo
- Down + closing
- —
- Monthly P&I
- —
- Monthly cashflow
- —
- DSCR
- —
- Eligible?
- —
Short-term bridge; refi at stabilization.
Rent comps 3 comps
| Address | Beds | Baths | Sqft | Rent | $/sqft | DOM | Units | Dist |
|---|---|---|---|---|---|---|---|---|
| 2726 Grace Dr Unit A Corpus Christi, TX | 3.0 | 2.0 | 1300 | $2,095 | $1.61 | 43d | 1 | 0.30mi |
| 2706 Grace Dr Unit A Corpus Christi, TX | 3.0 | 2.0 | 1369 | $2,095 | $1.53 | 43d | 1 | 0.30mi |
| 2245 Comanche St Unit A Corpus Christi, TX | 3.0 | 1.0 | 1016 | $1,350 | $1.33 | 21d | 1 | 1.19mi |
Listing history 12 events
-
2026-04-30status Pending
-
2026-04-23historical
-
2026-03-07price $149,500
-
2026-02-19$154,500 Active
-
2025-11-17$159,000 Active
-
2023-01-10historical
-
2022-12-12soldstatus
-
2022-11-17historical
-
2022-05-17$129,000 Active
-
2022-04-22$129,000 New
-
2021-09-22soldstatus
-
2002-03-28soldstatus
ⓘ Source: listings_history table (triggers on properties + properties_extension) + one-shot
backfill from property_details.listing_events for pre-trigger history.
Tax reassessment forecast TX · Resets to sale price
- Current annual tax
- $1,980 · $165/mo
- Projected year-2 tax
- $2,736 · $228/mo
- Expected delta
- +$756/yr (+$63/mo · 38.2%)
ⓘ Screening estimate from a state-policy table — verify with the county assessor before closing.
Climate risk First Street
- Flood 3/10 Moderate FEMA zone X (unshaded) · 20% chance over 30 yrs
- Wildfire 1/10 Low
- Heat 10/10 Extreme 7 d/yr ≥107°F today · 26 d/yr by 30 yrs out
- Wind 9/10 Extreme 99% chance of damaging wind over 30 yrs
- Air quality 1/10 Low 0 unhealthy d/yr today · 0 by 30 yrs out
Nearby sold comps map
Loading sold comps map…
Walkable amenities ~0.75 mi
Loading nearby amenities…
Taxation est. · year 1
- Rental income
- $24,059
- − Mortgage interest
- −$8,374
- − Property taxes
- −$1,980
- − Insurance
- −$748
- − Repairs & maintenance
- −$1,925
- − Management
- −$1,925
- − Depreciation
- −$4,349
- Taxable income
- $4,759
- Est. tax owed @ 24.0%
- −$1,142
- After-tax cash flow
- $5,729/yr
For passive investors: Depreciation is non-cash, so a rental often shows a tax loss while cash-flowing — sheltering income. Rental losses are passive: they offset passive income freely, and up to $25,000/yr can offset ordinary (W-2) income if you actively participate and your MAGI is under $100k (phasing out to $0 by $150k); unused losses carry forward. On sale, claimed depreciation is recaptured at up to 25%, and gains may owe capital-gains tax (a 1031 exchange can defer both). Figures are a year-1 estimate at your 24.0% rate — not tax advice; consult a CPA.
Schools (NCES district)
- District
- Corpus Christi ISD
- NCES district ID
- 4815270
- Math proficiency
- 31% ▼ -18.00%
- Reading proficiency
- 35% ▼ -7.00%
- Median HH income
- $45,672
- Composite
- 28.27/100
- National rank
- #6793
- State rank
- #562 of 826 in TX
Livability — Corpus Christi
- Score
- 78/100
- State rank
- #66
- US rank
- #2404
Category grades
Schools grade is shown separately in the Schools card above.
Census & demographics
- Census place
- Corpus Christi, TX
- City population
- 296,836
- Population (ZIP)
- 9,631
Population outlook (Nueces County) Hauer SSP2
- Today (2025)
- 418,037 people
- By 2030
- 447,123 · +7.0%
- By 2040
- 505,911 · +21.0%
- By 2050
- 567,522 · +35.8%
- By 2075
- 729,686 · +74.6%
- By 2100
- 847,087 · +102.6%
Race, ethnicity, and origin ACS 2023
- Neighborhood character
- Predominantly Hispanic (84%)
- Race & ethnicity
- Hispanic / Latino 84% Two or more races 39% White 8% Black 7%
- Hispanic origin (detail)
- Mexican 78%
- Foreign-born
- 10% · Canada, Vietnam
- Languages at home
- 46% English-only · Spanish 53% Vietnamese 1%
Political lean MEDSL · Nueces
- 2024 margin
- R (+11.5) · D 43.8% · R 55.3%
- 2008→2024 swing
- -7.1pp toward R · 2008: -4.4pp · 2024: -11.5pp
- All cycles
- 2024: R+11.5 2020: R+2.9 2016: R+1.5 2012: R+3.2 2008: R+4.4
Not yet ingested
- Civics
- —
Market trends
- HPI YoY
- ▲ 8.49%
- Current HPI
- 132.544
- Rent YoY
- —
- Metro
- —
- State GDP YoY
- ▲ 3.95%
- F500 in state
- 110
Industry mix (Fortune 500 HQ in TX)
| Industry | F500 HQs | Revenue |
|---|---|---|
| Energy | 16 | $1,198B |
|
||
| Technology | 5 | $198B |
|
||
| Engineering / Construction | 4 | $72B |
|
||
| Energy Services | 3 | $60B |
|
||
| Utilities | 3 | $41B |
|
||
| Healthcare | 2 | $330B |
|
||
Price history
+15.9% since first listed12 events — show timeline
- 2026-04-30 Pending — CBMLS
- 2026-04-23 Delisted — CBMLS
- 2026-03-07 Price Changed $149,500 CBMLS
- 2026-02-19 Listed $154,500 CBMLS
- 2025-11-17 Listed $159,000 CBMLS
- 2023-01-10 Listing Removed — LERA
- 2022-12-12 Sold (Public Records) — Public Records
- 2022-11-17 Delisted — CBMLS
- 2022-05-17 Listed $129,000 CBMLS
- 2022-04-22 Listed $129,000 LERA
- 2021-09-22 Sold (Public Records) — Public Records
- 2002-03-28 Sold (Public Records) — Public Records
Property tax history
+5.3%/yrLatest (2025): $1,980 · +22.1% YoY. Source: county tax records.
Cash-flow waterfall
monthlySold comps — $/sqft
last 12 mo · ≤1 miLoading sold comps…