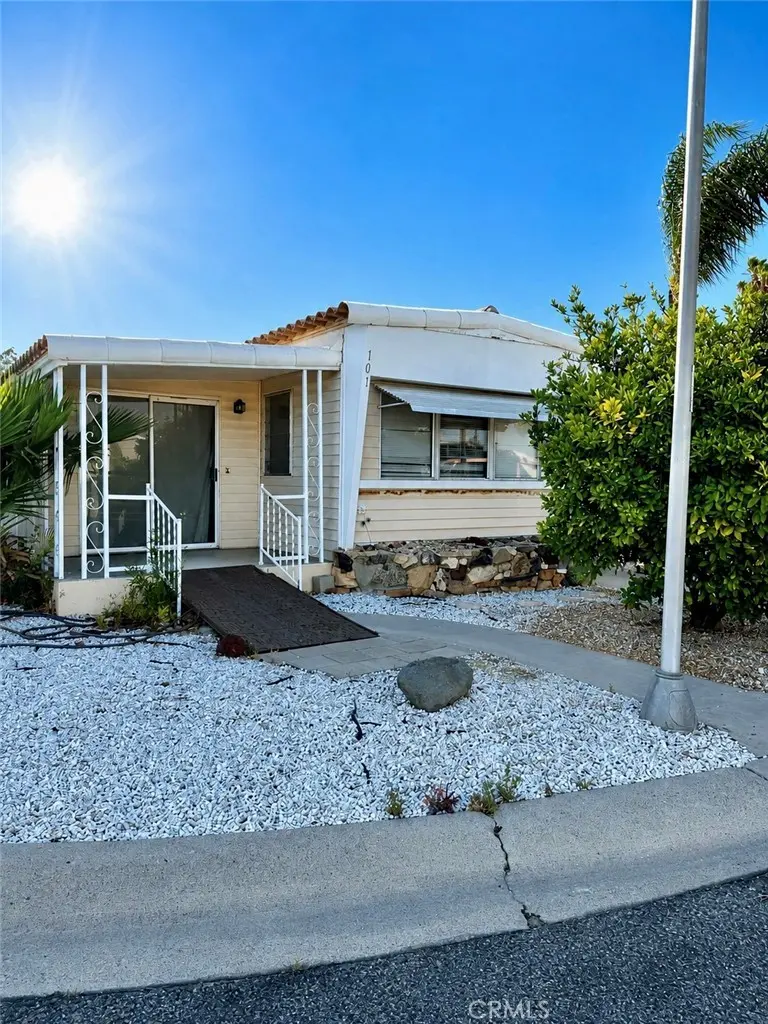
101 Santa Clara Cir · Hemet, CA
Flood risk 1/10 · Minimal
- FEMA flood zone
- X (shaded)
- Chance of flooding over 30 yrs
- 0.0%
- Est. flood insurance / yr
- $507 – $1,088
Fire risk 6/10 · Moderate
- Est. fire insurance / yr
- $659 – $1,223
Heat risk 7/10 · Major
- Hot days now (above 104°F)
- 6 days/yr
- Hot days in 30 yrs
- 17 days/yr
Wind risk 1/10 · Minimal
- Chance of severe wind over 30 yrs
- —
Air-quality risk 6/10 · Moderate
- Unhealthy air days now
- 9 days/yr
- Unhealthy air days in 30 yrs
- 11 days/yr
Risk factors via First Street. Map © Google.
Why this score? — see what drove the C- grade
The composite is a weighted blend of 9 inputs, each scored 0–100. Each bar is that input's sub-score; the figure is the points it added to the 100-point composite (weight × sub-score).
- Cash flow +24.9/30.0
- DSCR +8.1/10.0
- 1% rule +7.4/10.0
- Rent growth +2.9/5.0
- Livability +2.6/5.0
- Schools +2.5/10.0
- Condition / age +2.5/5.0
- ARV discount +0.0/15.0
- Appreciation +0.0/10.0
$130,000
🖨 Deal sheet (PDF) 📄 Offer letter ✓ Due diligence
Listing remarks
Charming Hemet home that offers comfortable living with a functional layout and inviting feel throughout. Featuring 2 bedrooms, 1 bathroom, and an added bonus space, the home is filled with natural light and sits on its own lot in a quiet, convenient location close to shopping, dining, and everyday amenities. A great opportunity for affordable living, a seasonal getaway, or investment property.
Key facts
- Natural light
- Quiet location
- Convenient location
Tags
Property features AI
Finance
- Other: Single-unit property; Parcel number: 442242001; Living area and lot info per assessor
- HOA & community: Part of the Sierra Dawn association; Monthly HOA fee of $185; Senior community; Community amenities include pool, spa, clubhouse, gym/exercise room, tennis, billiard room, banquet/meeting rooms, card room, picnic area, outdoor cooking/BBQ, storage area, common RV parking, recreational/multipurpose room, and cable TV; Sidewalks in the community
Exterior
- Utilities: Public water (district); Sewer service paid
- Home design: Manufactured house; Single-story
- Construction: Year built per assessor; No common walls
- Exterior features: Back yard; No pool
Interior
- Bedrooms: 2 bedrooms on the main level
- Bathrooms: 1 full bathroom
- Heating & cooling: Central furnace heating; Evaporative cooling
- Interior features: One-level home; All bedrooms on the main level; Main level entry
- Laundry & utility: Laundry inside the home
Neighborhood map
What this means for you Summary
Snapshot
- This is a 2-bed/1.0-bath manufactured listed at $130k.
Deal economics
- At list price, monthly cash flow is $278 ($3k/yr) — positive.
- The deal already cash-flows at list — no discount required.
- Meets the 1% rule at list price ($2k rent vs $130k).
- Recommended offer: $126k (3.0% below list) — sets the bar for market timing.
- Cap rate 8.9% vs local median 4.8% in Hemet — top-decile yield for the area; either an underpriced asset or a hidden risk that comps aren't pricing in. Stress-test before assuming the spread holds.
Location & tenants
- Location reads 51/100 on livability (#1,056 in CA) — a working-class tenant base; expect higher turnover. Strengths: housing A+; Watch: crime D+, schools F, amenities F.
- Hemet Unified (suburban): math 19% / reading 41% proficiency, ranked #360 of 517 in CA (top 70%) — families likely to look elsewhere, expect single-tenant / working-renter base with shorter leases; 66% free/reduced lunch — lower-income household profile, screen leases tightly.
- Market conditions: Rents rising (+1.8%/yr); 270 active listings in the ZIP; 14 comparable units currently listed for rent nearby; rentals leasing fast (median 6d on market — plan ~1-2 weeks tenant-placement turnaround); 9,195 units permitted in Riverside County in 2024 (1,512 in 5+ unit buildings).
- This rent runs 39% of the median local income ($49k/yr) — at the standard rent-burdened threshold; future hikes will face affordability resistance.
Forward outlook
- Local home prices are declining (-3.0%/yr); year-one equity from $899 of loan paydown is wiped out by about $4k of value loss. Plan a longer hold.
- Riverside County population projected at +22% by 2050 — long-run rental-demand tailwind backs the buy-and-hold thesis.
Negotiation context
- It's been on market 41 days — a 3% lower offer ($126k) is reasonable based on typical stale-listing flexibility.
- 8 sale attempts since 14y ago with the ask held roughly flat each time — persistent listings suggest the price (not the market) is what's stuck; bring a comps-based counter.
- Current owner paid $58k; list at $130k implies a 122% gain — meaningful room to come down on a strong offer.
Risks & watch-outs
- Climate carrying-cost: major wildfire risk; extreme-heat days projected 6→17/yr by 2055 (HVAC capex compounding) — expect insurance premiums to compound above CPI over the hold.
Questions for the listing agent
- It's been on market 41 days. Have you received any prior offers? Is the seller open to a 3% concession, seller financing, or rate buy-down credit?
- Built in 1960 — when were the roof, HVAC, electrical panel, plumbing, and water heater last replaced?
- What does the HOA fee cover, when was the last increase, and are there any pending special assessments or reserve-fund shortfalls?
- Is there a deadline driving the sale (1031 exchange, divorce, estate, relocation)? That informs how much negotiation room exists.
- Schools are F-rated, which usually means shorter tenancies and higher turnover. Who's the typical renter profile here, and what's been the actual vacancy rate?
- Crime grade is D in this area — have there been break-ins, vandalism, or insurance claims at this property in the last 3 years? What carrier currently insures it and at what premium?
- What's the average days-on-market for RENTAL listings here right now (not sales)? A rising rental-DOM trend means longer vacancies and softer asking-rent achievability than the comps imply.
- What's the recent tenant-quality profile in this submarket — average credit score on applications, eviction rate, late-payment / NSF rate, and stable-employment percentage? A property-management company in the area should have these aggregated.
- How much new for-sale + rental construction is in the pipeline within 1–3 miles? Heavy new supply typically softens prices + rents 12–24 months out; constrained supply supports both.
Investment metrics
- 1% rule
- 1.24% ✓
- Cap rate
- 8.86%
- Cash-on-cash
- 9.17%
- DSCR
- 1.41
- GRM
- 6.7
CMA / ARV
- ARV (median comp)
- $90,593
- List price
- $130,000
- Delta
- 43.50%
- Verdict
- OVERPRICED
- Comps
- 19 within 1.0 mi
Show comp detail 7 sales within ~0.75 mi
| Address | Dist | Beds/Ba | Sqft | Sold | Price | $/sf | Match |
|---|---|---|---|---|---|---|---|
| 821 San Ramon | 0.16mi | 2/1.0 | 624 (0%) | 6mo | $92,000 | $147 | 87 |
| 110 Santa Clara Cir | 0.02mi | 2/1.0 | 638 (+2%) | 19mo | $110,000 | $172 | 79 |
| 590 Santa Clara Cir | 0.20mi | 2/1.0 | 640 (+3%) | 10mo | $120,000 | $188 | 78 |
| 270 Santa Clara Cir | 0.10mi | 2/1.0 | 672 (+8%) | 9mo | $103,000 | $153 | 76 |
| 281 Santa Clara Cir | 0.09mi | 2/1.0 | 684 (+10%) | 13mo | $139,000 | $203 | 69 |
| 860 San Mateo Cir | 0.23mi | 2/1.0 | 630 (+1%) | 23mo | $111,000 | $176 | 68 |
| 151 Santa Lucia Dr | 0.29mi | 1/1.0 (-1) | 588 (-6%) | 14mo | $74,900 | $127 | 60 |
Match score weights: distance 35% · size 25% · config 20% · recency 20%. Top-matched comps best support the ARV.
Projected returns pro-forma
-3.0% appreciation · 1.76% rent growth · sell at horizon
- IRR
- -3.9%
- Equity multiple
- 0.86×
- Total profit
- $-5,241
- Equity at exit
- $19,383
- IRR
- 4.3%
- Equity multiple
- 1.29×
- Total profit
- $10,657
- Equity at exit
- $11,240
Cash invested: $36,400 (down + closing). Projections, not guarantees.
Landlord ↔ Tenant lean methodology
- Overall (STATE)
- 18 Strongly Tenant-Friendly
- State California
- 18 Strongly Tenant-Friendly · D+13
- County
- — inherits STATE
- City
- — inherits STATE
ZIP-level market 92543
- Home prices YoY
- -26.7%
- Rents YoY
- 1.8%
- Active inventory
- 270
- Price-to-rent
- 6.7×
Monthly cashflow live
- Estimated rent
- $1,609 high interval (Pro) →
- Mortgage (P&I)
- −$682
- Tax from tax record
- −$72 /mo · $865/yr
- Insurance
- −$54
- HOA
- −$185
- Vacancy / Maint / Mgmt
- −$338
- Net cashflow
- $278
Break-even live
Sensitivity live
| Price | -10% $352 | -5% $315 | +0% $278 | +5% $242 | +10% $205 |
|---|---|---|---|---|---|
| Rent | -10% $151 | -5% $215 | +0% $278 | +5% $342 | +10% $405 |
| Rate | -1.0pp $344 | -0.5pp $311 | base $278 | +0.5pp $245 | +1.0pp $210 |
UW: 25.0% down · 7.5% · 30yr · 1.5% tax · 5.0% vac · 8.0% maint · 8.0% mgmt
Financing live
Cash to close
- Down payment
- $32,500
- Closing costs
- $3,900
- Reserves months
- —
- Total cash needed
- —
Loan-product check · same deal, 3 products live
Conventional
25% down · 7.5% · 30yr
- Down + closing
- —
- Monthly P&I
- —
- Monthly cashflow
- —
- DSCR
- —
- Eligible?
- —
Personal DTI + credit; lowest rate.
DSCR
20% down · 8.5% · 30yr
- Down + closing
- —
- Monthly P&I
- —
- Monthly cashflow
- —
- DSCR
- —
- Eligible?
- —
No personal income docs; deal must DSCR.
Hard money
10% down · 12.0% · 12mo
- Down + closing
- —
- Monthly P&I
- —
- Monthly cashflow
- —
- DSCR
- —
- Eligible?
- —
Short-term bridge; refi at stabilization.
Rent comps 14 comps
| Address | Beds | Baths | Sqft | Rent | $/sqft | DOM | Units | Dist |
|---|---|---|---|---|---|---|---|---|
| 893 S Palm Ave Hemet, CA | 2.0 | 2.0 | 720 | $1,375 | $1.91 | 6d | 1 | 0.12mi |
| 1074 W Johnston Ave Hemet, CA | 2.0 | 1.0 | 460 | $1,500 | $3.26 | 0d | 1 | 0.15mi |
| 1025 S Gilbert St Hemet, CA | 1.0–2.0 | 1.0–2.0 | 890 | $2,320 | $2.61 | 3d | 8 | 0.38mi |
| 1150 S Palm Ave Hemet, CA | 1.0 | 1.0 | 670 | $1,534 | $2.29 | 25d | 1 | 0.46mi |
| 1000 S Gilbert St Hemet, CA | 1.0–2.0 | 1.0 | 500 | $1,470 | $2.94 | 0d | 3 | 0.46mi |
| 1377 Provence Ct Hemet, CA | 1.0 | 1.0 | 650 | $1,900 | $2.92 | 25d | 1 | 0.76mi |
| 113 E Kimball Ave Unit 2 Hemet, CA | 2.0 | 1.0 | 500 | $1,295 | $2.59 | 45d | 1 | 0.92mi |
| 2098 W Acacia Ave Hemet, CA | 1.0–3.0 | 1.0–2.0 | 895 | $2,035 | $2.27 | 0d | 1 | 0.95mi |
| 201 N Valley View Dr Hemet, CA | 1.0 | 1.0 | 552 | $1,500 | $2.72 | 45d | 1 | 1.01mi |
| 199 N Inez St Apt D Hemet, CA | 1.0 | 1.0 | 650 | $1,300 | $2.00 | 9d | 1 | 1.08mi |
| 199 N Inez St Apt D Hemet, CA | 1.0 | 1.0 | 650 | $1,300 | $2.00 | 0d | 1 | 1.08mi |
| 233 N Alessandro St Hemet, CA | 1.0 | 1.0 | 690 | $1,400 | $2.03 | 45d | 1 | 1.13mi |
| 3030 W Acacia Ave Hemet, CA | 1.0–2.0 | 1.0–2.0 | 807 | $1,780 | $2.20 | 0d | 8 | 1.43mi |
| 210 N Santa Fe St Hemet, CA | 1.0 | 1.0 | 600 | $1,300 | $2.17 | 5d | 1 | 1.47mi |
HOA detail
- Monthly dues
- $185 · $2,220/yr
Listing history 32 events
-
2026-06-21days on market $130,000 Active 41 DOM
-
2026-06-18days on market $130,000 Active 38 DOM
-
2026-06-17days on market $130,000 Active 37 DOM
-
2026-06-16days on market $130,000 Active 36 DOM
-
2026-06-15days on market $130,000 Active 35 DOM
-
2026-06-13days on market $130,000 Active 33 DOM
-
2026-06-09days on market $130,000 Active 29 DOM
-
2026-06-08days on market $130,000 Active 28 DOM
-
2026-06-07days on market $130,000 Active 27 DOM
-
2026-06-04days on market $130,000 Active 24 DOM
-
2026-06-03days on market $130,000 Active 23 DOM
-
2026-06-02days on market $130,000 Active 22 DOM
-
2026-06-01days on market $130,000 Active 21 DOM
-
2026-05-31days on market $130,000 Active 20 DOM
-
2026-05-11$130,000 Active 397-char remark
-
2024-12-31historical
-
2024-06-10$125,000 Active
-
2019-02-01historical
-
2018-08-02$75,000 Active
-
2017-02-28historical
-
2016-03-20status Active
-
2016-03-18historical
-
2015-12-29$69,900 Active
-
2014-02-27historical
-
2013-12-05$69,900 Active
-
2013-12-01historical
-
2013-05-30$69,900 Active
-
2013-05-21historical
-
2013-04-30price $69,900
-
2013-02-14price $69,000
-
2012-07-23$49,000 Active
-
2004-11-18soldstatus $58,500
ⓘ Source: listings_history table (triggers on properties + properties_extension) + one-shot
backfill from property_details.listing_events for pre-trigger history.
Tax reassessment forecast CA · Resets to sale price
- Current annual tax
- $865 · $72/mo
- Projected year-2 tax
- $988 · $82/mo
- Expected delta
- +$123/yr (+$10/mo · 14.2%)
ⓘ Screening estimate from a state-policy table — verify with the county assessor before closing.
Climate risk First Street
- Flood 1/10 Low FEMA zone X (shaded) · 0% chance over 30 yrs
- Wildfire 6/10 Major
- Heat 7/10 Severe 6 d/yr ≥104°F today · 17 d/yr by 30 yrs out
- Wind 1/10 Low
- Air quality 6/10 Major 9 unhealthy d/yr today · 11 by 30 yrs out
Nearby sold comps map
Loading sold comps map…
Walkable amenities ~0.75 mi
Loading nearby amenities…
Taxation est. · year 1
- Rental income
- $19,311
- − Mortgage interest
- −$7,282
- − Property taxes
- −$865
- − Insurance
- −$650
- − Repairs & maintenance
- −$1,545
- − Management
- −$1,545
- − HOA
- −$2,220
- − Depreciation
- −$3,782
- Taxable income
- $1,422
- Est. tax owed @ 24.0%
- −$341
- After-tax cash flow
- $2,998/yr
For passive investors: Depreciation is non-cash, so a rental often shows a tax loss while cash-flowing — sheltering income. Rental losses are passive: they offset passive income freely, and up to $25,000/yr can offset ordinary (W-2) income if you actively participate and your MAGI is under $100k (phasing out to $0 by $150k); unused losses carry forward. On sale, claimed depreciation is recaptured at up to 25%, and gains may owe capital-gains tax (a 1031 exchange can defer both). Figures are a year-1 estimate at your 24.0% rate — not tax advice; consult a CPA.
Schools (NCES district)
- District
- Hemet Unified
- NCES district ID
- 0616920
- Math proficiency
- 19% ▼ -3.00%
- Reading proficiency
- 41% ▲ 4.00%
- Median HH income
- $39,962
- Composite
- 25.16/100
- National rank
- #7517
- State rank
- #360 of 517 in CA
Livability — Hemet
- Score
- 51/100
- State rank
- #1056
- US rank
- #25208
Category grades
Schools grade is shown separately in the Schools card above.
Census & demographics
- Census place
- Hemet, CA
- County
- Riverside County · 2,287,001 people
- City population
- 137,670
- Metro
- Riverside-San Bernardino-Ontario, CA
- Population (ZIP)
- 39,937
- Household income
- $49,396
- Rent vs Own
- Severe rent burden
- 2144.0
Population outlook (Riverside County) Hauer SSP2
- Today (2025)
- 2,664,475 people
- By 2030
- 2,802,692 · +5.2%
- By 2040
- 3,050,904 · +14.5%
- By 2050
- 3,256,783 · +22.2%
- By 2075
- 3,655,058 · +37.2%
- By 2100
- 3,766,594 · +41.4%
Race, ethnicity, and origin ACS 2023
- Neighborhood character
- Diverse neighborhood (Simpson 0.61)
- Race & ethnicity
- Hispanic / Latino 54% White 30% Two or more races 18% Black 10% Native American 2% Asian 2%
- Hispanic origin (detail)
- Mexican 48% Puerto Rican 1%
- Common ancestry
- Slovak 1% Romanian 1% Portuguese 1%
- Foreign-born
- 21% · Canada
- Languages at home
- 59% English-only · Spanish 38% Arabic 1% Tagalog/Filipino 1%
Political lean MEDSL · Riverside
- 2024 margin
- Toss-up / Even · D 48.0% · R 49.3% · Other 2.6%
- 2008→2024 swing
- -3.6pp toward R · 2008: 2.3pp · 2024: -1.3pp
- All cycles
- 2024: R+1.3 2020: D+8.0 2016: D+4.3 2012: R+0.4 2008: D+2.3
Not yet ingested
- Civics
- —
Market trends
- HPI YoY
- ▼ -147.46%
- Current HPI
- 405.1277
- Rent YoY
- ▲ 1.76%
- Metro
- Riverside-San Bernardino-Ontario, CA
- State GDP YoY
- ▲ 3.21%
- F500 in state
- 116
Industry mix (Fortune 500 HQ in CA)
| Industry | F500 HQs | Revenue |
|---|---|---|
| Technology | 27 | $1,492B |
|
||
| Financial Services | 3 | $174B |
|
||
| Retail | 3 | $44B |
|
||
| Insurance | 3 | $26B |
|
||
| Media / Entertainment | 2 | $115B |
|
||
| Pharmaceuticals / Biotech | 2 | $62B |
|
||
Price history
+122.2% since first listed18 events — show timeline
- 2026-05-11 Listed $130,000 CRMLS
- 2024-12-31 Listing Removed — CRMLS
- 2024-06-10 Listed $125,000 CRMLS
- 2019-02-01 Listing Removed — CRMLS
- 2018-08-02 Listed $75,000 CRMLS
- 2017-02-28 Listing Removed — CRMLS
- 2016-03-20 Relisted — CRMLS
- 2016-03-18 Listing Removed — CRMLS
- 2015-12-29 Listed $69,900 CRMLS
- 2014-02-27 Listing Removed — CRMLS
- 2013-12-05 Listed $69,900 CRMLS
- 2013-12-01 Listing Removed — CRMLS
- 2013-05-30 Listed $69,900 CRMLS
- 2013-05-21 Listing Removed — CRMLS
- 2013-04-30 Price Changed $69,900 CRMLS
- 2013-02-14 Price Changed $69,000 CRMLS
- 2012-07-23 Listed $49,000 CRMLS
- 2004-11-18 Sold (Public Records) $58,500 Public Records
Property tax history
+1.7%/yrLatest (2025): $865 · +18.1% YoY. Source: county tax records.
Cash-flow waterfall
monthlySold comps — $/sqft
last 12 mo · ≤1 miLoading sold comps…