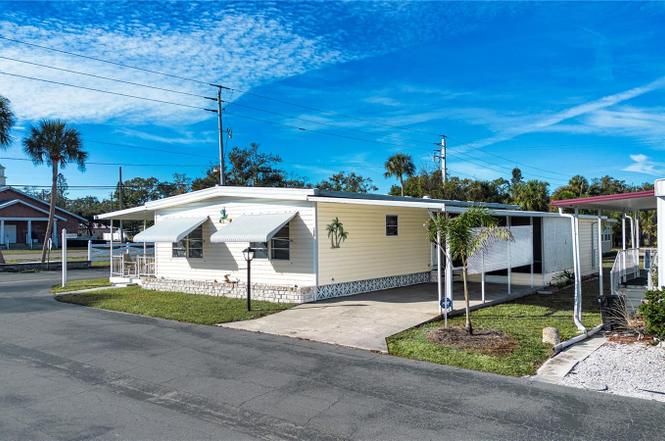
420 49th St E #145 · Memphis, FL
Flood risk 1/10 · Minimal
- FEMA flood zone
- X (unshaded)
- Chance of flooding over 30 yrs
- 0.0%
- Est. flood insurance / yr
- $507 – $1,088
Fire risk 1/10 · Minimal
- Est. fire insurance / yr
- $947 – $1,759
Heat risk 10/10 · Severe
- Hot days now (above 107°F)
- 7 days/yr
- Hot days in 30 yrs
- 32 days/yr
Wind risk 10/10 · Severe
- Chance of severe wind over 30 yrs
- 99.0%
Air-quality risk 3/10 · Minor
- Unhealthy air days now
- 2 days/yr
- Unhealthy air days in 30 yrs
- 3 days/yr
Risk factors via First Street. Map © Google.
Why this score? — see what drove the C grade
The composite is a weighted blend of 9 inputs, each scored 0–100. Each bar is that input's sub-score; the figure is the points it added to the 100-point composite (weight × sub-score).
- Cash flow +28.5/30.0
- DSCR +10.0/10.0
- 1% rule +8.6/10.0
- Schools +4.4/10.0
- Livability +3.2/5.0
- Condition / age +2.5/5.0
- Rent growth +1.8/5.0
- ARV discount +0.0/15.0
- Appreciation +0.0/10.0
$149,900
🖨 Deal sheet 📄 Offer letter ✓ Due diligence
Listing remarks
No Lot Rent! Turn-key and move-in ready, this beautifully maintained 3-bedroom, 2-bath home is located on a corner lot in Skyway Village Estates Co-Op, this property is an age-qualified 55 plus community. 2025 AC, 2023 roof, interior walls are drywalled, updated flooring. This home allows you to settle in immediately with ease and comfort. Ideally situated directly across the street from the pool and clubhouse, residents enjoy convenience to community amenities while benefiting from a low HOA. The thoughtfully designed floor plan offers comfortable living spaces and flexibility for guests, hobbies, or a home office, plus a large attached storage. Enjoy close proximity to the interstate, air
Key facts
- Pool and clubhouse
- Community amenities
- Corner lot
Tags
Property features AI
Finance
- Other: Property type: Residential mobile home; Total acreage: less than 1/4 acre (approx. 0.09 acres); Living area reported from public records; Building area includes additional structures
- Financial info: Lease restrictions apply
- HOA & community: HOA (Anna) with required approval; Monthly HOA fee $229; HOA covers pool, common area taxes, escrow reserves, grounds maintenance, management, private road, sewer, trash, water; Association amenities: Clubhouse, Pool, Shuffleboard Court, Maintenance; Senior community; Pets allowed (cats and dogs with limits); Total monthly HOA fees $229 / total annual fees $2,748
Exterior
- Parking: Carport with 2 spaces; Private maintained paved road
- Utilities: Public water; Private sewer; Cable available; Electricity connected; Phone available; Sewer connected; Water connected
- Home design: Residential mobile home; Double wide; One story; Faces east; Completed condition
- Construction: Vinyl siding; Membrane roof; Metal roof; Roof over; Pillar/post/pier foundation; Built as double wide
- Exterior features: Covered front porch; Enclosed porch; Screened porch; Side porch; Awning(s); Sliding doors; Landscaped lot; Shed(s) / storage
Interior
- Kitchen: Dishwasher; Microwave; Range; Range hood; Refrigerator; Exhaust fan; Electric water heater
- Bedrooms: 3 bedrooms
- Flooring: Carpet; Laminate; Vinyl
- Bathrooms: 2 full bathrooms
- Heating & cooling: Central heating; Electric heating; Heat pump; Central air conditioning
- Interior features: Ceiling fans; Crown molding; Eat-in kitchen; Thermostat; Walk-in closet(s); Window treatments; Blinds
- Laundry & utility: Washer hookup; Dryer hookup (electric); Inside laundry; Laundry closet
Neighborhood map
What this means for you Summary
Snapshot
- This is a 2-bed/2.0-bath manufactured listed at $150k.
Deal economics
- At list price, monthly cash flow is $487 ($6k/yr) — positive.
- The deal already cash-flows at list — no discount required.
- Meets the 1% rule at list price ($2k rent vs $150k).
- Recommended offer: $132k (12.0% below list) — sets the bar for market timing.
- Cap rate 10.2% vs local median 4.5% in Memphis — top-decile yield for the area; either an underpriced asset or a hidden risk that comps aren't pricing in. Stress-test before assuming the spread holds.
Location & tenants
- Location reads 63/100 on livability (#745 in FL) — a middle-class / working-renter tenant base. Strengths: cost of living A+, housing A+; Watch: employment D+, schools F, amenities F.
- Manatee (suburban): math 54% / reading 50% proficiency, ranked #26 of 73 in FL (top 36%) — acceptable for families but not a draw, mixed tenant base, ~2y average lease.
- Market conditions: Rents soft (-3.0%/yr); 1160 active listings in the ZIP; 6 comparable units currently listed for rent nearby; rentals at typical pace (median 24d on market — plan ~3-4 weeks tenant-placement turnaround); solid renter incomes; 7,472 units permitted in Manatee County in 2024 (1,782 in 5+ unit buildings).
- This rent runs 31% of the median local income ($78k/yr) — at the standard rent-burdened threshold; future hikes will face affordability resistance.
Forward outlook
- Local home prices are declining (-3.0%/yr); year-one equity from $1k of loan paydown is wiped out by about $4k of value loss. Plan a longer hold.
- Manatee County population projected at +43% by 2050 — long-run rental-demand tailwind backs the buy-and-hold thesis.
Negotiation context
- It's been on market 166 days — a 12% lower offer ($132k) is reasonable based on typical stale-listing flexibility.
Risks & watch-outs
- Climate carrying-cost: severe wind risk, 99% chance of damaging wind over 30y; extreme-heat days projected 7→32/yr by 2055 (HVAC capex compounding) — expect insurance premiums to compound above CPI over the hold.
Questions for the listing agent
- It's been on market 166 days. Have you received any prior offers? Is the seller open to a 12% concession, seller financing, or rate buy-down credit?
- Built in 1973 — when were the roof, HVAC, electrical panel, plumbing, and water heater last replaced?
- What does the HOA fee cover, when was the last increase, and are there any pending special assessments or reserve-fund shortfalls?
- Why hasn't it sold? Are there any deal-killer items the seller is aware of (foundation, flood, title, zoning, code violations)?
- Is there a deadline driving the sale (1031 exchange, divorce, estate, relocation)? That informs how much negotiation room exists.
- Schools are F-rated, which usually means shorter tenancies and higher turnover. Who's the typical renter profile here, and what's been the actual vacancy rate?
- What's the average days-on-market for RENTAL listings here right now (not sales)? A rising rental-DOM trend means longer vacancies and softer asking-rent achievability than the comps imply.
- What's the recent tenant-quality profile in this submarket — average credit score on applications, eviction rate, late-payment / NSF rate, and stable-employment percentage? A property-management company in the area should have these aggregated.
- How much new for-sale + rental construction is in the pipeline within 1–3 miles? Heavy new supply typically softens prices + rents 12–24 months out; constrained supply supports both.
Investment metrics
- 1% rule
- 1.36% ✓
- Cap rate
- 10.19%
- Cash-on-cash
- 13.93%
- DSCR
- 1.62
- GRM
- 6.1
CMA / ARV
- ARV (on-the-fly)
- $112,896
- Comps found
- 3
Show comp detail 3 sales within ~0.75 mi
| Address | Dist | Beds/Ba | Sqft | Sold | Price | $/sf | Match |
|---|---|---|---|---|---|---|---|
| 420 49th St E #48 | 0.14mi | 3/2.0 (+1) | 1,296 (+12%) | 2mo | $110,000 | $85 | 66 |
| 5619 Bayshore Rd #142 | 0.46mi | 2/2.0 | 1,056 (-8%) | 2mo | $125,000 | $118 | 63 |
| 5619 Bayshore Rd #164 | 0.57mi | 2/2.0 | 1,224 (+6%) | 2mo | $120,000 | $98 | 61 |
Match score weights: distance 35% · size 25% · config 20% · recency 20%. Top-matched comps best support the ARV.
Projected returns pro-forma
-3.0% appreciation · 0.0% rent growth · sell at horizon
- IRR
- 0.6%
- Equity multiple
- 1.02×
- Total profit
- $872
- Equity at exit
- $22,351
- IRR
- 6.7%
- Equity multiple
- 1.43×
- Total profit
- $18,026
- Equity at exit
- $12,961
Cash invested: $41,972 (down + closing). Projections, not guarantees.
Landlord ↔ Tenant lean methodology
- Overall (STATE)
- 87 Strongly Landlord-Friendly
- State Florida
- 87 Strongly Landlord-Friendly · R+3
- County
- — inherits STATE
- City
- — inherits STATE
ZIP-level market 34221
- Rents YoY
- -3.0%
- Active inventory
- 1160
- Price-to-rent
- 6.1×
Monthly cashflow live
- Estimated rent
- $2,034 high interval (Pro) →
- Mortgage (P&I)
- −$786
- Tax from tax record
- −$42 /mo · $503/yr
- Insurance
- −$62
- HOA
- −$229
- Vacancy / Maint / Mgmt
- −$427
- Net cashflow
- $487
Break-even live
UW: 25.0% down · 7.5% · 30yr · 1.5% tax · 5.0% vac · 8.0% maint · 8.0% mgmt
Financing live
Cash to close
- Down payment
- $37,475
- Closing costs
- $4,497
- Reserves months
- —
- Total cash needed
- —
Loan-product check · same deal, 3 products live
Conventional
25% down · 7.5% · 30yr
- Down + closing
- —
- Monthly P&I
- —
- Monthly cashflow
- —
- DSCR
- —
- Eligible?
- —
Personal DTI + credit; lowest rate.
DSCR
20% down · 8.5% · 30yr
- Down + closing
- —
- Monthly P&I
- —
- Monthly cashflow
- —
- DSCR
- —
- Eligible?
- —
No personal income docs; deal must DSCR.
Hard money
10% down · 12.0% · 12mo
- Down + closing
- —
- Monthly P&I
- —
- Monthly cashflow
- —
- DSCR
- —
- Eligible?
- —
Short-term bridge; refi at stabilization.
Rent comps 6 comps
| Address | Beds | Baths | Sqft | Rent | $/sqft | DOM | Units | Dist |
|---|---|---|---|---|---|---|---|---|
| 4721 1st Ave E #4721 Palmetto, FL | 3.0 | 2.0 | 1460 | $2,000 | $1.37 | 23d | 1 | 0.26mi |
| 515 45th St E Palmetto, FL | 2.0 | 2.0 | 900 | $2,100 | $2.33 | 23d | 1 | 0.32mi |
| 709 45th St E Palmetto, FL | 2.0 | 2.0 | 1000 | $1,550 | $1.55 | 2d | 1 | 0.41mi |
| 3222 6th Ave W Palmetto, FL | 3.0 | 2.0 | 1414 | $2,185 | $1.55 | 23d | 1 | 1.32mi |
| 307 27th St E Palmetto, FL | 2.0 | 2.0 | 980 | $2,000 | $2.04 | 23d | 1 | 1.41mi |
| 2615 9th Avenue Dr E Palmetto, FL | 3.0 | 2.0 | 1369 | $2,200 | $1.61 | 23d | 1 | 1.44mi |
HOA detail
- Monthly dues
- $229 · $2,748/yr
- Likely covers
- pool
Listing history 15 events
-
2026-06-18days on market $149,900 Active 166 DOM
-
2026-06-17days on market $149,900 Active 165 DOM
-
2026-06-16days on market $149,900 Active 164 DOM
-
2026-06-15days on market $149,900 Active 163 DOM
-
2026-06-13days on market $149,900 Active 161 DOM
-
2026-06-13days on market $149,900 Active 160 DOM
-
2026-06-10days on market $149,900 Active 158 DOM
-
2026-06-09days on market $149,900 Active 157 DOM
-
2026-06-08days on market $149,900 Active 156 DOM
-
2026-06-08days on market $149,900 Active 155 DOM
-
2026-06-03days on market $149,900 Active 151 DOM
-
2026-06-02days on market $149,900 Active 150 DOM
-
2026-06-01days on market $149,900 Active 149 DOM
-
2026-05-31days on market $149,900 Active 148 DOM
-
2026-01-03$149,900 Active
ⓘ Source: listings_history table (triggers on properties + properties_extension) + one-shot
backfill from property_details.listing_events for pre-trigger history.
Tax reassessment forecast FL · Resets to sale price
- Current annual tax
- $503 · $42/mo
- Projected year-2 tax
- $1,244 · $104/mo
- Expected delta
- +$741/yr (+$62/mo · 147.3%)
ⓘ Screening estimate from a state-policy table — verify with the county assessor before closing.
Climate risk First Street
- Flood 1/10 Low FEMA zone X (unshaded) · 0% chance over 30 yrs
- Wildfire 1/10 Low
- Heat 10/10 Extreme 7 d/yr ≥107°F today · 32 d/yr by 30 yrs out
- Wind 10/10 Extreme 99% chance of damaging wind over 30 yrs
- Air quality 3/10 Moderate 2 unhealthy d/yr today · 3 by 30 yrs out
Nearby sold comps map
Loading sold comps map…
Walkable amenities ~0.75 mi
Loading nearby amenities…
Taxation est. · year 1
- Rental income
- $24,408
- − Mortgage interest
- −$8,397
- − Property taxes
- −$503
- − Insurance
- −$750
- − Repairs & maintenance
- −$1,953
- − Management
- −$1,953
- − HOA
- −$2,748
- − Depreciation
- −$4,361
- Taxable income
- $3,744
- Est. tax owed @ 24.0%
- −$899
- After-tax cash flow
- $4,950/yr
For passive investors: Depreciation is non-cash, so a rental often shows a tax loss while cash-flowing — sheltering income. Rental losses are passive: they offset passive income freely, and up to $25,000/yr can offset ordinary (W-2) income if you actively participate and your MAGI is under $100k (phasing out to $0 by $150k); unused losses carry forward. On sale, claimed depreciation is recaptured at up to 25%, and gains may owe capital-gains tax (a 1031 exchange can defer both). Figures are a year-1 estimate at your 24.0% rate — not tax advice; consult a CPA.
Schools (NCES district)
- District
- Manatee
- NCES district ID
- 1201230
- Math proficiency
- 54% ▼ -6.00%
- Reading proficiency
- 50% ▼ -2.00%
- Median HH income
- $49,607
- Composite
- 44.43/100
- National rank
- #2806
- State rank
- #26 of 73 in FL
Livability — Memphis
- Score
- 63/100
- State rank
- #745
- US rank
- #16072
Category grades
Schools grade is shown separately in the Schools card above.
Census & demographics
- County
- Manatee County · 416,364 people
- City population
- 56,208
- Metro
- North Port-Sarasota-Bradenton, FL
- Population (ZIP)
- 56,208
- Household income
- $77,712
- Rent vs Own
- Severe rent burden
- 1193.0
Population outlook (Manatee County) Hauer SSP2
- Today (2025)
- 447,342 people
- By 2030
- 488,911 · +9.3%
- By 2040
- 567,934 · +27.0%
- By 2050
- 637,995 · +42.6%
- By 2075
- 781,970 · +74.8%
- By 2100
- 848,272 · +89.6%
Race, ethnicity, and origin ACS 2023
- Neighborhood character
- Diverse neighborhood (Simpson 0.58)
- Race & ethnicity
- White 59% Hispanic / Latino 22% Black 14% Two or more races 11%
- Hispanic origin (detail)
- Mexican 14% Puerto Rican 3%
- Common ancestry
- Romanian 2% Lithuanian 2% Italian 2%
- Foreign-born
- 10% · Canada, Dominican Republic, Jamaica
- Languages at home
- 81% English-only · Spanish 16% Other Indo-European 1%
Political lean MEDSL · Manatee
- 2024 margin
- Strong R (+23.5) · D 37.9% · R 61.4%
- 2008→2024 swing
- -16.5pp toward R · 2008: -7.0pp · 2024: -23.5pp
- All cycles
- 2024: R+23.5 2020: R+16.1 2016: R+17.1 2012: R+12.5 2008: R+7.0
Not yet ingested
- Civics
- —
Market trends
- HPI YoY
- ▼ -383.53%
- Current HPI
- 302.1458
- Rent YoY
- ▼ -2.98%
- Metro
- North Port-Sarasota-Bradenton, FL
- State GDP YoY
- ▲ 3.28%
- F500 in state
- 36
Industry mix (Fortune 500 HQ in FL)
| Industry | F500 HQs | Revenue |
|---|---|---|
| Industrial Technology | 2 | $29B |
|
||
| Insurance | 2 | $17B |
|
||
| Retail | 1 | $60B |
|
||
| Technology Distribution | 1 | $58B |
|
||
| Homebuilding | 1 | $35B |
|
||
| Technology Manufacturing | 1 | $35B |
|
||
Price history
1 event — show timeline
- 2026-01-03 Listed $149,900 Stellar MLS as Distributed by MLS Grid
Property tax history
-2.4%/yrLatest (2025): $503 · +9.6% YoY. Source: county tax records.
Cash-flow waterfall
monthlySold comps — $/sqft
last 12 mo · ≤1 miLoading sold comps…