101 Limestone Ct · Sunrise Lake, PA
Flood risk 1/10 · Minimal
- FEMA flood zone
- X (unshaded)
- Chance of flooding over 30 yrs
- 0.0%
- Est. flood insurance / yr
- $473 – $860
Fire risk 4/10 · Minor
- Est. fire insurance / yr
- $511 – $949
Heat risk 3/10 · Minor
- Hot days now (above 92°F)
- 7 days/yr
- Hot days in 30 yrs
- 15 days/yr
Wind risk 3/10 · Minor
- Chance of severe wind over 30 yrs
- 6.0%
Air-quality risk 2/10 · Minimal
- Unhealthy air days now
- 1 days/yr
- Unhealthy air days in 30 yrs
- 2 days/yr
Risk factors via First Street. Map © Google.
Why this score? — see what drove the D+ grade
The composite is a weighted blend of 9 inputs, each scored 0–100. Each bar is that input's sub-score; the figure is the points it added to the 100-point composite (weight × sub-score).
- Cash flow +13.7/30.0
- ARV discount +10.1/15.0
- Schools +4.7/10.0
- 1% rule +4.2/10.0
- DSCR +4.1/10.0
- Livability +3.4/5.0
- Rent growth +2.5/5.0
- Condition / age +2.5/5.0
- Appreciation +0.0/10.0
$215,000
🖨 Deal sheet (PDF) 📄 Offer letter ✓ Due diligence
Listing remarks MLS
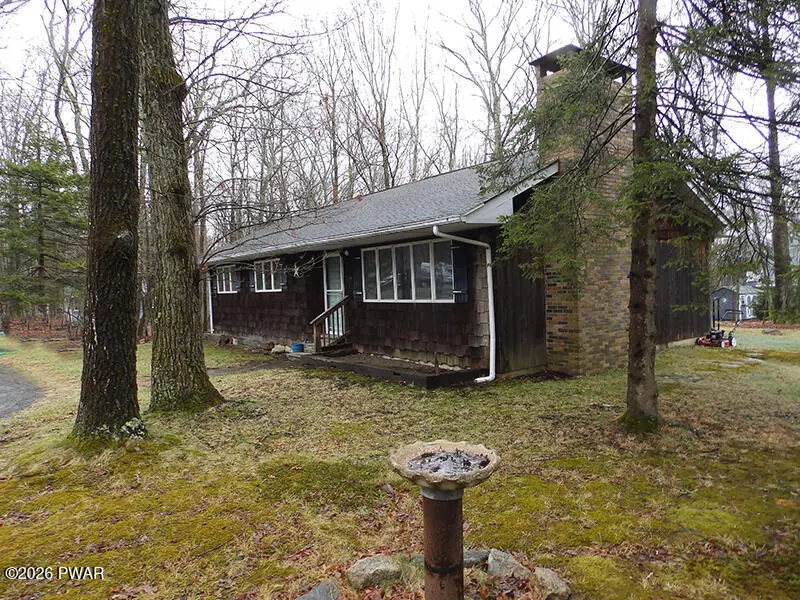
Cedar Shake Ranch Home On a CornerBright Ranch home on a level corner parcel on a quiet country lane features lots of Anderson windows, laminate floors, bright living room with bluestone fireplace with woodstove insert and picture window, Country kitchen with appliances plus dining, all tile bath and 3 good sized bedrooms. Large storage building. Perfect starter, retirement or getaway.
Key facts
- Laminate floors
- Anderson windows
- Woodstove insert
Tags
Neighborhood map
What this means for you Summary
Snapshot
- This is a 2-bed/1.5-bath single-family listed at $215k.
Deal economics
- At list price, monthly cash flow is $14 ($174/yr) — positive.
- The deal already cash-flows at list — no discount required.
- To meet the 1% rule (rent ≥ 1% of price), the offer needs to be $197k (8.3% below list).
- Recommended offer: $197k (8.3% below list) — sets the bar for 1% rule.
Location & tenants
- Location reads 67/100 on livability (#962 in PA) — a middle-class / working-renter tenant base. Strengths: cost of living A+, housing A+, crime A; Watch: employment D, health & safety D, amenities F.
- Delaware Valley SD (rural): math 41% / reading 66% proficiency, ranked #121 of 539 in PA (top 22%) — acceptable for families but not a draw, mixed tenant base, ~2y average lease.
- Market conditions: 290 active listings in the ZIP; 1 comparable units currently listed for rent nearby; solid renter incomes; 213 units permitted in Pike County in 2024 (0 in 5+ unit buildings).
Forward outlook
- Local home prices are declining (-3.0%/yr); year-one equity from $1k of loan paydown is wiped out by about $6k of value loss. Plan a longer hold.
- Pike County population projected at -25% by 2050 — secular population decline; favor cash flow + early exit over multi-decade hold.
Negotiation context
- It's been on market 75 days — a 6% lower offer ($202k) is reasonable based on typical stale-listing flexibility.
- 2 sale attempts since 9y ago with the ask held roughly flat each time — persistent listings suggest the price (not the market) is what's stuck; bring a comps-based counter.
- Current owner paid $45k; list at $215k implies a 379% gain — meaningful room to come down on a strong offer.
Questions for the listing agent
- It's been on market 75 days. Have you received any prior offers? Is the seller open to a 8% concession, seller financing, or rate buy-down credit?
- Built in 1974 — when were the roof, HVAC, electrical panel, plumbing, and water heater last replaced?
- What does the HOA fee cover, when was the last increase, and are there any pending special assessments or reserve-fund shortfalls?
- Why hasn't it sold? Are there any deal-killer items the seller is aware of (foundation, flood, title, zoning, code violations)?
- Is there a deadline driving the sale (1031 exchange, divorce, estate, relocation)? That informs how much negotiation room exists.
- The area grade is low — what's the realistic commute time and amenity access for the typical tenant pool here? Any planned neighborhood developments (good or bad) we should know about?
- What's the average days-on-market for RENTAL listings here right now (not sales)? A rising rental-DOM trend means longer vacancies and softer asking-rent achievability than the comps imply.
- What's the recent tenant-quality profile in this submarket — average credit score on applications, eviction rate, late-payment / NSF rate, and stable-employment percentage? A property-management company in the area should have these aggregated.
- How much new for-sale + rental construction is in the pipeline within 1–3 miles? Heavy new supply typically softens prices + rents 12–24 months out; constrained supply supports both.
Investment metrics
- 1% rule
- 0.92% ✗
- Cap rate
- 6.37%
- Cash-on-cash
- 0.29%
- DSCR
- 1.01
- GRM
- 9.1
CMA / ARV
- ARV (median comp)
- $228,393
- List price
- $215,000
- Delta
- -5.86%
- Verdict
- FAIR
- Comps
- 20 within 1.0 mi
Show comp detail 10 sales within ~0.75 mi
| Address | Dist | Beds/Ba | Sqft | Sold | Price | $/sf | Match |
|---|---|---|---|---|---|---|---|
| 105 Limestone Ct | 0.04mi | 2/2.0 | 1,328 (+11%) | 6mo | $180,000 | $136 | 72 |
| 30 Brownstone Dr | 0.02mi | 3/1.5 (+1) | 1,125 (-6%) | 15mo | $186,000 | $165 | 72 |
| 106 Pumice Ct Ct | 0.08mi | 3/1.0 (+1) | 1,320 (+11%) | 3mo | $280,000 | $212 | 69 |
| 104 Gristmill Ter | 0.36mi | 3/2.0 (+1) | 1,168 (-2%) | 7mo | $270,000 | $231 | 67 |
| 103 Wood Haven Ct | 0.25mi | 2/3.0 | 1,144 (-4%) | 12mo | $295,000 | $258 | 66 |
| 100 Cleveland Court Ct | 0.19mi | 3/1.0 (+1) | 1,049 (-12%) | 8mo | $240,000 | $229 | 58 |
| 103 Truman Ct | 0.30mi | 3/2.0 (+1) | 1,296 (+9%) | 18mo | $250,000 | $193 | 49 |
| 103 Van Buren Ct | 0.36mi | 3/1.5 (+1) | 1,014 (-15%) | 7mo | $220,000 | $217 | 47 |
| 220 Sunrise Dr | 0.56mi | 3/2.0 (+1) | 1,126 (-6%) | 12mo | $291,500 | $259 | 47 |
| 102 Perch Ter | 0.70mi | 3/1.5 (+1) | 1,164 (-2%) | 23mo | $237,100 | $204 | 40 |
Match score weights: distance 35% · size 25% · config 20% · recency 20%. Top-matched comps best support the ARV.
Projected returns pro-forma
-3.0% appreciation · 3.0% rent growth · sell at horizon
- IRR
- -15.8%
- Equity multiple
- 0.44×
- Total profit
- $-33,851
- Equity at exit
- $32,057
- IRR
- -7.3%
- Equity multiple
- 0.53×
- Total profit
- $-28,022
- Equity at exit
- $18,589
Cash invested: $60,200 (down + closing). Projections, not guarantees.
Landlord ↔ Tenant lean methodology
- Overall (STATE)
- 62 Landlord-Friendly
- State Pennsylvania
- 62 Landlord-Friendly · EVEN
- County
- — inherits STATE
- City
- — inherits STATE
ZIP-level market 18337
- Home prices YoY
- -22.0%
- Active inventory
- 290
- Price-to-rent
- 9.1×
Monthly cashflow live
- Estimated rent
- $1,972 medium interval (Pro) →
- Mortgage (P&I)
- −$1,127
- Tax from tax record
- −$235 /mo · $2,815/yr
- Insurance
- −$90
- HOA
- −$92
- Vacancy / Maint / Mgmt
- −$414
- Net cashflow
- $14
Break-even live
Sensitivity live
| Price | -10% $136 | -5% $75 | +0% $14 | +5% $-46 | +10% $-107 |
|---|---|---|---|---|---|
| Rent | -10% $-141 | -5% $-63 | +0% $14 | +5% $92 | +10% $170 |
| Rate | -1.0pp $123 | -0.5pp $69 | base $14 | +0.5pp $-41 | +1.0pp $-98 |
UW: 25.0% down · 7.5% · 30yr · 1.5% tax · 5.0% vac · 8.0% maint · 8.0% mgmt
Financing live
Cash to close
- Down payment
- $53,750
- Closing costs
- $6,450
- Reserves months
- —
- Total cash needed
- —
Loan-product check · same deal, 3 products live
Conventional
25% down · 7.5% · 30yr
- Down + closing
- —
- Monthly P&I
- —
- Monthly cashflow
- —
- DSCR
- —
- Eligible?
- —
Personal DTI + credit; lowest rate.
DSCR
20% down · 8.5% · 30yr
- Down + closing
- —
- Monthly P&I
- —
- Monthly cashflow
- —
- DSCR
- —
- Eligible?
- —
No personal income docs; deal must DSCR.
Hard money
10% down · 12.0% · 12mo
- Down + closing
- —
- Monthly P&I
- —
- Monthly cashflow
- —
- DSCR
- —
- Eligible?
- —
Short-term bridge; refi at stabilization.
Rent comps 1 comps
| Address | Beds | Baths | Sqft | Rent | $/sqft | DOM | Units | Dist |
|---|---|---|---|---|---|---|---|---|
| 129 Buck Run Dr Milford, PA | 2.0 | 1.0 | 1000 | $1,700 | $1.70 | 44d | 1 | 0.49mi |
HOA detail
- Monthly dues
- $92 · $1,104/yr
Listing history 18 events
-
2026-06-18days on market $215,000 Active 75 DOM
-
2026-06-17days on market $215,000 Active 74 DOM
-
2026-06-16days on market $215,000 Active 73 DOM
-
2026-06-15days on market $215,000 Active 72 DOM
-
2026-06-13days on market $215,000 Active 70 DOM
-
2026-06-13days on market $215,000 Active 69 DOM
-
2026-06-09days on market $215,000 Active 66 DOM
-
2026-06-08days on market $215,000 Active 65 DOM
-
2026-06-07days on market $215,000 Active 64 DOM
-
2026-06-04days on market $215,000 Active 61 DOM
-
2026-06-03days on market $215,000 Active 60 DOM
-
2026-06-02days on market $215,000 Active 59 DOM
-
2026-06-01days on market $215,000 Active 58 DOM
-
2026-05-31days on market $215,000 Active 57 DOM
-
2026-04-04$220,000 Active 388-char remark
Show marketing remark (388 chars)
Cedar Shake Ranch Home On a CornerBright Ranch home on a level corner parcel on a quiet country lane features lots of Anderson windows, laminate floors, bright living room with bluestone fireplace with woodstove insert and picture window, Country kitchen with appliances plus dining, all tile bath and 3 good sized bedrooms. Large storage building. Perfect starter, retirement or getaway.
-
2017-10-04soldstatus $44,900 336-char remark
Show marketing remark (336 chars)
Priced to Sell. Ranch located on a corner lot with nice level yard and shed. Home features 2 Bedrooms, Bath, Living Room with stone fireplace, family room, large eat in kitchen with pantry. Located in a lake community that offers 3 lakes and a pool. Home being sold "as is". , Beds Description: 2+Bed1st, Baths: 1 Bath Level 1
-
2017-08-06$44,900 336-char remark
Show marketing remark (336 chars)
Priced to Sell. Ranch located on a corner lot with nice level yard and shed. Home features 2 Bedrooms, Bath, Living Room with stone fireplace, family room, large eat in kitchen with pantry. Located in a lake community that offers 3 lakes and a pool. Home being sold "as is". , Beds Description: 2+Bed1st, Baths: 1 Bath Level 1
-
1981-08-19soldstatus $42,000
ⓘ Source: listings_history table (triggers on properties + properties_extension) + one-shot
backfill from property_details.listing_events for pre-trigger history.
Tax reassessment forecast PA · Partial reset (capped growth)
- Current annual tax
- $2,815 · $235/mo
- Projected year-2 tax
- $3,106 · $259/mo
- Expected delta
- +$291/yr (+$24/mo · 10.3%)
ⓘ Screening estimate from a state-policy table — verify with the county assessor before closing.
Climate risk First Street
- Flood 1/10 Low FEMA zone X (unshaded) · 0% chance over 30 yrs
- Wildfire 4/10 Moderate
- Heat 3/10 Moderate 7 d/yr ≥92°F today · 15 d/yr by 30 yrs out
- Wind 3/10 Moderate 6% chance of damaging wind over 30 yrs
- Air quality 2/10 Low 1 unhealthy d/yr today · 2 by 30 yrs out
Nearby sold comps map
Loading sold comps map…
Walkable amenities ~0.75 mi
Loading nearby amenities…
Taxation est. · year 1
- Rental income
- $23,668
- − Mortgage interest
- −$12,043
- − Property taxes
- −$2,815
- − Insurance
- −$1,075
- − Repairs & maintenance
- −$1,893
- − Management
- −$1,893
- − HOA
- −$1,104
- − Depreciation
- −$6,255
- Taxable loss
- −$3,411
- Est. tax savings @ 24.0%
- +$819
- After-tax cash flow
- $993/yr
For passive investors: Depreciation is non-cash, so a rental often shows a tax loss while cash-flowing — sheltering income. Rental losses are passive: they offset passive income freely, and up to $25,000/yr can offset ordinary (W-2) income if you actively participate and your MAGI is under $100k (phasing out to $0 by $150k); unused losses carry forward. On sale, claimed depreciation is recaptured at up to 25%, and gains may owe capital-gains tax (a 1031 exchange can defer both). Figures are a year-1 estimate at your 24.0% rate — not tax advice; consult a CPA.
Schools (NCES district)
- District
- Delaware Valley SD
- NCES district ID
- 4207530
- Math proficiency
- 41% ▼ -12.00%
- Reading proficiency
- 66% ▼ -9.00%
- Median HH income
- $64,202
- Composite
- 46.95/100
- National rank
- #2359
- State rank
- #121 of 539 in PA
Livability — Sunrise Lake
- Score
- 67/100
- State rank
- #962
- US rank
- #10528
Category grades
Schools grade is shown separately in the Schools card above.
Census & demographics
- Census place
- Sunrise Lake, PA
- County
- Pike County · 15,799 people
- Metro
- New York-Newark-Jersey City, NY-NJ-PA
- Population (ZIP)
- 15,799
- Household income
- $93,149
- Rent vs Own
- Severe rent burden
- 275.0
Population outlook (Pike County) Hauer SSP2
- Today (2025)
- 53,548 people
- By 2030
- 51,622 · -3.6%
- By 2040
- 46,490 · -13.2%
- By 2050
- 40,372 · -24.6%
- By 2075
- 31,951 · -40.3%
- By 2100
- 26,821 · -49.9%
Race, ethnicity, and origin ACS 2023
- Neighborhood character
- Predominantly White (82%)
- Race & ethnicity
- White 82% Hispanic / Latino 10% Two or more races 7% Black 4% Asian 2%
- Hispanic origin (detail)
- Mexican 1% Puerto Rican 4% Cuban 1%
- Common ancestry
- Romanian 6% Iranian 2% Portuguese 2%
- Foreign-born
- 6% · Canada, China, South Korea
- Languages at home
- 89% English-only · Spanish 6% Russian/Polish/Slavic 2% German/W. Germanic 1%
Political lean MEDSL · Pike
- 2024 margin
- Strong R (+24.1) · D 37.6% · R 61.6%
- 2008→2024 swing
- -19.8pp toward R · 2008: -4.2pp · 2024: -24.1pp
- All cycles
- 2024: R+24.1 2020: R+19.0 2016: R+26.0 2012: R+11.0 2008: R+4.2
Not yet ingested
- Civics
- —
Market trends
- HPI YoY
- ▼ -54.81%
- Current HPI
- 194.0604
- Rent YoY
- —
- Metro
- New York-Newark-Jersey City, NY-NJ-PA
- State GDP YoY
- ▲ 1.68%
- F500 in state
- 34
Industry mix (Fortune 500 HQ in PA)
| Industry | F500 HQs | Revenue |
|---|---|---|
| Healthcare | 2 | $309B |
|
||
| Insurance | 2 | $27B |
|
||
| Telecommunications / Media | 1 | $124B |
|
||
| Industrial Distribution | 1 | $22B |
|
||
| Financial Services | 1 | $20B |
|
||
| Chemicals / Materials | 1 | $18B |
|
||
Price history
+423.8% since first listed4 events — show timeline
- 2026-04-04 Listed $220,000 PWMLS
- 2017-10-04 Sold (MLS) $44,900 PWMLS
- 2017-08-06 Listed $44,900 PWMLS
- 1981-08-19 Sold (Public Records) $42,000 Public Records
Property tax history
+1.8%/yrLatest (2026): $2,815 · +1.5% YoY. Source: county tax records.
Cash-flow waterfall
monthlySold comps — $/sqft
last 12 mo · ≤1 miLoading sold comps…