709 S Main St · Gretna, VA
Flood risk 1/10 · Minimal
- FEMA flood zone
- X (unshaded)
- Chance of flooding over 30 yrs
- 0.0%
- Est. flood insurance / yr
- $507 – $1,088
Fire risk 4/10 · Minor
- Est. fire insurance / yr
- $666 – $1,236
Heat risk 5/10 · Moderate
- Hot days now (above 101°F)
- 7 days/yr
- Hot days in 30 yrs
- 17 days/yr
Wind risk 3/10 · Minor
- Chance of severe wind over 30 yrs
- 4.0%
Air-quality risk 2/10 · Minimal
- Unhealthy air days now
- 1 days/yr
- Unhealthy air days in 30 yrs
- 1 days/yr
Risk factors via First Street. Map © Google.
Why this score? — see what drove the B+ grade
The composite is a weighted blend of 9 inputs, each scored 0–100. Each bar is that input's sub-score; the figure is the points it added to the 100-point composite (weight × sub-score).
- Cash flow +30.0/30.0
- 1% rule +10.0/10.0
- DSCR +10.0/10.0
- ARV discount +7.5/15.0
- Appreciation +6.0/10.0
- Schools +6.0/10.0
- Livability +3.7/5.0
- Rent growth +2.5/5.0
- Condition / age +2.5/5.0
$39,900
🖨 Deal sheet 📄 Offer letter ✓ Due diligence
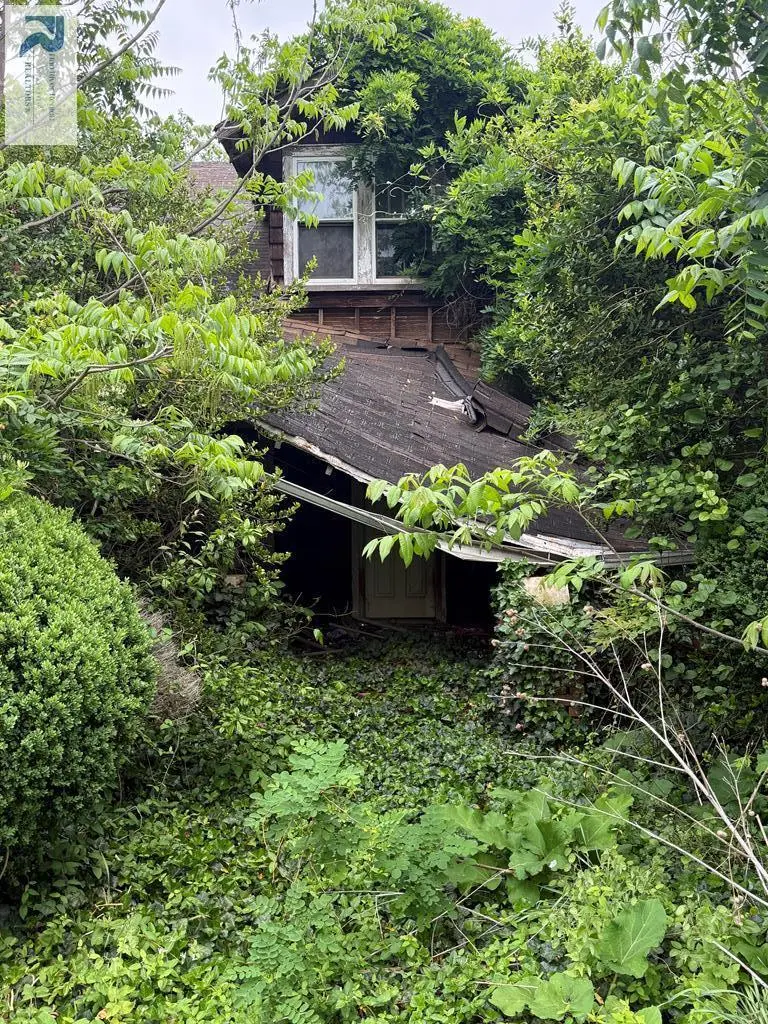
Listing remarks
1.89 acre lot on Main Street in Gretna with home on the property
Key facts
- 1.89 acre lot
- 1.85 acre lot
- Built 1930
Tags
Property features AI
Finance
- Other: Zoning: TZ; Lot size approximately 1.85 acres; Subdivision: 29 NORTH
- Financial info: Annual tax listed (amount provided in source)
Exterior
- Parking: No garage
- Utilities: Public water; Public sewer
- Home design: Residential property; Approximately 1,400 above-grade finished area
- Construction: Wood siding; Composition roof
- Exterior features: Front porch
Interior
- Bedrooms: Three main-level bedrooms
- Flooring: Carpet; Hardwood
- Bathrooms: One full bathroom; One half bathroom (main level)
- Heating & cooling: No heating system specified
- Interior features: Carpet and hardwood flooring; Unfinished basement
Neighborhood map
What this means for you Summary
Snapshot
- This is a 3-bed/1.5-bath single-family listed at $40k.
Deal economics
- At list price, monthly cash flow is $782 ($9k/yr) — positive.
- The deal already cash-flows at list — no discount required.
- Meets the 1% rule at list price ($1k rent vs $40k).
- Recommended offer: $39k (3.0% below list) — sets the bar for market timing.
- Cap rate 29.8% vs local median 5.5% in Gretna — top-decile yield for the area; either an underpriced asset or a hidden risk that comps aren't pricing in. Stress-test before assuming the spread holds.
Location & tenants
- Location reads 74/100 on livability (#157 in VA, #4,927 nationally) — a middle-class / working-renter tenant base. Strengths: crime A+, cost of living A+, health & safety A+; Watch: amenities F, commute F, employment F.
- Pittsylvania County Public School District (rural): math 65% / reading 78% proficiency, ranked #22 of 131 in VA (top 17%) — strong family-tenant draw, lease renewals of 3-5y typical.
- Market conditions: 81 active listings in the ZIP; 1 comparable units currently listed for rent nearby; 72 units permitted in Pittsylvania County in 2024 (0 in 5+ unit buildings).
Forward outlook
- In year one you build about $1k of equity ($276 loan paydown + $764 appreciation (1.9% local appreciation)).
- Pittsylvania County population projected at -22% by 2050 — secular population decline; favor cash flow + early exit over multi-decade hold.
- At projected returns (1.9% appreciation + 3.0% rent growth), your $11k cash investment doubles in ~2 years — after that, you're playing with house money.
Negotiation context
- It's been on market 35 days — a 3% lower offer ($39k) is reasonable based on typical stale-listing flexibility.
Risks & watch-outs
- Watch-outs: built in 1930 — expect roof / HVAC / electrical / plumbing capex.
- Climate carrying-cost: extreme-heat days projected 7→17/yr by 2055 (HVAC capex compounding) — expect insurance premiums to compound above CPI over the hold.
Questions for the listing agent
- It's been on market 35 days. Have you received any prior offers? Is the seller open to a 3% concession, seller financing, or rate buy-down credit?
- Built in 1930 — when were the roof, HVAC, electrical panel, plumbing, and water heater last replaced?
- Is there a deadline driving the sale (1031 exchange, divorce, estate, relocation)? That informs how much negotiation room exists.
- Schools are B-rated — typically a magnet for longer-tenancy family renters. What's the average tenant stay here, and is there a school-zone premium baked into asking?
- What's the average days-on-market for RENTAL listings here right now (not sales)? A rising rental-DOM trend means longer vacancies and softer asking-rent achievability than the comps imply.
- What's the recent tenant-quality profile in this submarket — average credit score on applications, eviction rate, late-payment / NSF rate, and stable-employment percentage? A property-management company in the area should have these aggregated.
- How much new for-sale + rental construction is in the pipeline within 1–3 miles? Heavy new supply typically softens prices + rents 12–24 months out; constrained supply supports both.
Investment metrics
- 1% rule
- 3.26% ✓
- Cap rate
- 29.83%
- Cash-on-cash
- 84.05%
- DSCR
- 4.74
- GRM
- 2.6
CMA / ARV
- ARV (median comp)
- $206,127
- List price
- $39,900
- Delta
- -80.64%
- Verdict
- UNDERPRICED
- Comps
- 20 within 1.0 mi
Show comp detail 5 sales within ~0.75 mi
| Address | Dist | Beds/Ba | Sqft | Sold | Price | $/sf | Match |
|---|---|---|---|---|---|---|---|
| 104 N Frankln Blvd | 0.67mi | 3/3.0 | 1,386 (-1%) | 2mo | $230,000 | $166 | 59 |
| 101 S Franklin Blvd Blvd | 0.58mi | 3/1.0 | 1,440 (+3%) | 18mo | $182,900 | $127 | 51 |
| 104 Harvey St | 0.53mi | 3/2.0 | 1,528 (+9%) | 16mo | $212,000 | $139 | 46 |
| 206 Huffmond St St | 0.75mi | 3/2.0 | 1,505 (+7%) | 10mo | $235,700 | $157 | 43 |
| 202 Dalton St | 0.66mi | 2/1.0 (-1) | 1,272 (-9%) | 6mo | $147,000 | $116 | 41 |
Match score weights: distance 35% · size 25% · config 20% · recency 20%. Top-matched comps best support the ARV.
Projected returns pro-forma
1.91% appreciation · 3.0% rent growth · sell at horizon
- IRR
- 87.7%
- Equity multiple
- 5.69×
- Total profit
- $52,401
- Equity at exit
- $15,555
- IRR
- 87.9%
- Equity multiple
- 11.71×
- Total profit
- $119,624
- Equity at exit
- $22,260
Cash invested: $11,172 (down + closing). Projections, not guarantees.
Landlord ↔ Tenant lean methodology
- Overall (STATE)
- 55 Moderately Landlord-Leaning
- State Virginia
- 55 Moderately Landlord-Leaning · D+2
- County
- — inherits STATE
- City
- — inherits STATE
ZIP-level market 24557
- Home prices YoY
- 1.2%
- Active inventory
- 81
- Price-to-rent
- 2.6×
Monthly cashflow live
- Estimated rent
- $1,300 medium interval (Pro) →
- Mortgage (P&I)
- −$209
- Tax from tax record
- −$19 /mo · $224/yr
- Insurance
- −$17
- HOA
- −$0
- Vacancy / Maint / Mgmt
- −$273
- Net cashflow
- $782
Break-even live
UW: 25.0% down · 7.5% · 30yr · 1.5% tax · 5.0% vac · 8.0% maint · 8.0% mgmt
Financing live
Cash to close
- Down payment
- $9,975
- Closing costs
- $1,197
- Reserves months
- —
- Total cash needed
- —
Loan-product check · same deal, 3 products live
Conventional
25% down · 7.5% · 30yr
- Down + closing
- —
- Monthly P&I
- —
- Monthly cashflow
- —
- DSCR
- —
- Eligible?
- —
Personal DTI + credit; lowest rate.
DSCR
20% down · 8.5% · 30yr
- Down + closing
- —
- Monthly P&I
- —
- Monthly cashflow
- —
- DSCR
- —
- Eligible?
- —
No personal income docs; deal must DSCR.
Hard money
10% down · 12.0% · 12mo
- Down + closing
- —
- Monthly P&I
- —
- Monthly cashflow
- —
- DSCR
- —
- Eligible?
- —
Short-term bridge; refi at stabilization.
Rent comps 1 comps
| Address | Beds | Baths | Sqft | Rent | $/sqft | DOM | Units | Dist |
|---|---|---|---|---|---|---|---|---|
| 192 Peoples Supply Rd Gretna, VA | 3.0 | 1.0 | 1370 | $1,300 | $0.95 | 43d | 1 | 0.21mi |
Listing history 14 events
-
2026-06-16days on market $39,900 Active 35 DOM
-
2026-06-15days on market $39,900 Active 34 DOM
-
2026-06-14days on market $39,900 Active 32 DOM
-
2026-06-13days on market $39,900 Active 31 DOM
-
2026-06-10days on market $39,900 Active 29 DOM
-
2026-06-09days on market $39,900 Active 28 DOM
-
2026-06-08days on market $39,900 Active 27 DOM
-
2026-06-07days on market $39,900 Active 26 DOM
-
2026-06-03days on market $39,900 Active 22 DOM
-
2026-06-02days on market $39,900 Active 21 DOM
-
2026-06-01days on market $39,900 Active 20 DOM
-
2026-05-31days on market $39,900 Active 19 DOM
-
2026-05-30days on market $39,900 Active 18 DOM
-
2026-05-13$39,900 Active 64-char remark
ⓘ Source: listings_history table (triggers on properties + properties_extension) + one-shot
backfill from property_details.listing_events for pre-trigger history.
Tax reassessment forecast VA · Resets to sale price
- Current annual tax
- $224 · $19/mo
- Projected year-2 tax
- $327 · $27/mo
- Expected delta
- +$103/yr (+$9/mo · 46.2%)
ⓘ Screening estimate from a state-policy table — verify with the county assessor before closing.
Climate risk First Street
- Flood 1/10 Low FEMA zone X (unshaded) · 0% chance over 30 yrs
- Wildfire 4/10 Moderate
- Heat 5/10 Major 7 d/yr ≥101°F today · 17 d/yr by 30 yrs out
- Wind 3/10 Moderate 4% chance of damaging wind over 30 yrs
- Air quality 2/10 Low 1 unhealthy d/yr today · 1 by 30 yrs out
Nearby sold comps map
Loading sold comps map…
Walkable amenities ~0.75 mi
Loading nearby amenities…
Taxation est. · year 1
- Rental income
- $15,600
- − Mortgage interest
- −$2,235
- − Property taxes
- −$224
- − Insurance
- −$200
- − Repairs & maintenance
- −$1,248
- − Management
- −$1,248
- − Depreciation
- −$1,161
- Taxable income
- $9,285
- Est. tax owed @ 24.0%
- −$2,228
- After-tax cash flow
- $7,161/yr
For passive investors: Depreciation is non-cash, so a rental often shows a tax loss while cash-flowing — sheltering income. Rental losses are passive: they offset passive income freely, and up to $25,000/yr can offset ordinary (W-2) income if you actively participate and your MAGI is under $100k (phasing out to $0 by $150k); unused losses carry forward. On sale, claimed depreciation is recaptured at up to 25%, and gains may owe capital-gains tax (a 1031 exchange can defer both). Figures are a year-1 estimate at your 24.0% rate — not tax advice; consult a CPA.
Schools (NCES district)
- District
- Pittsylvania County Public School District
- NCES district ID
- 5102940
- Math proficiency
- 65% ▼ -22.00%
- Reading proficiency
- 78% ▼ -4.00%
- Median HH income
- $41,672
- Composite
- 59.77/100
- National rank
- #900
- State rank
- #22 of 131 in VA
Livability — Gretna
- Score
- 74/100
- State rank
- #157
- US rank
- #4927
Category grades
Schools grade is shown separately in the Schools card above.
Census & demographics
- Census place
- Gretna, VA
- Population (ZIP)
- 7,832
Population outlook (Pittsylvania County) Hauer SSP2
- Today (2025)
- 58,725 people
- By 2030
- 56,388 · -4.0%
- By 2040
- 51,088 · -13.0%
- By 2050
- 45,875 · -21.9%
- By 2075
- 36,555 · -37.8%
- By 2100
- 28,288 · -51.8%
Race, ethnicity, and origin ACS 2023
- Neighborhood character
- Predominantly White (76%)
- Race & ethnicity
- White 76% Black 20% Two or more races 2% Hispanic / Latino 2%
- Common ancestry
- Slovak 2% Serbian 1% Lithuanian 1%
- Foreign-born
- 1% · Canada
- Languages at home
- 99% English-only · Spanish 1%
Political lean MEDSL · Pittsylvania
- 2024 margin
- Solid R (+43.1) · D 28.1% · R 71.3%
- 2008→2024 swing
- -19.1pp toward R · 2008: -24.0pp · 2024: -43.1pp
- All cycles
- 2024: R+43.1 2020: R+39.8 2016: R+39.6 2012: R+27.5 2008: R+24.0
Not yet ingested
- Civics
- —
Market trends
- HPI YoY
- ▲ 1.91%
- Current HPI
- 160.7742
- Rent YoY
- —
- Metro
- —
- State GDP YoY
- ▲ 2.40%
- F500 in state
- 50
Industry mix (Fortune 500 HQ in VA)
| Industry | F500 HQs | Revenue |
|---|---|---|
| Aerospace / Defense | 4 | $236B |
|
||
| Technology / Defense | 3 | $32B |
|
||
| Financial Services | 2 | $176B |
|
||
| Utilities | 2 | $27B |
|
||
| Insurance | 2 | $25B |
|
||
| Technology | 2 | $15B |
|
||
Price history
1 event — show timeline
- 2026-05-13 Listed $39,900 DRRAR
Property tax history
+0.5%/yrLatest (2026): $224 · +10.7% YoY. Source: county tax records.
Cash-flow waterfall
monthlySold comps — $/sqft
last 12 mo · ≤1 miLoading sold comps…