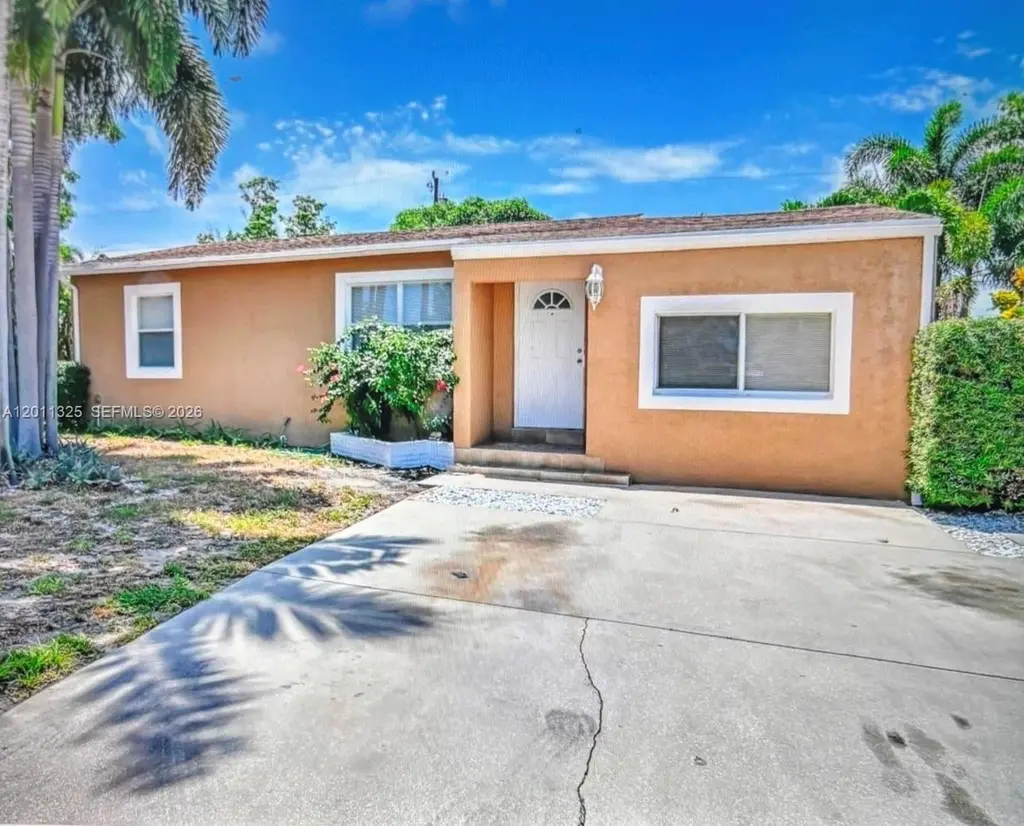
822 Avenida Hermosa · West Palm Beach, FL
Flood risk 3/10 · Minor
- FEMA flood zone
- X (unshaded)
- Chance of flooding over 30 yrs
- 0.2%
- Est. flood insurance / yr
- $507 – $1,088
Fire risk 1/10 · Minimal
- Est. fire insurance / yr
- $947 – $1,759
Heat risk 10/10 · Severe
- Hot days now (above 105°F)
- 7 days/yr
- Hot days in 30 yrs
- 26 days/yr
Wind risk 10/10 · Severe
- Chance of severe wind over 30 yrs
- 99.0%
Air-quality risk 2/10 · Minimal
- Unhealthy air days now
- 1 days/yr
- Unhealthy air days in 30 yrs
- 1 days/yr
Risk factors via First Street. Map © Google.
Why this score? — see what drove the C grade
The composite is a weighted blend of 9 inputs, each scored 0–100. Each bar is that input's sub-score; the figure is the points it added to the 100-point composite (weight × sub-score).
- Cash flow +21.5/30.0
- ARV discount +7.5/15.0
- DSCR +6.8/10.0
- 1% rule +5.7/10.0
- Schools +4.3/10.0
- Livability +4.1/5.0
- Rent growth +3.4/5.0
- Condition / age +2.5/5.0
- Appreciation +0.0/10.0
$445,000
🖨 Deal sheet 📄 Offer letter ✓ Due diligence
Listing remarks
Well-maintained single-family home 3-bedroom, 2-baths. NO HOA! Short Sale subject to lender approval. Property is being sold AS-IS.
Key facts
- 6,211 sq ft lot
- Parking
- Built 1950
Property features AI
Exterior
- Parking: Driveway; On-street parking
- Utilities: Public water; Public sewer
- Home design: One-story; Single-family zoning (SF7); Faces east
- Construction: Block construction; Shingle roof; Resale property
- Exterior features: Patio; City street frontage; Lot smaller than a quarter acre
Interior
- Kitchen: Microwave; Refrigerator
- Bedrooms: Other room types (unspecified)
- Flooring: Tile
- Bathrooms: 2 full bathrooms
- Heating & cooling: Central heating; Central air conditioning
- Interior features: Handicap access; Combined living and dining area
- Laundry & utility: Washer; Dryer
Neighborhood map
What this means for you Summary
Snapshot
- This is a 3-bed/1.0-bath single-family listed at $445k.
Deal economics
- At list price, monthly cash flow is $665 ($8k/yr) — positive.
- The deal already cash-flows at list — no discount required.
- Meets the 1% rule at list price ($5k rent vs $445k).
- Cap rate 8.1% vs local median 3.8% in West Palm Beach — top-decile yield for the area; either an underpriced asset or a hidden risk that comps aren't pricing in. Stress-test before assuming the spread holds.
Location & tenants
- Location reads 82/100 on livability (#75 in FL, #1,255 nationally) — a professional / high-income tenant draw. Strengths: commute A+, housing A+, health & safety A+; Watch: employment C-, crime F.
- Palm Beach (suburban): math 46% / reading 53% proficiency, ranked #34 of 73 in FL (top 47%) — families likely to look elsewhere, expect single-tenant / working-renter base with shorter leases.
- Market conditions: Rents rising (+3.4%/yr); 212 active listings in the ZIP; 40 comparable units currently listed for rent nearby; rentals at typical pace (median 22d on market — plan ~3-4 weeks tenant-placement turnaround); solid renter incomes; 3,974 units permitted in Palm Beach County in 2024 (1,012 in 5+ unit buildings).
- At $4,778/mo this rent would consume 66% of the median local household income ($87k/yr) (locally 1055% of renters already pay >50% of income on rent) — very limited rent-growth headroom before tenants either downsize or default.
Forward outlook
- Local home prices are declining (-3.0%/yr); year-one equity from $3k of loan paydown is wiped out by about $13k of value loss. Plan a longer hold.
- Palm Beach County population projected at +30% by 2050 — long-run rental-demand tailwind backs the buy-and-hold thesis.
Negotiation context
- Only 14 days on market — expect competitive offers; lowballing is unlikely to land.
- 6 sale attempts since 4y ago with the ask held roughly flat each time — persistent listings suggest the price (not the market) is what's stuck; bring a comps-based counter.
Risks & watch-outs
- Watch-outs: built in 1950 — expect roof / HVAC / electrical / plumbing capex.
- Climate carrying-cost: severe wind risk, 99% chance of damaging wind over 30y; extreme-heat days projected 7→26/yr by 2055 (HVAC capex compounding) — expect insurance premiums to compound above CPI over the hold.
Questions for the listing agent
- Built in 1950 — when were the roof, HVAC, electrical panel, plumbing, and water heater last replaced?
- Is there a deadline driving the sale (1031 exchange, divorce, estate, relocation)? That informs how much negotiation room exists.
- Crime grade is F in this area — have there been break-ins, vandalism, or insurance claims at this property in the last 3 years? What carrier currently insures it and at what premium?
- What's the average days-on-market for RENTAL listings here right now (not sales)? A rising rental-DOM trend means longer vacancies and softer asking-rent achievability than the comps imply.
- What's the recent tenant-quality profile in this submarket — average credit score on applications, eviction rate, late-payment / NSF rate, and stable-employment percentage? A property-management company in the area should have these aggregated.
- How much new for-sale + rental construction is in the pipeline within 1–3 miles? Heavy new supply typically softens prices + rents 12–24 months out; constrained supply supports both.
Investment metrics
- 1% rule
- 1.07% ✓
- Cap rate
- 8.09%
- Cash-on-cash
- 6.40%
- DSCR
- 1.28
- GRM
- 7.8
CMA / ARV
No comps found within radius.
Projected returns pro-forma
-3.0% appreciation · 3.44% rent growth · sell at horizon
- IRR
- -5.9%
- Equity multiple
- 0.78×
- Total profit
- $-27,559
- Equity at exit
- $66,351
- IRR
- 4.3%
- Equity multiple
- 1.32×
- Total profit
- $39,687
- Equity at exit
- $38,475
Cash invested: $124,600 (down + closing). Projections, not guarantees.
Landlord ↔ Tenant lean methodology
- Overall (STATE)
- 87 Strongly Landlord-Friendly
- State Florida
- 87 Strongly Landlord-Friendly · R+3
- County
- — inherits STATE
- City
- — inherits STATE
ZIP-level market 33405
- Rents YoY
- 3.4%
- Active inventory
- 212
- Price-to-rent
- 7.8×
Monthly cashflow live
- Estimated rent
- $4,778 high interval (Pro) →
- Mortgage (P&I)
- −$2,334
- Tax from tax record
- −$591 /mo · $7,093/yr
- Insurance
- −$185
- HOA
- −$0
- Vacancy / Maint / Mgmt
- −$1,003
- Net cashflow
- $665
Break-even live
UW: 25.0% down · 7.5% · 30yr · 1.5% tax · 5.0% vac · 8.0% maint · 8.0% mgmt
Financing live
Cash to close
- Down payment
- $111,250
- Closing costs
- $13,350
- Reserves months
- —
- Total cash needed
- —
Loan-product check · same deal, 3 products live
Conventional
25% down · 7.5% · 30yr
- Down + closing
- —
- Monthly P&I
- —
- Monthly cashflow
- —
- DSCR
- —
- Eligible?
- —
Personal DTI + credit; lowest rate.
DSCR
20% down · 8.5% · 30yr
- Down + closing
- —
- Monthly P&I
- —
- Monthly cashflow
- —
- DSCR
- —
- Eligible?
- —
No personal income docs; deal must DSCR.
Hard money
10% down · 12.0% · 12mo
- Down + closing
- —
- Monthly P&I
- —
- Monthly cashflow
- —
- DSCR
- —
- Eligible?
- —
Short-term bridge; refi at stabilization.
Rent comps 40 comps
| Address | Beds | Baths | Sqft | Rent | $/sqft | DOM | Units | Dist |
|---|---|---|---|---|---|---|---|---|
| 3025 Robert Rd West Palm Beach, FL | 4.0 | 2.0 | 1678 | $3,146 | $1.87 | 7d | 1 | 0.24mi |
| 712 Tuscaloosa St West Palm Beach, FL | 4.0 | 2.0 | 1390 | $4,495 | $3.23 | 24d | 1 | 0.25mi |
| 748 Tallapoosa St West Palm Beach, FL | 3.0 | 2.0 | 1877 | $3,500 | $1.86 | 24d | 1 | 0.26mi |
| 521 Hampton Rd West Palm Beach, FL | 2.0 | 1.0 | 1188 | $4,000 | $3.37 | 24d | 1 | 0.33mi |
| 604 Piedmont Rd West Palm Beach, FL | 4.0 | 2.0 | 1329 | $3,500 | $2.63 | 7d | 1 | 0.38mi |
| 423 Avenida Alegre West Palm Beach, FL | 4.0 | 2.0 | 1700 | $6,500 | $3.82 | 3d | 1 | 0.43mi |
| 412 El Prado West Palm Beach, FL | 4.0 | 3.5 | 2111 | $11,000 | $5.21 | 7d | 1 | 0.44mi |
| 2741 Parker Ave West Palm Beach, FL | 2.0 | 2.0 | 1682 | $3,750 | $2.23 | 24d | 1 | 0.44mi |
| 3111 S Dixie Hwy West Palm Beach, FL | 3.0 | 1.0–2.0 | 1024 | $5,172 | $5.05 | 5d | 17 | 0.45mi |
| 300 Buckingham Rd West Palm Beach, FL | 3.0 | 2.0 | 1600 | $15,000 | $9.38 | 24d | 1 | 0.57mi |
| 236 Greymon Dr West Palm Beach, FL | 3.0 | 2.0 | 1813 | $8,500 | $4.69 | 24d | 1 | 0.62mi |
| 340 Walton Blvd West Palm Beach, FL | 3.0 | 2.5 | 1854 | $4,000 | $2.16 | 7d | 1 | 0.64mi |
| 945 Sunset Rd Unit 1 West Palm Beach, FL | 3.0 | 3.0 | 1505 | $5,300 | $3.52 | 24d | 1 | 0.67mi |
| 605 Sunset Rd West Palm Beach, FL | 3.0 | 2.0 | 1434 | $4,000 | $2.79 | 24d | 1 | 0.68mi |
| 240 Almeria Rd West Palm Beach, FL | 3.0 | 3.0 | 1092 | $9,000 | $8.24 | 4d | 1 | 0.71mi |
| 3210 Vincent Rd West Palm Beach, FL | 3.0 | 2.0 | 1551 | $8,500 | $5.48 | 24d | 1 | 0.72mi |
| 719 Briggs St West Palm Beach, FL | 3.0 | 2.0 | 1328 | $3,500 | $2.64 | 20d | 1 | 0.73mi |
| 616 Upland Rd West Palm Beach, FL | 3.0 | 2.0 | 1456 | $4,500 | $3.09 | 24d | 1 | 0.73mi |
| 616 Upland Rd West Palm Beach, FL | 3.0 | 2.0 | 1456 | $4,500 | $3.09 | 20d | 1 | 0.73mi |
| 833 Ardmore Rd West Palm Beach, FL | 3.0 | 2.5 | 1132 | $4,500 | $3.98 | 15d | 1 | 0.76mi |
| 833 Ardmore Rd West Palm Beach, FL | 3.0 | 2.5 | 1132 | $4,500 | $3.98 | 17d | 1 | 0.76mi |
| 2233 Dock St West Palm Beach, FL | 4.0 | 3.0 | 1926 | $5,300 | $2.75 | 24d | 1 | 0.82mi |
| 515 Ardmore Rd West Palm Beach, FL | 2.0 | 2.5 | 1741 | $6,895 | $3.96 | 22d | 1 | 0.83mi |
| 3701 S Flagler Dr Unit B303 West Palm Beach, FL | 2.0 | 2.0 | 1290 | $3,850 | $2.98 | 4d | 1 | 0.85mi |
| 110 Wilson Rd West Palm Beach, FL | 3.0 | 1.0 | 1433 | $8,000 | $5.58 | 24d | 1 | 0.87mi |
| 3800 Washington Rd West Palm Beach, FL | 2.0–3.0 | 2.0 | 1318 | $10,000 | $7.59 | 20d | 4 | 0.88mi |
| 3800 Washington Rd West Palm Beach, FL | 2.0–3.0 | 2.0 | 1318 | $10,000 | $7.59 | 7d | 5 | 0.88mi |
| 3800 Washington Rd West Palm Beach, FL | 2.0–3.0 | 2.0 | 1318 | $10,000 | $7.59 | 2d | 6 | 0.88mi |
| 4015 Washington Rd West Palm Beach, FL | 4.0 | 3.0 | 2199 | $12,500 | $5.68 | 24d | 1 | 0.89mi |
| 2109 Dock St West Palm Beach, FL | 3.0 | 2.0 | 1593 | $3,500 | $2.20 | 3d | 1 | 0.90mi |
| 3901 S Flagler Dr West Palm Beach, FL | 2.0–5.0 | 2.0–5.0 | 2266 | $6,000 | $2.65 | 3d | 6 | 0.92mi |
| 3901 S Flagler Dr West Palm Beach, FL | 2.0–5.0 | 2.0–5.0 | 2266 | $6,333 | $2.79 | 22d | 6 | 0.92mi |
| 4110 Washington Rd West Palm Beach, FL | 3.0 | 2.5 | 1971 | $12,500 | $6.34 | 24d | 1 | 0.94mi |
| 1911 Parker Ave West Palm Beach, FL | 2.0 | 2.0 | 1135 | $14,000 | $12.33 | 24d | 1 | 0.94mi |
| 1041 W Lakewood Rd West Palm Beach, FL | 3.0 | 2.5 | 1857 | $4,300 | $2.32 | 24d | 1 | 0.95mi |
| 4300 Washington Rd West Palm Beach, FL | 3.0 | 2.5 | 1892 | $9,800 | $5.18 | 24d | 1 | 0.97mi |
| 733 Green St West Palm Beach, FL | 2.0 | 1.0 | 1116 | $3,400 | $3.05 | 3d | 1 | 0.97mi |
| 832 Green St #1 West Palm Beach, FL | 3.0 | 2.0 | 1700 | $4,550 | $2.68 | 11d | 1 | 0.99mi |
| 5008 Parker Ave West Palm Beach, FL | 3.0 | 2.0 | 1318 | $4,000 | $3.03 | 24d | 1 | 0.99mi |
| 5003 Garden Ave West Palm Beach, FL | 4.0 | 2.0 | 1220 | $2,950 | $2.42 | 14d | 1 | 1.00mi |
Listing history 22 events
-
2026-05-21status Pending
-
2026-05-04$445,000 Active
-
2026-04-08historical
-
2025-10-08$475,000 Active
-
2025-10-07historical
-
2025-09-06price $495,000
-
2025-09-06price $490,000
-
2025-08-31historical
-
2025-07-23price $500,000
-
2025-06-24price $515,000
-
2025-02-10historical $2,300
-
2024-12-21$529,111 Active
-
2024-12-18price $2,300
-
2024-11-09price $2,400
-
2024-09-07$49,000 Active
-
2024-08-29price $2,600
-
2024-08-12$2,700
-
2022-10-13soldstatus $420,000
-
2022-09-22soldstatus $420,000 Closed
-
2022-08-24historical Active Under Contract
-
2022-08-04$420,000 Active
-
2005-05-17soldstatus $160,000
ⓘ Source: listings_history table (triggers on properties + properties_extension) + one-shot
backfill from property_details.listing_events for pre-trigger history.
Tax reassessment forecast FL · Resets to sale price
- Current annual tax
- $7,093 · $591/mo
- Projected year-2 tax
- $7,093 · $591/mo
- Expected delta
- $0/yr ($0/mo · 0.0%)
ⓘ Screening estimate from a state-policy table — verify with the county assessor before closing.
Climate risk First Street
- Flood 3/10 Moderate FEMA zone X (unshaded) · 20% chance over 30 yrs
- Wildfire 1/10 Low
- Heat 10/10 Extreme 7 d/yr ≥105°F today · 26 d/yr by 30 yrs out
- Wind 10/10 Extreme 99% chance of damaging wind over 30 yrs
- Air quality 2/10 Low 1 unhealthy d/yr today · 1 by 30 yrs out
Nearby sold comps map
Loading sold comps map…
Walkable amenities ~0.75 mi
Loading nearby amenities…
Taxation est. · year 1
- Rental income
- $57,338
- − Mortgage interest
- −$24,927
- − Property taxes
- −$7,093
- − Insurance
- −$2,225
- − Repairs & maintenance
- −$4,587
- − Management
- −$4,587
- − Depreciation
- −$12,945
- Taxable income
- $974
- Est. tax owed @ 24.0%
- −$234
- After-tax cash flow
- $7,742/yr
For passive investors: Depreciation is non-cash, so a rental often shows a tax loss while cash-flowing — sheltering income. Rental losses are passive: they offset passive income freely, and up to $25,000/yr can offset ordinary (W-2) income if you actively participate and your MAGI is under $100k (phasing out to $0 by $150k); unused losses carry forward. On sale, claimed depreciation is recaptured at up to 25%, and gains may owe capital-gains tax (a 1031 exchange can defer both). Figures are a year-1 estimate at your 24.0% rate — not tax advice; consult a CPA.
Schools (NCES district)
- District
- Palm Beach
- NCES district ID
- 1201500
- Math proficiency
- 46% ▼ -16.00%
- Reading proficiency
- 53% ▼ -4.00%
- Median HH income
- $53,943
- Composite
- 42.72/100
- National rank
- #3160
- State rank
- #34 of 73 in FL
Livability — West Palm Beach
- Score
- 82/100
- State rank
- #75
- US rank
- #1255
Category grades
Schools grade is shown separately in the Schools card above.
Census & demographics
- Census place
- West Palm Beach, FL
- County
- Palm Beach County · 1,438,312 people
- City population
- 222,012
- Metro
- Miami-Fort Lauderdale-Pompano Beach, FL
- Population (ZIP)
- 19,780
- Household income
- $87,341
- Rent vs Own
- Severe rent burden
- 1055.0
Population outlook (Palm Beach County) Hauer SSP2
- Today (2025)
- 1,637,487 people
- By 2030
- 1,743,255 · +6.5%
- By 2040
- 1,948,712 · +19.0%
- By 2050
- 2,132,979 · +30.3%
- By 2075
- 2,530,027 · +54.5%
- By 2100
- 2,706,979 · +65.3%
Race, ethnicity, and origin ACS 2023
- Neighborhood character
- Majority Hispanic (51%)
- Race & ethnicity
- Hispanic / Latino 51% White 44% Two or more races 24% Black 3% Asian 1%
- Hispanic origin (detail)
- Mexican 7% Puerto Rican 5% Cuban 17% Dominican 2%
- Common ancestry
- Scotch-Irish 2% Slovak 2% Romanian 2%
- Foreign-born
- 37% · Canada, Guatemala, Jamaica
- Languages at home
- 50% English-only · Spanish 44% Other Indo-European 2% French/Haitian/Cajun 1%
Political lean MEDSL · Palm Beach
- 2024 margin
- Toss-up / Even · D 50.0% · R 49.2%
- 2008→2024 swing
- -22.1pp toward R · 2008: 22.9pp · 2024: 0.8pp
- All cycles
- 2024: D+0.8 2020: D+12.8 2016: D+15.3 2012: D+17.0 2008: D+22.9
Not yet ingested
- Civics
- —
Market trends
- HPI YoY
- ▼ -662.68%
- Current HPI
- 509.781
- Rent YoY
- ▲ 3.44%
- Metro
- Miami-Fort Lauderdale-Pompano Beach, FL
- State GDP YoY
- ▲ 3.28%
- F500 in state
- 36
Industry mix (Fortune 500 HQ in FL)
| Industry | F500 HQs | Revenue |
|---|---|---|
| Industrial Technology | 2 | $29B |
|
||
| Insurance | 2 | $17B |
|
||
| Retail | 1 | $60B |
|
||
| Technology Distribution | 1 | $58B |
|
||
| Homebuilding | 1 | $35B |
|
||
| Technology Manufacturing | 1 | $35B |
|
||
Price history
+178.1% since first listed22 events — show timeline
- 2026-05-21 Pending — MARMLS
- 2026-05-04 Listed $445,000 MARMLS
- 2026-04-08 Listing Removed — MARMLS
- 2025-10-08 Listed $475,000 MARMLS
- 2025-10-07 Listing Removed — MARMLS
- 2025-09-06 Price Changed $495,000 MARMLS
- 2025-09-06 Price Changed $490,000 MARMLS
- 2025-08-31 Listing Removed — MARMLS
- 2025-07-23 Price Changed $500,000 MARMLS
- 2025-06-24 Price Changed $515,000 MARMLS
- 2025-02-10 Rental Removed $2,300 MARMLS
- 2024-12-21 Listed $529,111 MARMLS
- 2024-12-18 Price Changed $2,300 MARMLS
- 2024-11-09 Price Changed $2,400 MARMLS
- 2024-09-07 Listed $49,000 MARMLS
- 2024-08-29 Price Changed $2,600 MARMLS
- 2024-08-12 Listed for Rent $2,700 MARMLS
- 2022-10-13 Sold (Public Records) $420,000 Public Records
- 2022-09-22 Sold (MLS) $420,000 Beaches MLS
- 2022-08-24 Contingent — Beaches MLS
- 2022-08-04 Listed $420,000 Beaches MLS
- 2005-05-17 Sold (Public Records) $160,000 Public Records
Property tax history
+14.7%/yrLatest (2025): $7,093 · +0.8% YoY. Source: county tax records.
Cash-flow waterfall
monthlySold comps — $/sqft
last 12 mo · ≤1 miLoading sold comps…