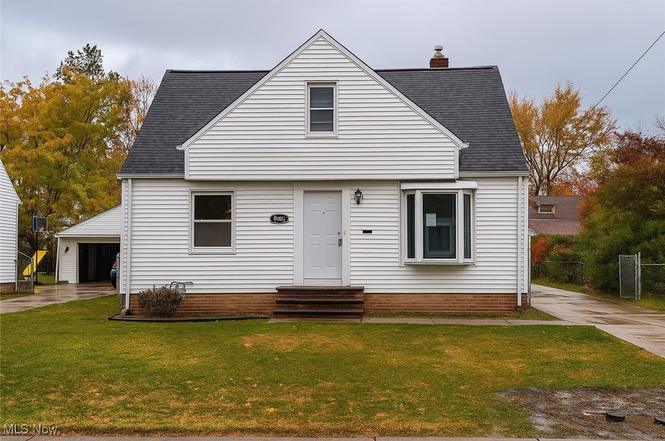
30325 Mildred Dr · Willowick, OH
Flood risk 1/10 · Minimal
- FEMA flood zone
- X (unshaded)
- Chance of flooding over 30 yrs
- 0.0%
- Est. flood insurance / yr
- $473 – $860
Fire risk 1/10 · Minimal
- Est. fire insurance / yr
- $713 – $1,323
Heat risk 3/10 · Minor
- Hot days now (above 95°F)
- 7 days/yr
- Hot days in 30 yrs
- 18 days/yr
Wind risk 1/10 · Minimal
- Chance of severe wind over 30 yrs
- —
Air-quality risk 3/10 · Minor
- Unhealthy air days now
- 3 days/yr
- Unhealthy air days in 30 yrs
- 4 days/yr
Risk factors via First Street. Map © Google.
Why this score? — see what drove the C+ grade
The composite is a weighted blend of 9 inputs, each scored 0–100. Each bar is that input's sub-score; the figure is the points it added to the 100-point composite (weight × sub-score).
- Cash flow +20.9/30.0
- ARV discount +15.0/15.0
- 1% rule +7.1/10.0
- DSCR +6.7/10.0
- Schools +4.3/10.0
- Livability +4.2/5.0
- Rent growth +3.7/5.0
- Condition / age +2.5/5.0
- Appreciation +0.0/10.0
$149,900
🖨 Deal sheet 📄 Offer letter ✓ Due diligence
Listing remarks
Welcome to 30325 Mildred Street — a delightful Cape Cod-style home in the heart of Willowick that perfectly blends traditional charm with everyday functionality. With approximately 1,170 square feet of living space, this three-bedroom, one-bath residence invites you into a warm and inviting atmosphere from the moment you step inside. The bright living room greets you with soft natural light pouring through a large front bay window, creating the perfect setting for morning coffee or cozy evenings in. Just beyond, the refreshed kitchen offers space to craft your favorite meals and gather with loved ones, opening seamlessly to the home’s practical layout. Two comfortable bedrooms o
Key facts
- Cape cod style home
- Refreshed kitchen
- 7,501 sq ft lot
Tags
Property features AI
Exterior
- Parking: Detached garage; Garage faces front; Two garage spaces; Driveway parking; Off-street parking, on-site
- Utilities: Public water; Public sewer
- Home design: Two-story home; Frame construction with vinyl siding; Asphalt/fiberglass roof; Block and brick/mortar foundation
- Construction: Built in (year from public records); Frame with vinyl siding; Asphalt/fiberglass roof; Block and brick/mortar foundation
- Exterior features: Exterior lighting; Back yard with chain link fencing; Fenced yard; Concrete driveway and paved on-site parking; Storage
Interior
- Kitchen: Eat-in kitchen; Laminate counters
- Bedrooms: Two main-level bedrooms; Additional bedroom on second level
- Bathrooms: One full bathroom (main level)
- Heating & cooling: Forced air heating (gas); Central air conditioning
- Interior features: Built-in features; Ceiling fan(s); Chandelier; Crown molding; Eat-in kitchen; Laminate counters; Recessed lighting; Storage; Blinds; Bay window(s)
- Laundry & utility: Laundry in basement / lower level
Neighborhood map
What this means for you Summary
Snapshot
- This is a 3-bed/1.5-bath single-family listed at $150k.
Deal economics
- At list price, monthly cash flow is $208 ($3k/yr) — positive.
- The deal already cash-flows at list — no discount required.
- Meets the 1% rule at list price ($2k rent vs $150k).
- Recommended offer: $136k (9.0% below list) — sets the bar for market timing.
- Cap rate 8.0% vs local median 5.4% in Willowick — top-decile yield for the area; either an underpriced asset or a hidden risk that comps aren't pricing in. Stress-test before assuming the spread holds.
Location & tenants
- Location reads 84/100 on livability (#50 in OH, #706 nationally) — a professional / high-income tenant draw. Strengths: crime A+, amenities A+, cost of living A+; Watch: commute F.
- Willoughby-Eastlake City (suburban): math 42% / reading 58% proficiency, ranked #434 of 656 in OH (top 66%) — acceptable for families but not a draw, mixed tenant base, ~2y average lease.
- Market conditions: Rents rising fast (+4.8%/yr); 129 active listings in the ZIP; 5 comparable units currently listed for rent nearby; rentals leasing fast (median 3d on market — plan ~1-2 weeks tenant-placement turnaround); 448 units permitted in Lake County in 2024 (0 in 5+ unit buildings).
- This rent runs 30% of the median local income ($72k/yr) — at the standard rent-burdened threshold; future hikes will face affordability resistance.
Forward outlook
- Local home prices are declining (-3.0%/yr); year-one equity from $1k of loan paydown is wiped out by about $4k of value loss. Plan a longer hold.
- Lake County population projected to shrink 8% by 2050 — rents likely to lag national; underwrite the cash flow, not the appreciation.
Negotiation context
- It's been on market 103 days — a 9% lower offer ($136k) is reasonable based on typical stale-listing flexibility.
- 4 sale attempts with the ask held roughly flat each time — persistent listings suggest the price (not the market) is what's stuck; bring a comps-based counter.
Risks & watch-outs
- Watch-outs: property tax is 3.0% of price; built in 1957 — expect roof / HVAC / electrical / plumbing capex.
Questions for the listing agent
- It's been on market 103 days. Have you received any prior offers? Is the seller open to a 9% concession, seller financing, or rate buy-down credit?
- Built in 1957 — when were the roof, HVAC, electrical panel, plumbing, and water heater last replaced?
- Property tax is high relative to price — has the assessment been appealed recently, and will the sale trigger a re-assessment?
- Why hasn't it sold? Are there any deal-killer items the seller is aware of (foundation, flood, title, zoning, code violations)?
- Is there a deadline driving the sale (1031 exchange, divorce, estate, relocation)? That informs how much negotiation room exists.
- Schools are B-rated — typically a magnet for longer-tenancy family renters. What's the average tenant stay here, and is there a school-zone premium baked into asking?
- What's the average days-on-market for RENTAL listings here right now (not sales)? A rising rental-DOM trend means longer vacancies and softer asking-rent achievability than the comps imply.
- What's the recent tenant-quality profile in this submarket — average credit score on applications, eviction rate, late-payment / NSF rate, and stable-employment percentage? A property-management company in the area should have these aggregated.
- How much new for-sale + rental construction is in the pipeline within 1–3 miles? Heavy new supply typically softens prices + rents 12–24 months out; constrained supply supports both.
Investment metrics
- 1% rule
- 1.21% ✓
- Cap rate
- 7.96%
- Cash-on-cash
- 5.96%
- DSCR
- 1.27
- GRM
- 6.9
CMA / ARV
- ARV (on-the-fly)
- $234,000
- Comps found
- 12
Show comp detail 12 sales within ~0.75 mi
| Address | Dist | Beds/Ba | Sqft | Sold | Price | $/sf | Match |
|---|---|---|---|---|---|---|---|
| 30408 Mildred | 0.04mi | 3/2.0 | 1,530 (-2%) | 2mo | $224,500 | $147 | 92 |
| 30321 Gebhart Pl | 0.25mi | 3/2.0 | 1,496 (-4%) | 4mo | $182,000 | $122 | 76 |
| 430 E 309th St | 0.41mi | 3/1.0 | 1,596 (+2%) | 4mo | $153,000 | $96 | 72 |
| 30615 Crescent Dr | 0.26mi | 3/1.5 | 1,386 (-11%) | 4mo | $190,000 | $137 | 66 |
| 30104 Warren Rd | 0.53mi | 3/1.0 | 1,632 (+5%) | 2mo | $220,000 | $135 | 64 |
| 28973 Blissfield Dr | 0.66mi | 3/2.5 | 1,556 (-0%) | 1mo | $292,820 | $188 | 64 |
| 344 E 315th St | 0.74mi | 3/1.5 | 1,600 (+3%) | 3mo | $235,500 | $147 | 59 |
| 30025 Elgin Rd | 0.58mi | 3/2.0 | 1,396 (-10%) | 1mo | $225,000 | $161 | 52 |
| 30195 Truman Ave | 0.59mi | 3/2.0 | 1,702 (+9%) | 4mo | $280,000 | $165 | 52 |
| 346 Lakewick Ln | 0.60mi | 3/3.0 | 1,700 (+9%) | 1mo | $335,000 | $197 | 50 |
| 31705 Daniel Dr | 0.54mi | 3/1.5 | 1,332 (-15%) | 2mo | $199,900 | $150 | 49 |
| 801 Charles St | 0.69mi | 3/1.5 | 1,366 (-12%) | 4mo | $210,000 | $154 | 44 |
Match score weights: distance 35% · size 25% · config 20% · recency 20%. Top-matched comps best support the ARV.
Projected returns pro-forma
-3.0% appreciation · 4.81% rent growth · sell at horizon
- IRR
- -4.7%
- Equity multiple
- 0.82×
- Total profit
- $-7,521
- Equity at exit
- $22,351
- IRR
- 7.3%
- Equity multiple
- 1.60×
- Total profit
- $25,388
- Equity at exit
- $12,961
Cash invested: $41,972 (down + closing). Projections, not guarantees.
Landlord ↔ Tenant lean methodology
- Overall (STATE)
- 73 Landlord-Friendly
- State Ohio
- 73 Landlord-Friendly · R+6
- County
- — inherits STATE
- City
- — inherits STATE
ZIP-level market 44095
- Rents YoY
- 4.8%
- Active inventory
- 129
- Price-to-rent
- 6.9×
Monthly cashflow live
- Estimated rent
- $1,808 high interval (Pro) →
- Mortgage (P&I)
- −$786
- Tax from tax record
- −$371 /mo · $4,453/yr
- Insurance
- −$62
- HOA
- −$0
- Vacancy / Maint / Mgmt
- −$380
- Net cashflow
- $208
Break-even live
UW: 25.0% down · 7.5% · 30yr · 1.5% tax · 5.0% vac · 8.0% maint · 8.0% mgmt
Financing live
Cash to close
- Down payment
- $37,475
- Closing costs
- $4,497
- Reserves months
- —
- Total cash needed
- —
Loan-product check · same deal, 3 products live
Conventional
25% down · 7.5% · 30yr
- Down + closing
- —
- Monthly P&I
- —
- Monthly cashflow
- —
- DSCR
- —
- Eligible?
- —
Personal DTI + credit; lowest rate.
DSCR
20% down · 8.5% · 30yr
- Down + closing
- —
- Monthly P&I
- —
- Monthly cashflow
- —
- DSCR
- —
- Eligible?
- —
No personal income docs; deal must DSCR.
Hard money
10% down · 12.0% · 12mo
- Down + closing
- —
- Monthly P&I
- —
- Monthly cashflow
- —
- DSCR
- —
- Eligible?
- —
Short-term bridge; refi at stabilization.
Rent comps 5 comps
| Address | Beds | Baths | Sqft | Rent | $/sqft | DOM | Units | Dist |
|---|---|---|---|---|---|---|---|---|
| 459 Clarmont Rd Willowick, OH | 4.0 | 2.0 | 1488 | $1,875 | $1.26 | 43d | 1 | 0.37mi |
| 29103 Barjode Rd Willowick, OH | 3.0 | 2.0 | 1116 | $1,950 | $1.75 | 19d | 1 | 0.54mi |
| 31621 N Marginal Dr Unit B Willowick, OH | 3.0 | 1.5 | 1200 | $1,550 | $1.29 | 3d | 1 | 0.62mi |
| 30620 Euclid Ave Wickliffe, OH | 2.0 | 1.0 | 1500 | $1,500 | $1.00 | 3d | 1 | 1.10mi |
| 360 E 326th St Willowick, OH | 2.0 | 2.0 | 1053 | $1,447 | $1.37 | 2d | 1 | 1.11mi |
Listing history 14 events
-
2026-04-13status Pending
-
2026-03-20status Active
-
2026-01-30status Pending
-
2025-11-11$149,900 Active
-
2025-10-30historical
-
2025-10-17price $149,900
-
2025-09-19price $159,900
-
2025-09-02$164,900 Active
-
2025-06-16status Pending
-
2025-06-13historical
-
2025-06-02price $164,900
-
2025-05-05price $174,900
-
2025-04-09price $184,900
-
2025-03-10$189,500 Active
ⓘ Source: listings_history table (triggers on properties + properties_extension) + one-shot
backfill from property_details.listing_events for pre-trigger history.
Tax reassessment forecast OH · Partial reset (capped growth)
- Current annual tax
- $4,453 · $371/mo
- Projected year-2 tax
- $4,453 · $371/mo
- Expected delta
- $0/yr ($0/mo · 0.0%)
ⓘ Screening estimate from a state-policy table — verify with the county assessor before closing.
Climate risk First Street
- Flood 1/10 Low FEMA zone X (unshaded) · 0% chance over 30 yrs
- Wildfire 1/10 Low
- Heat 3/10 Moderate 7 d/yr ≥95°F today · 18 d/yr by 30 yrs out
- Wind 1/10 Low
- Air quality 3/10 Moderate 3 unhealthy d/yr today · 4 by 30 yrs out
Nearby sold comps map
Loading sold comps map…
Walkable amenities ~0.75 mi
Loading nearby amenities…
Taxation est. · year 1
- Rental income
- $21,693
- − Mortgage interest
- −$8,397
- − Property taxes
- −$4,453
- − Insurance
- −$750
- − Repairs & maintenance
- −$1,735
- − Management
- −$1,735
- − Depreciation
- −$4,361
- Taxable income
- $262
- Est. tax owed @ 24.0%
- −$63
- After-tax cash flow
- $2,439/yr
For passive investors: Depreciation is non-cash, so a rental often shows a tax loss while cash-flowing — sheltering income. Rental losses are passive: they offset passive income freely, and up to $25,000/yr can offset ordinary (W-2) income if you actively participate and your MAGI is under $100k (phasing out to $0 by $150k); unused losses carry forward. On sale, claimed depreciation is recaptured at up to 25%, and gains may owe capital-gains tax (a 1031 exchange can defer both). Figures are a year-1 estimate at your 24.0% rate — not tax advice; consult a CPA.
Schools (NCES district)
- District
- Willoughby-Eastlake City
- NCES district ID
- 3904510
- Math proficiency
- 42% ▼ -21.00%
- Reading proficiency
- 58% ▼ -11.00%
- Median HH income
- $52,500
- Composite
- 42.96/100
- National rank
- #3110
- State rank
- #434 of 656 in OH
Livability — Willowick
- Score
- 84/100
- State rank
- #50
- US rank
- #706
Category grades
Schools grade is shown separately in the Schools card above.
Census & demographics
- Census place
- Willowick, OH
- County
- Lake County · 204,927 people
- Metro
- Cleveland-Elyria, OH
- Population (ZIP)
- 32,363
- Household income
- $71,543
- Rent vs Own
- Severe rent burden
- 590.0
Population outlook (Lake County) Hauer SSP2
- Today (2025)
- 230,022 people
- By 2030
- 228,151 · -0.8%
- By 2040
- 221,018 · -3.9%
- By 2050
- 212,754 · -7.5%
- By 2075
- 200,309 · -12.9%
- By 2100
- 183,315 · -20.3%
Race, ethnicity, and origin ACS 2023
- Neighborhood character
- Predominantly White (87%)
- Race & ethnicity
- White 87% Black 5% Two or more races 5% Hispanic / Latino 3%
- Common ancestry
- Romanian 8% Slovak 2% Lithuanian 2%
- Foreign-born
- 3% · Canada
- Languages at home
- 94% English-only · Russian/Polish/Slavic 3% Spanish 1% German/W. Germanic 1%
Political lean MEDSL · Lake
- 2024 margin
- R (+14.3) · D 42.4% · R 56.7%
- 2008→2024 swing
- -15.2pp toward R · 2008: 0.8pp · 2024: -14.3pp
- All cycles
- 2024: R+14.3 2020: R+13.6 2016: R+15.6 2012: R+1.7 2008: D+0.8
Not yet ingested
- Civics
- —
Market trends
- HPI YoY
- ▼ -187.78%
- Current HPI
- 171.8121
- Rent YoY
- ▲ 4.81%
- Metro
- Cleveland-Elyria, OH
- State GDP YoY
- ▲ 1.98%
- F500 in state
- 48
Industry mix (Fortune 500 HQ in OH)
| Industry | F500 HQs | Revenue |
|---|---|---|
| Insurance | 3 | $145B |
|
||
| Industrial Machinery | 3 | $49B |
|
||
| Financial Services | 3 | $24B |
|
||
| Consumer Goods | 2 | $93B |
|
||
| Aerospace / Defense | 2 | $47B |
|
||
| Utilities | 2 | $33B |
|
||
Price history
-20.9% since first listed14 events — show timeline
- 2026-04-13 Pending — MLSNOW
- 2026-03-20 Relisted — MLSNOW
- 2026-01-30 Pending — MLSNOW
- 2025-11-11 Listed $149,900 MLSNOW
- 2025-10-30 Listing Removed — MLSNOW
- 2025-10-17 Price Changed $149,900 MLSNOW
- 2025-09-19 Price Changed $159,900 MLSNOW
- 2025-09-02 Listed $164,900 MLSNOW
- 2025-06-16 Pending — MLSNOW
- 2025-06-13 Listing Removed — MLSNOW
- 2025-06-02 Price Changed $164,900 MLSNOW
- 2025-05-05 Price Changed $174,900 MLSNOW
- 2025-04-09 Price Changed $184,900 MLSNOW
- 2025-03-10 Listed $189,500 MLSNOW
Property tax history
+3.2%/yrLatest (2025): $4,453 · +0.4% YoY. Source: county tax records.
Cash-flow waterfall
monthlySold comps — $/sqft
last 12 mo · ≤1 miLoading sold comps…